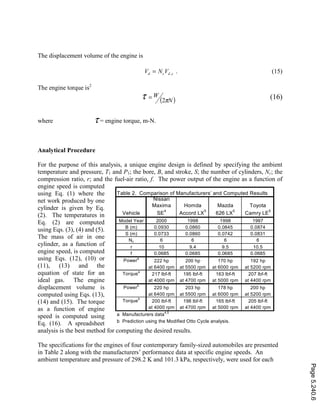
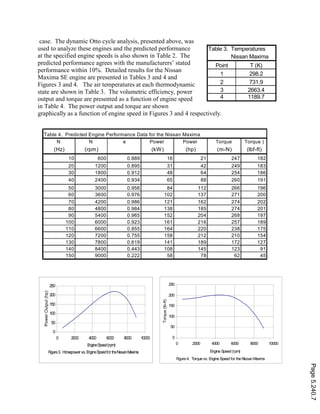
The document describes a dynamic Otto cycle analysis that models the performance of spark ignition internal combustion engines. It makes three modifications to the static air-standard Otto cycle analysis: 1) using representative specific heats and heat ratios for each process, 2) relating heat release during combustion to engine parameters, and 3) including an equation for volumetric efficiency as a function of engine speed. This dynamic analysis predicts engine power and torque curves with reasonable accuracy by modeling the mass of air and temperatures at each state as engine speed varies. Sample results are shown for a Nissan Maxima engine that agree well with manufacturer specifications.

 3/1
0665.0//11700 frrqr −= (7)
where f = the fuel-air ratio, kg fuel/kg air.
The chemically correct value of the fuel-air ratio is f = 0.0665 and its practical range is
0.0600 < f < 0.0700
where the lower limit corresponds to a very fuel lean mixture ratio and the upper limit
corresponds to a very rich mixture ratio. Lean mixture ratios (f < 0.0665) tend to result in better
fuel economy and more oxides of nitrogen in the exhaust gases while rich mixture ratios (f >
0.0665) tend to result in greater power output and more carbon monoxide and hydrocarbons in
the exhaust gases.
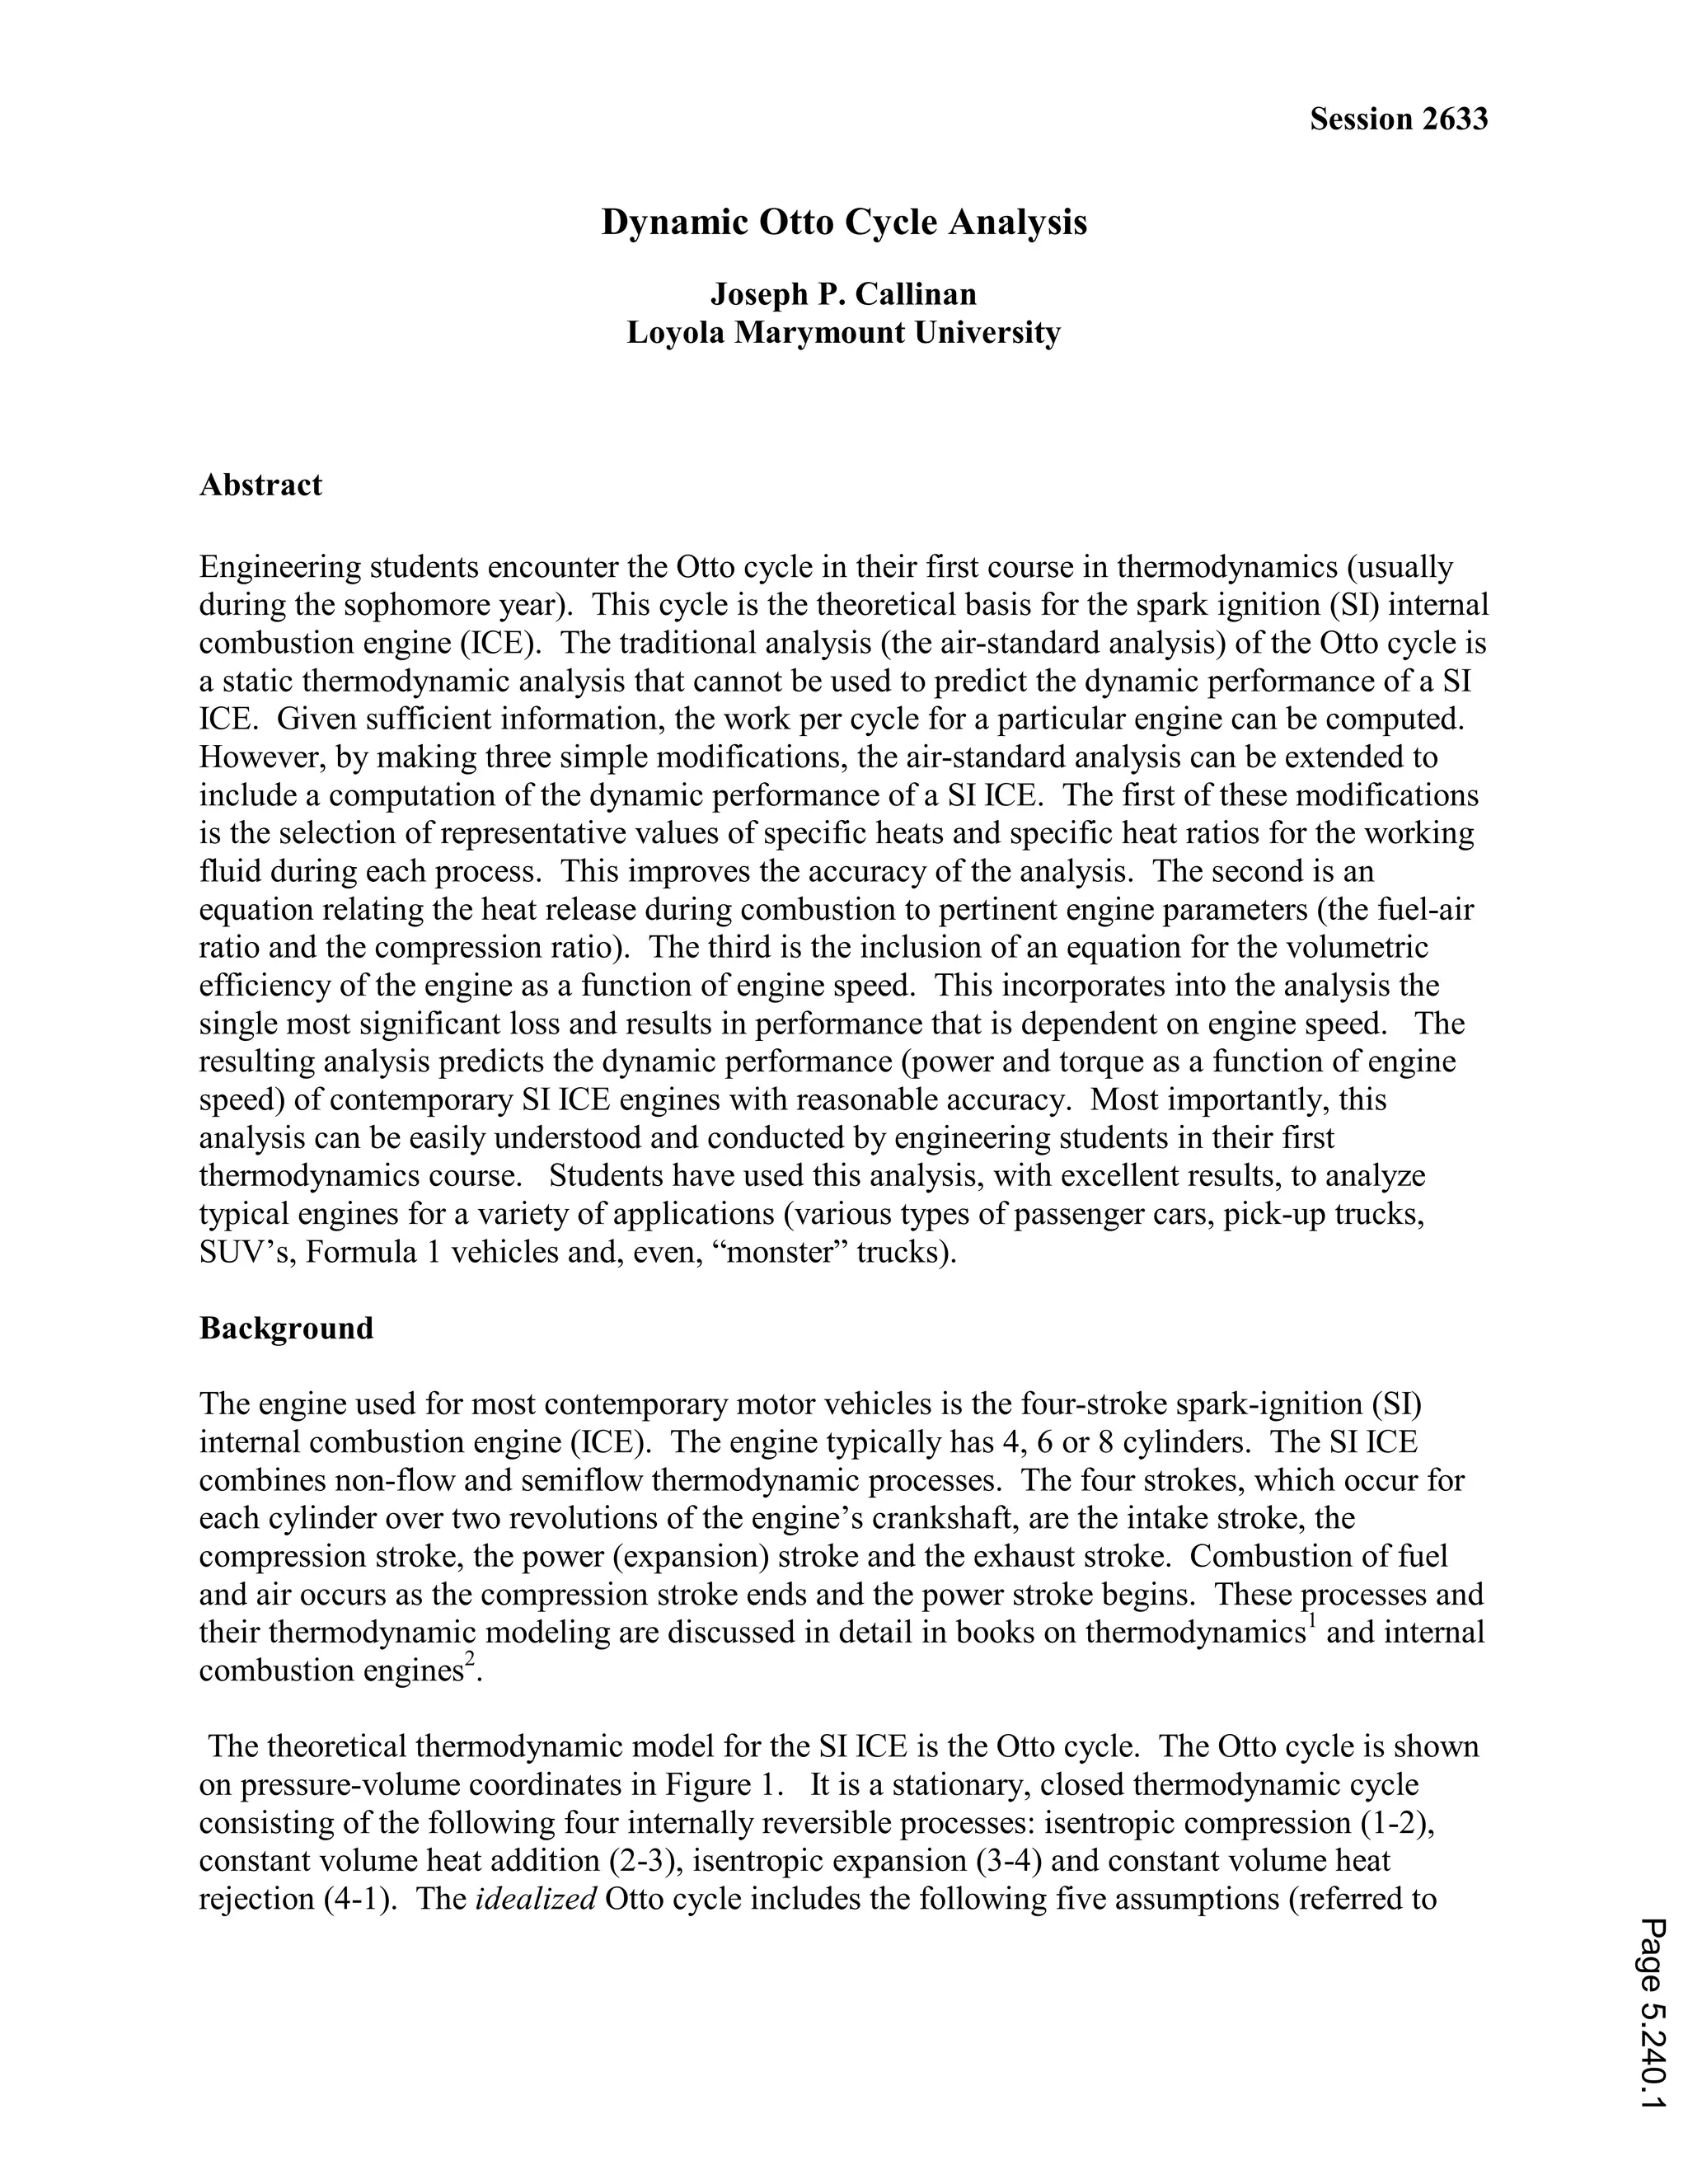
The power output of an actual SI ICE
increases as engine speed increases, reaching
a maximum and then decreasing as engine
speed continues to increase (Figure 2). The
deviation from the linear relationship
(described above) for the idealized Otto cycle
is primarily a consequence of the engine’s
inability to efficiently pump fresh air into the
cylinder as the piston speed (engine speed)
increases. This phenomenon can be
incorporated into the Otto cycle analysis
through the introduction of the volumetric
efficiency of the engine2
. For this analysis,
the volumetric efficiency, e, is defined as
cac mme /= (8)
where mc = the actual mass of air contained in one cylinder, kg, and
mca = mass of air, at ambient temperature and pressure, contained in one
cylinder, kg.
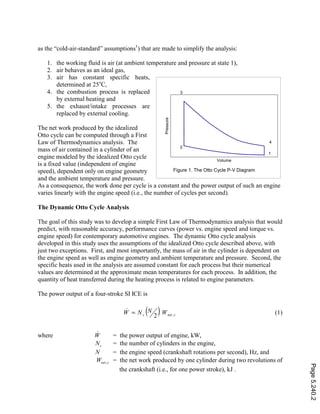
Table 1. Representative
Property Values
1
Property Temperature
cv,c = 0.736 kJ/kg-K 470 K
kc = 1.39 470 K
cv,h = 0.800 kJ/kg-K 750 K
cv,e = 0.820 kJ/kg-K 840 K
Figure2. PowerOutputvs. EngineSpeed
EngineSpeed
PowerOutput
Page5.240.4](https://image.slidesharecdn.com/dynamic-otto-cycle-analysis-170322084334/85/Dynamic-otto-cycle-analysis-4-320.jpg)
![The mass of air at ambient temperature and pressure contained in one cylinder is
1Vmca αρ= (9)
where ρa = the density of air at the ambient temperature, T1, and pressure, P1,
(computed using the equation of state for an ideal gas), kg/m3
.
An appropriate relationship for the volumetric efficiency of engines for contemporary
family-sized automobiles, found by studying the performance of this class of automobile, is
897.010719.110651.91067.7 32537
+×−×+×−= −−−
NNNe (10)
where 0 < N < 150 Hz.
Equation (5) applies to engines that are neither supercharged nor turbocharged and that have
their maximum power output occurring at 6600 rpm (110 Hz). This equation can be generalized
to allow for turbocharging, supercharging and higher or lower operational speeds (characteristic
of other classes of motor vehicles) as follows,
)897.010719.110651.91067.7( 32537
+×−×+×−= −−−
pppb NNNFe (11)
where Fb = Pi/Pa = turbocharging boost factor,
Pa = ambient pressure, kPa,
Pi = engine inlet pressure after turbo/supercharging, kPa,
Np = 110 (N/Nmax) = engine speed parameter, Hz, ( 0 < Np < 150 Hz) and
Nmax = engine speed at which maximum power output occurs, Hz
Combining Equations (8) and (9), the mass of air contained in one cylinder is
1Vemc αρ= (12)
The volume of one cylinder, V1, can be expressed in terms of engine parameters as follows,
( )[ ]1/)4/( 2
1 −= rrSBV π (13)
where B = the cylinder bore (diameter), m, and
S = the piston stroke, m.
The displacement volume of one cylinder can be expressed as
( ) rrVVVV cd /1121, −=−= (14)
Page5.240.5](https://image.slidesharecdn.com/dynamic-otto-cycle-analysis-170322084334/85/Dynamic-otto-cycle-analysis-5-320.jpg)