Download as PDF, PPTX

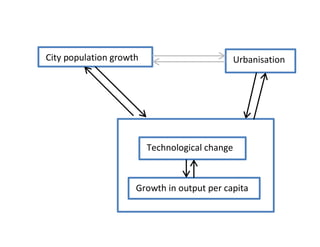
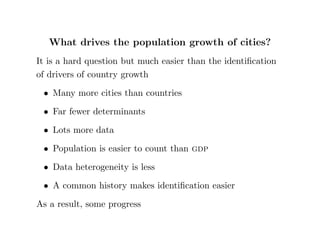
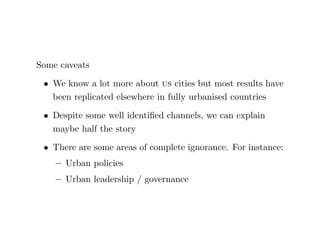

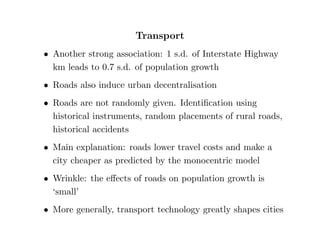
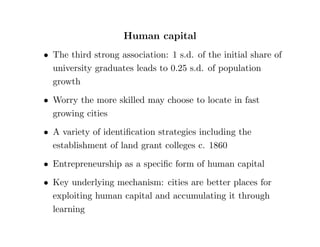


1) The main drivers of city population growth are amenities like climate, transportation infrastructure like roads, and human capital factors like education levels. 2) While these factors explain about half of city growth patterns, there are still many unknowns like the impacts of urban policies and leadership. 3) Cities may positively impact economic growth by fostering physical capital accumulation through agglomeration economies and especially by greatly increasing human capital development and productivity.


