Download as PDF, PPTX


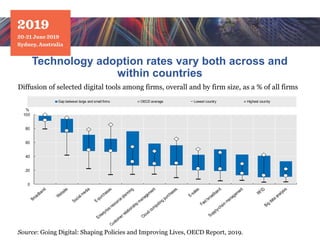
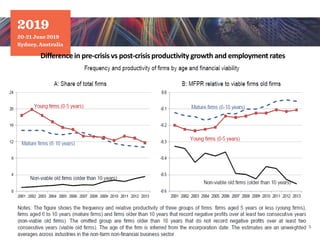
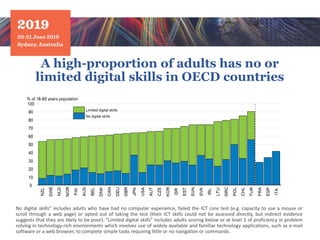

The document discusses challenges in harnessing the full productivity potential of digital technologies. It shows that technology adoption rates vary both across and within countries, as well as between large and small firms within countries. Data is also presented showing differences in pre-crisis and post-crisis productivity growth and employment rates. Additionally, the document notes that a high proportion of adults in OECD countries have no or limited digital skills.


