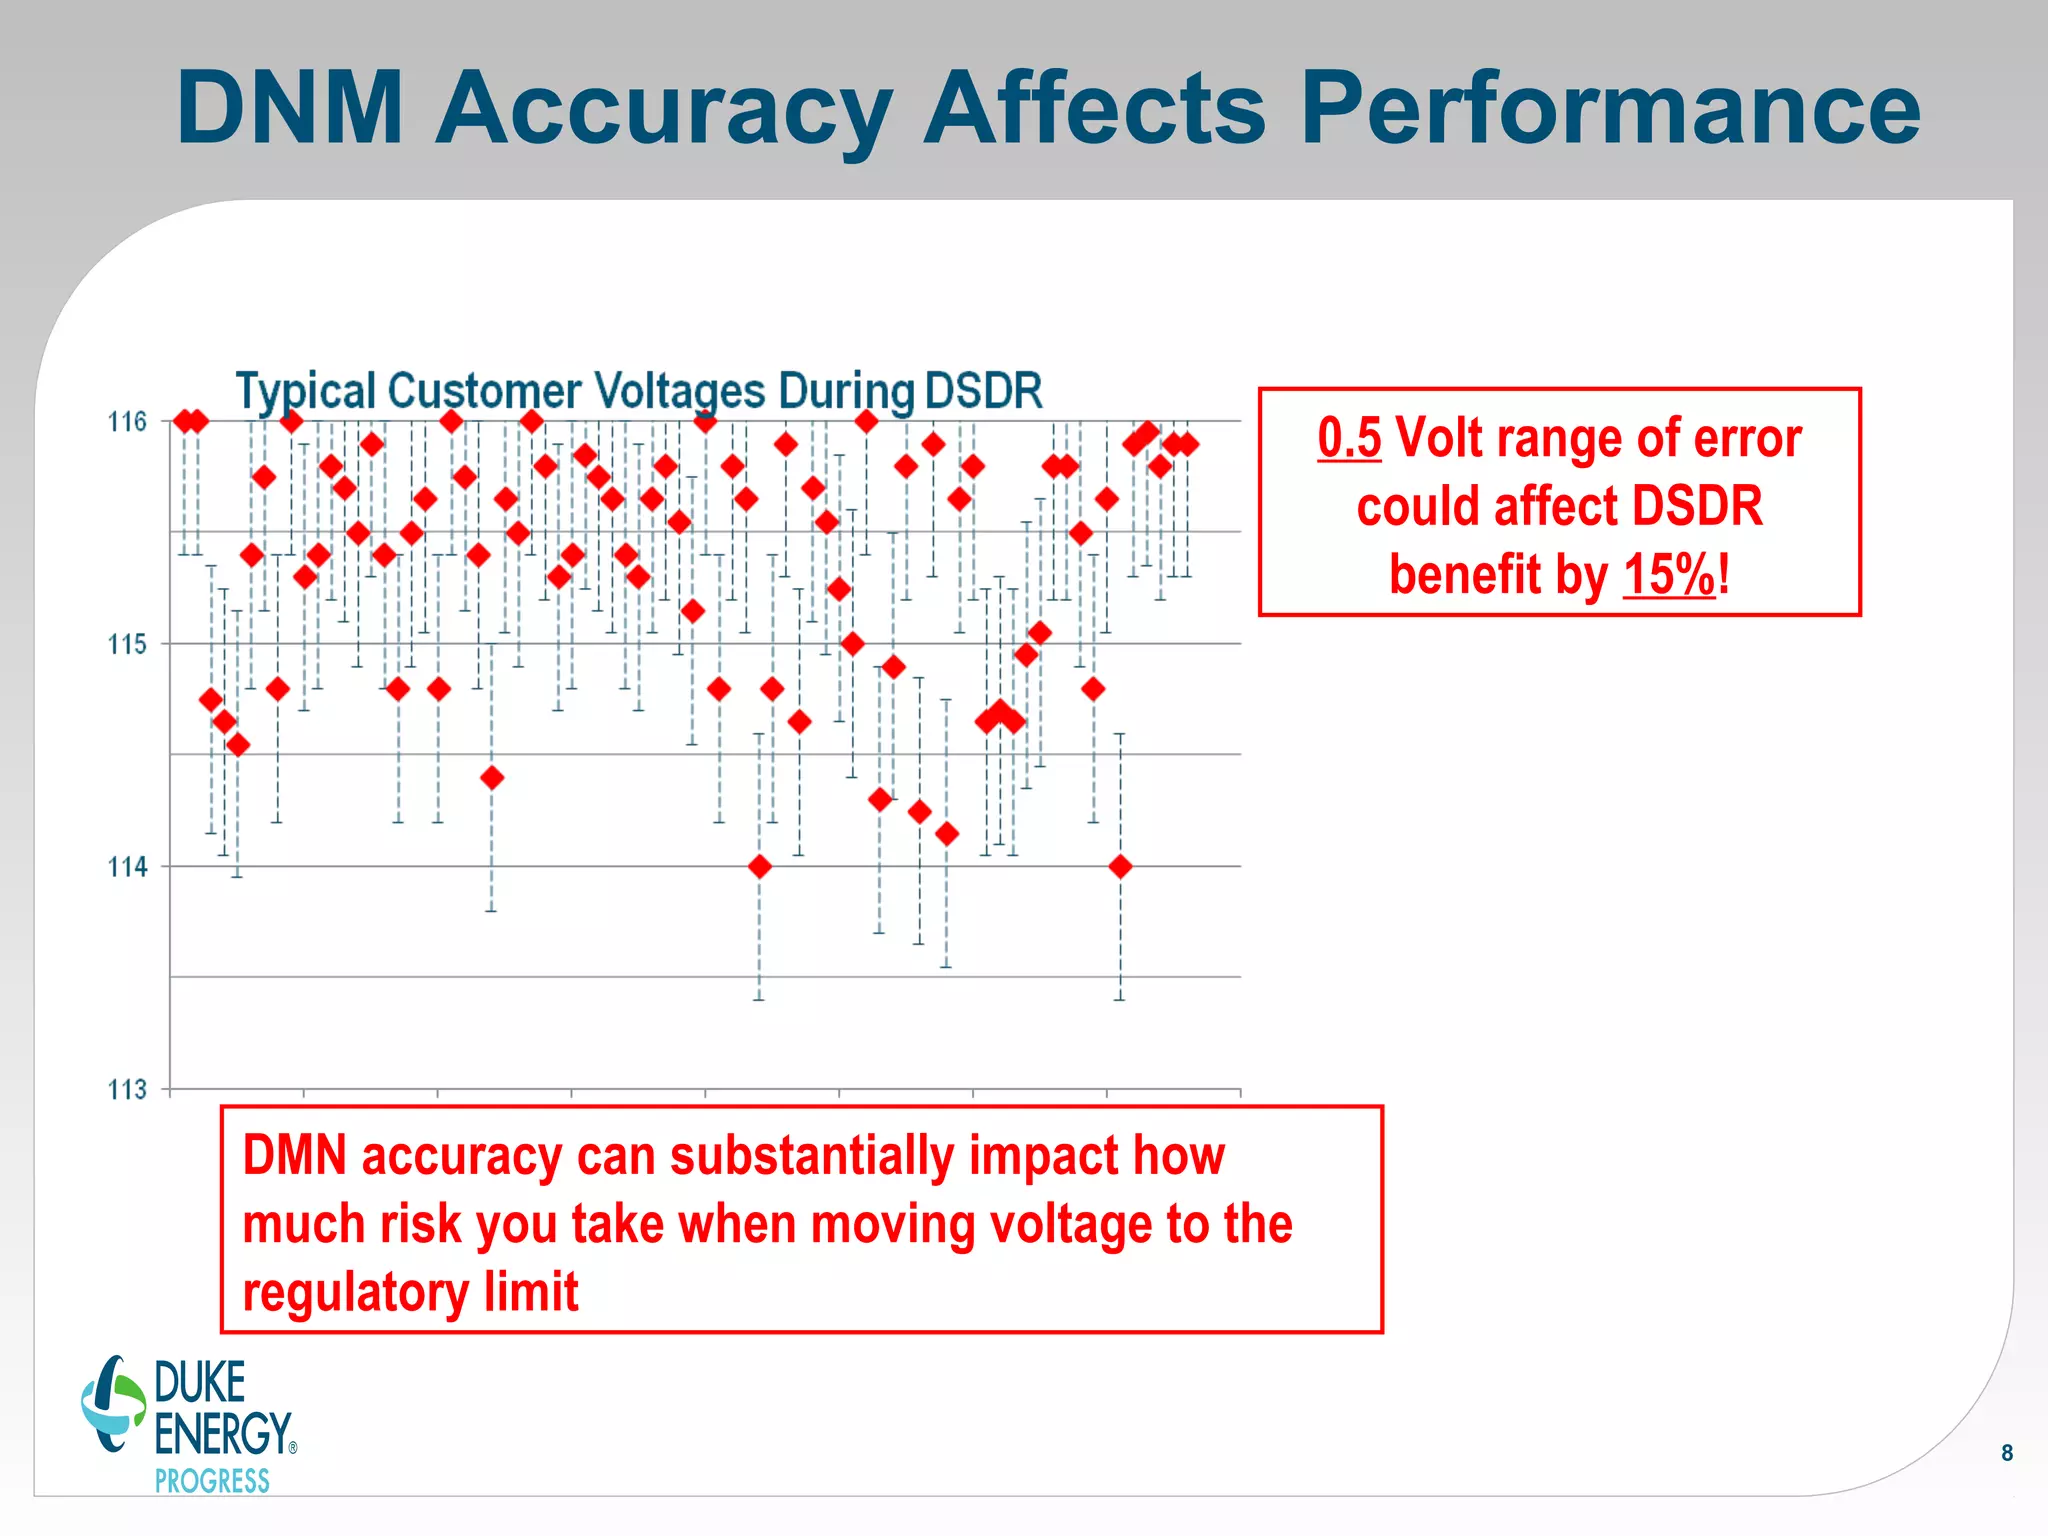
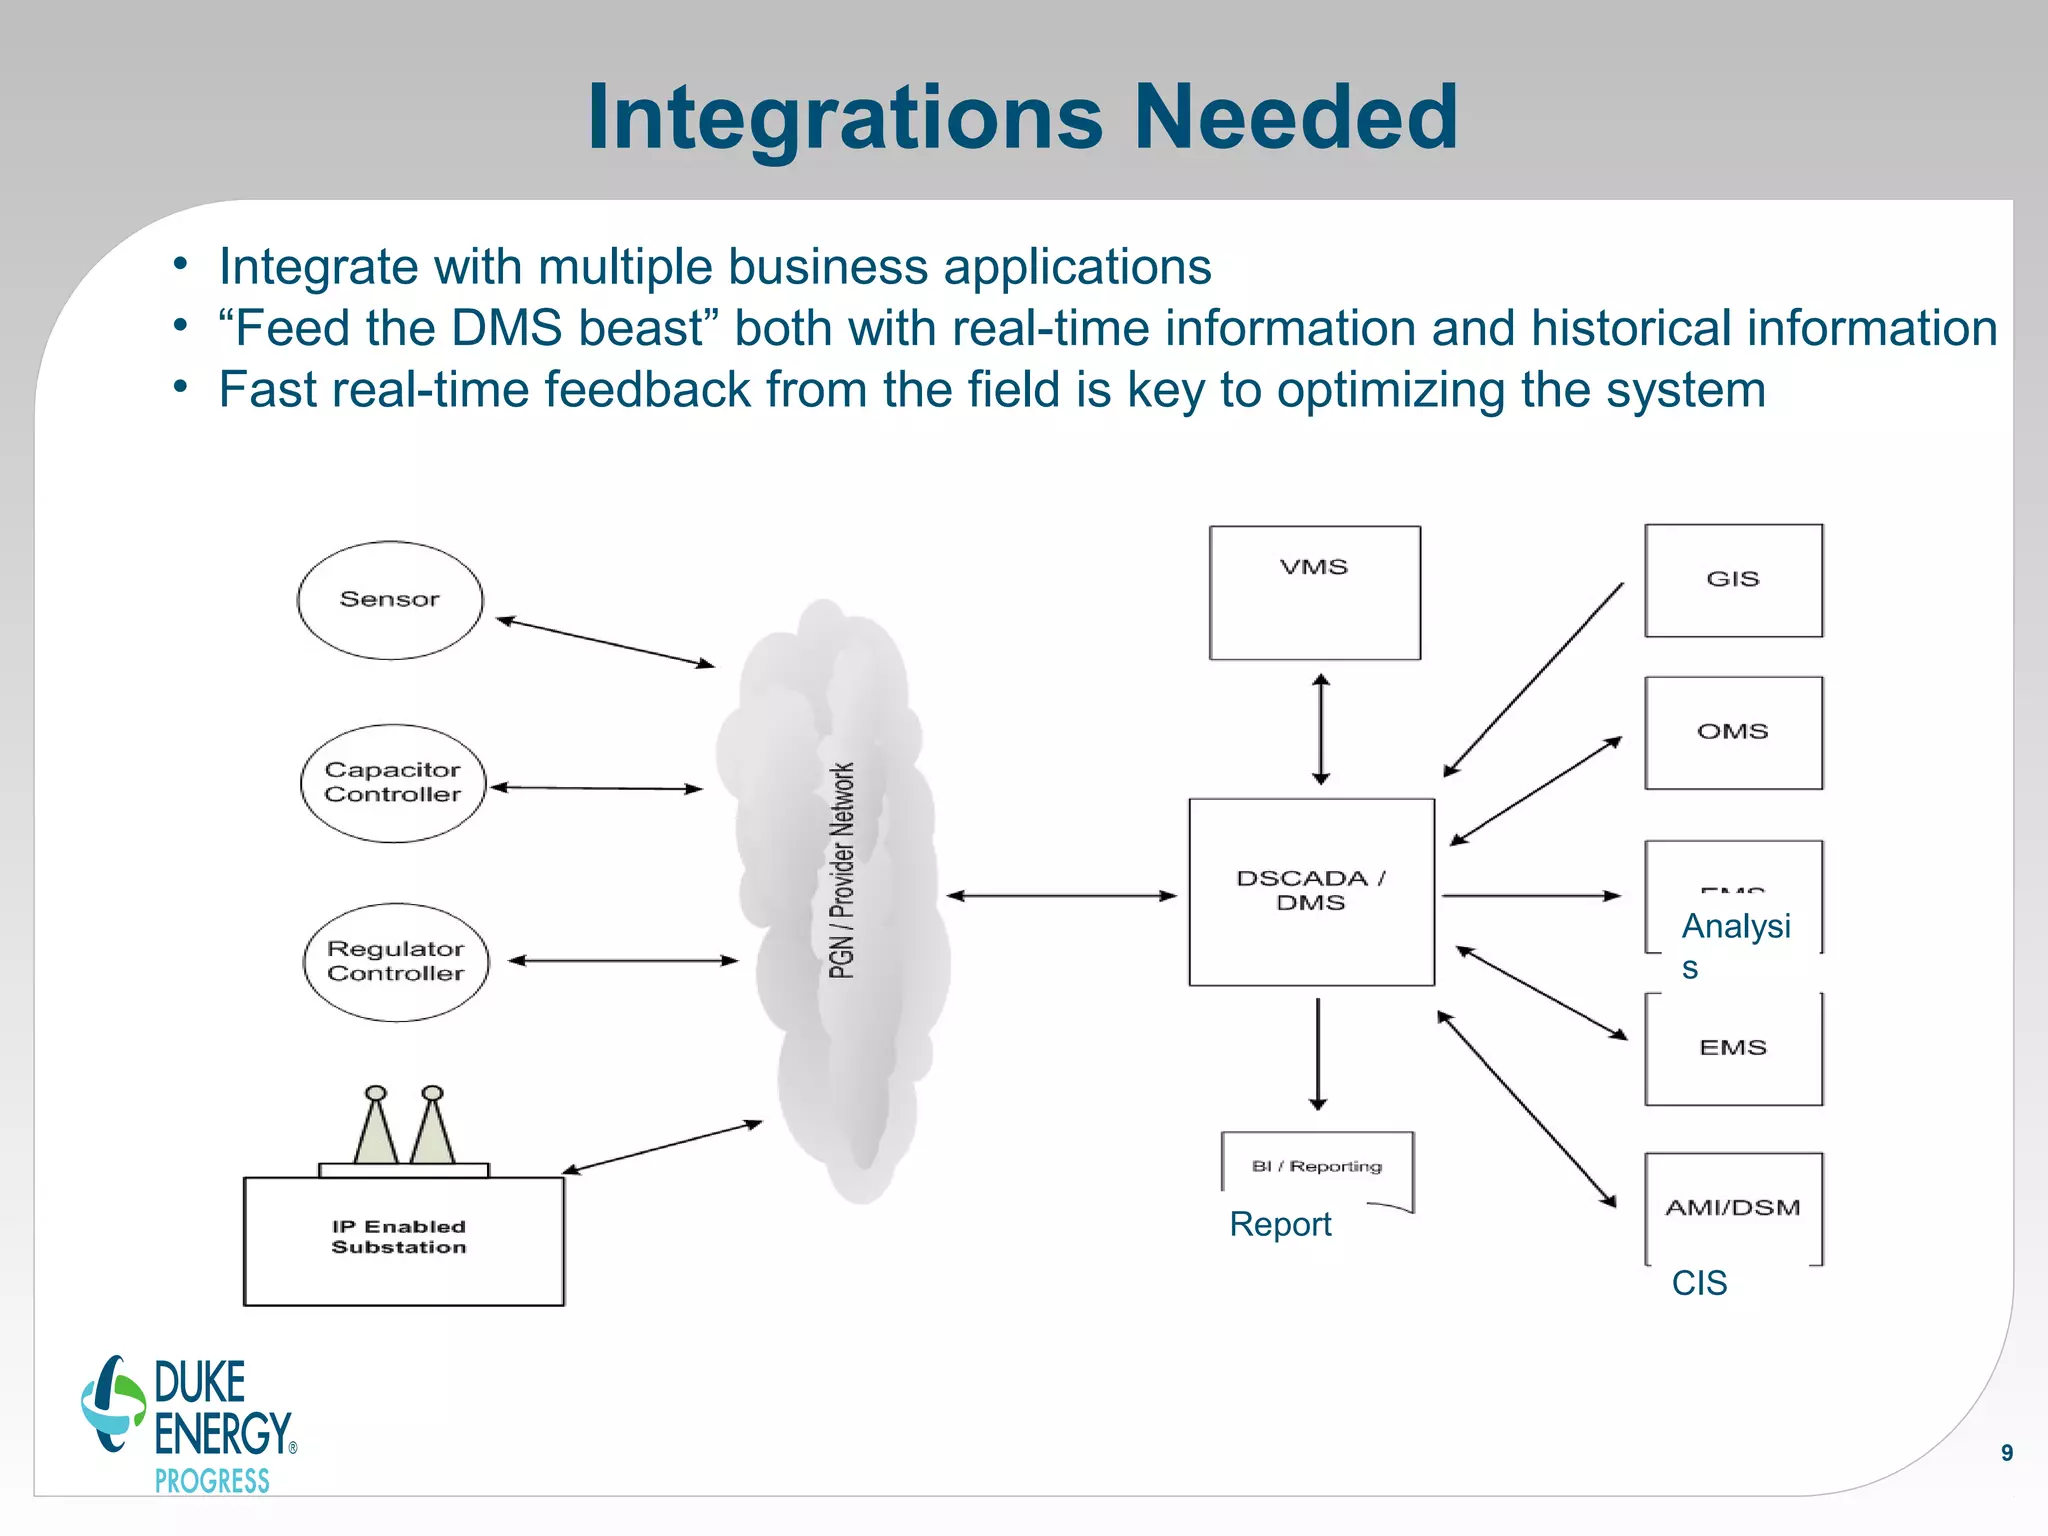
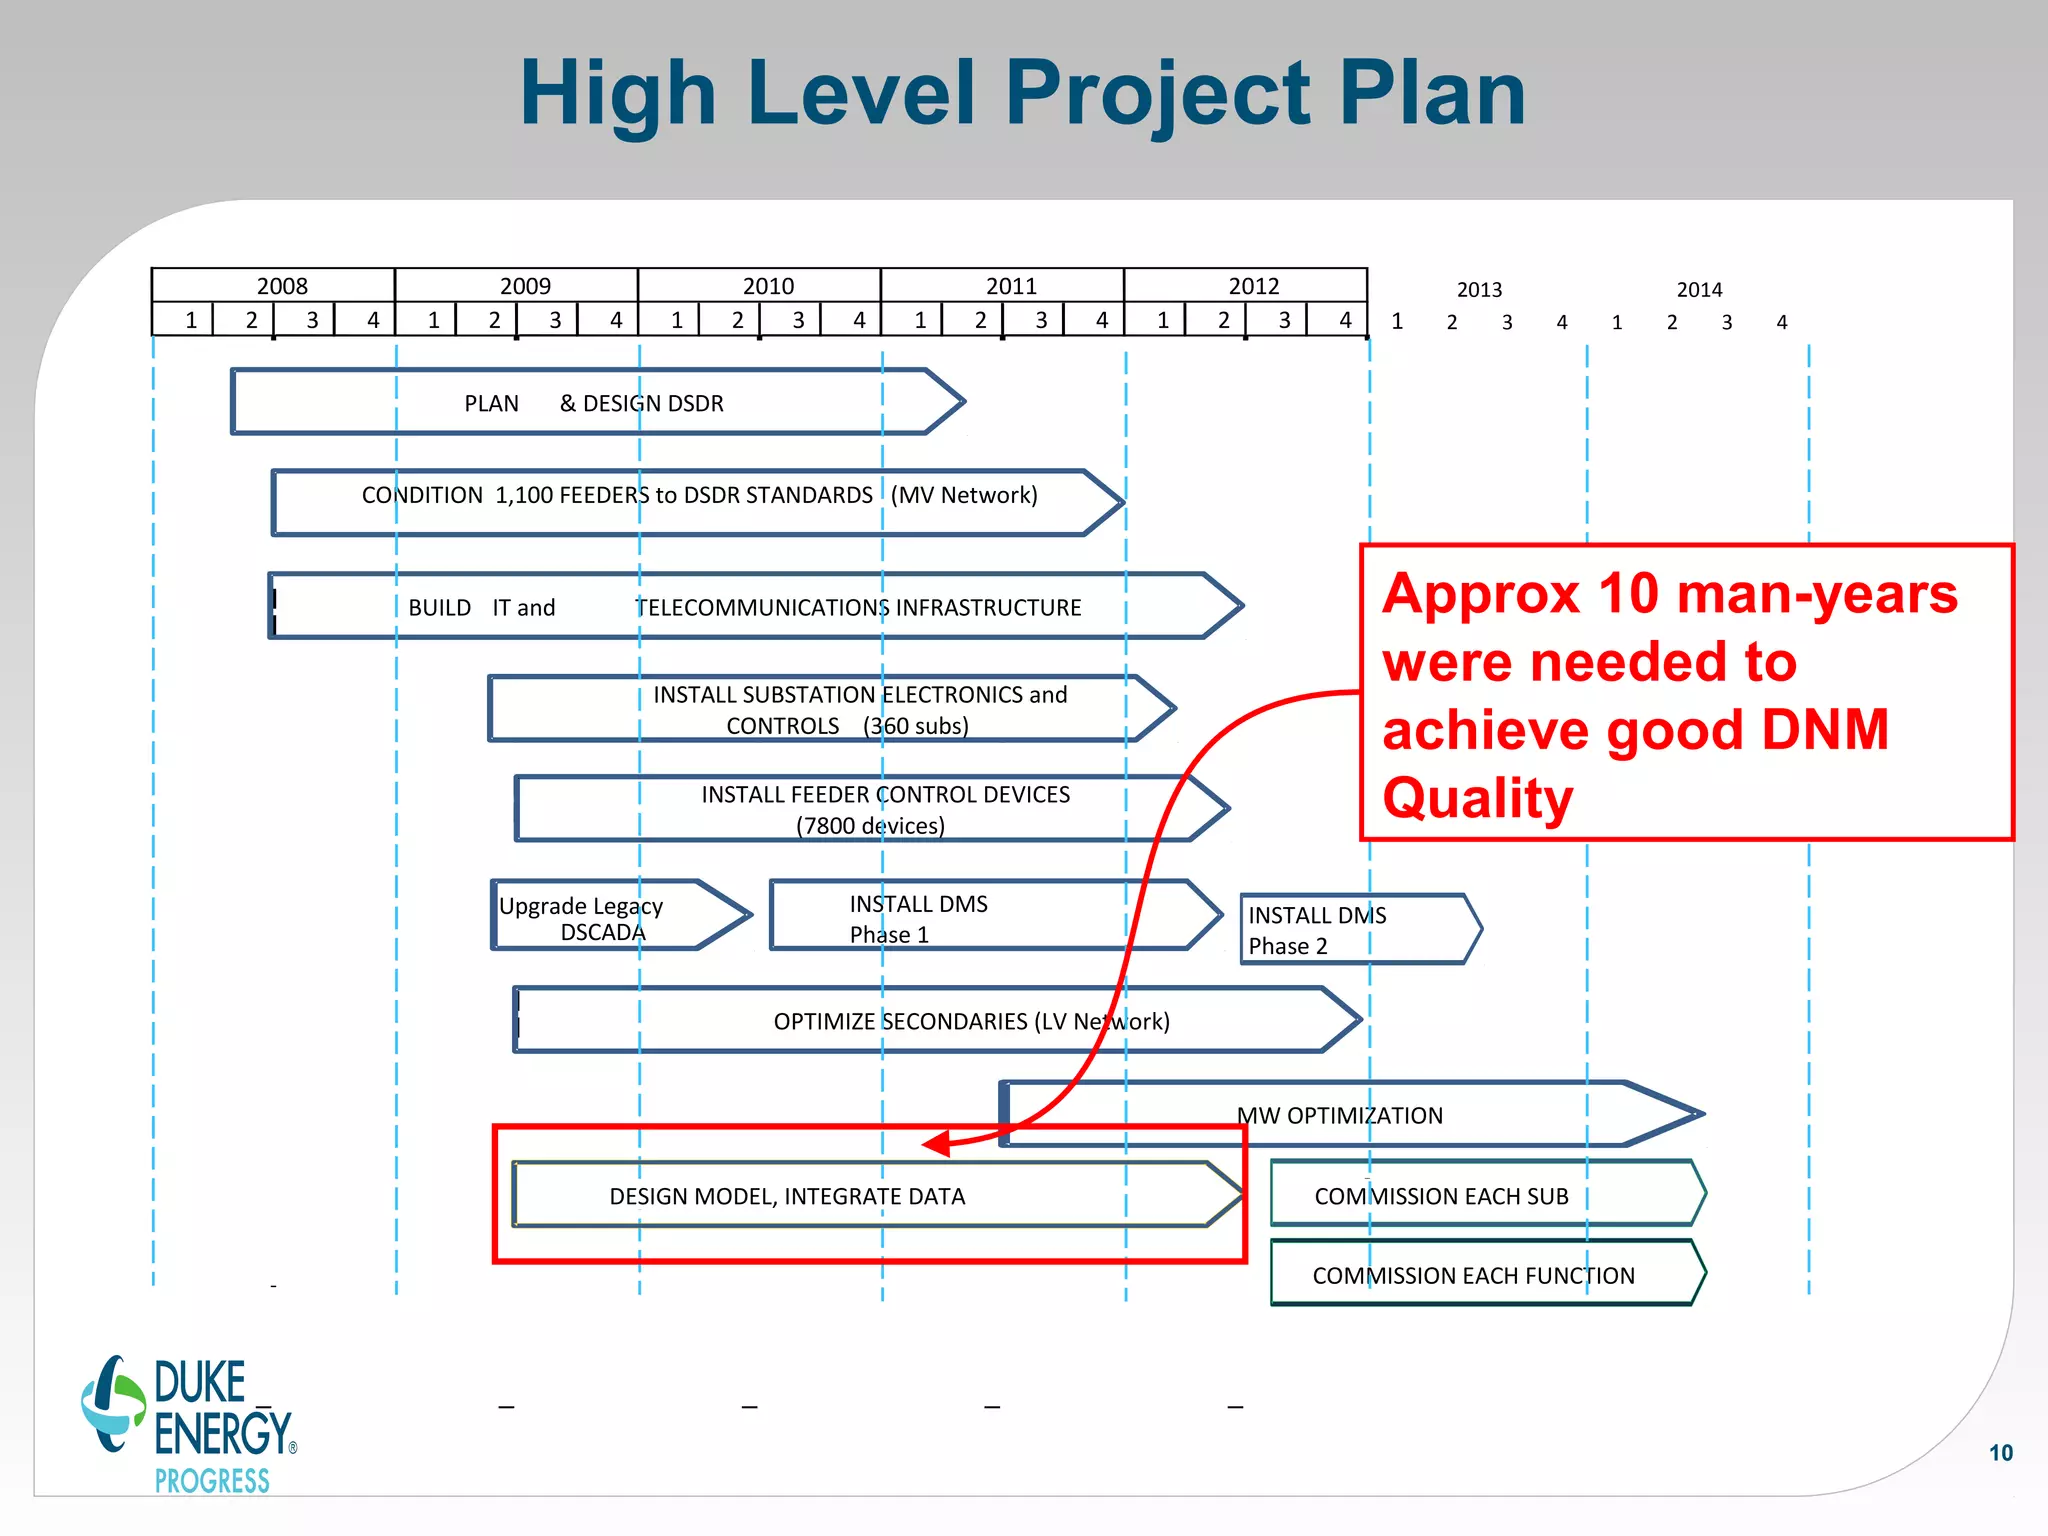
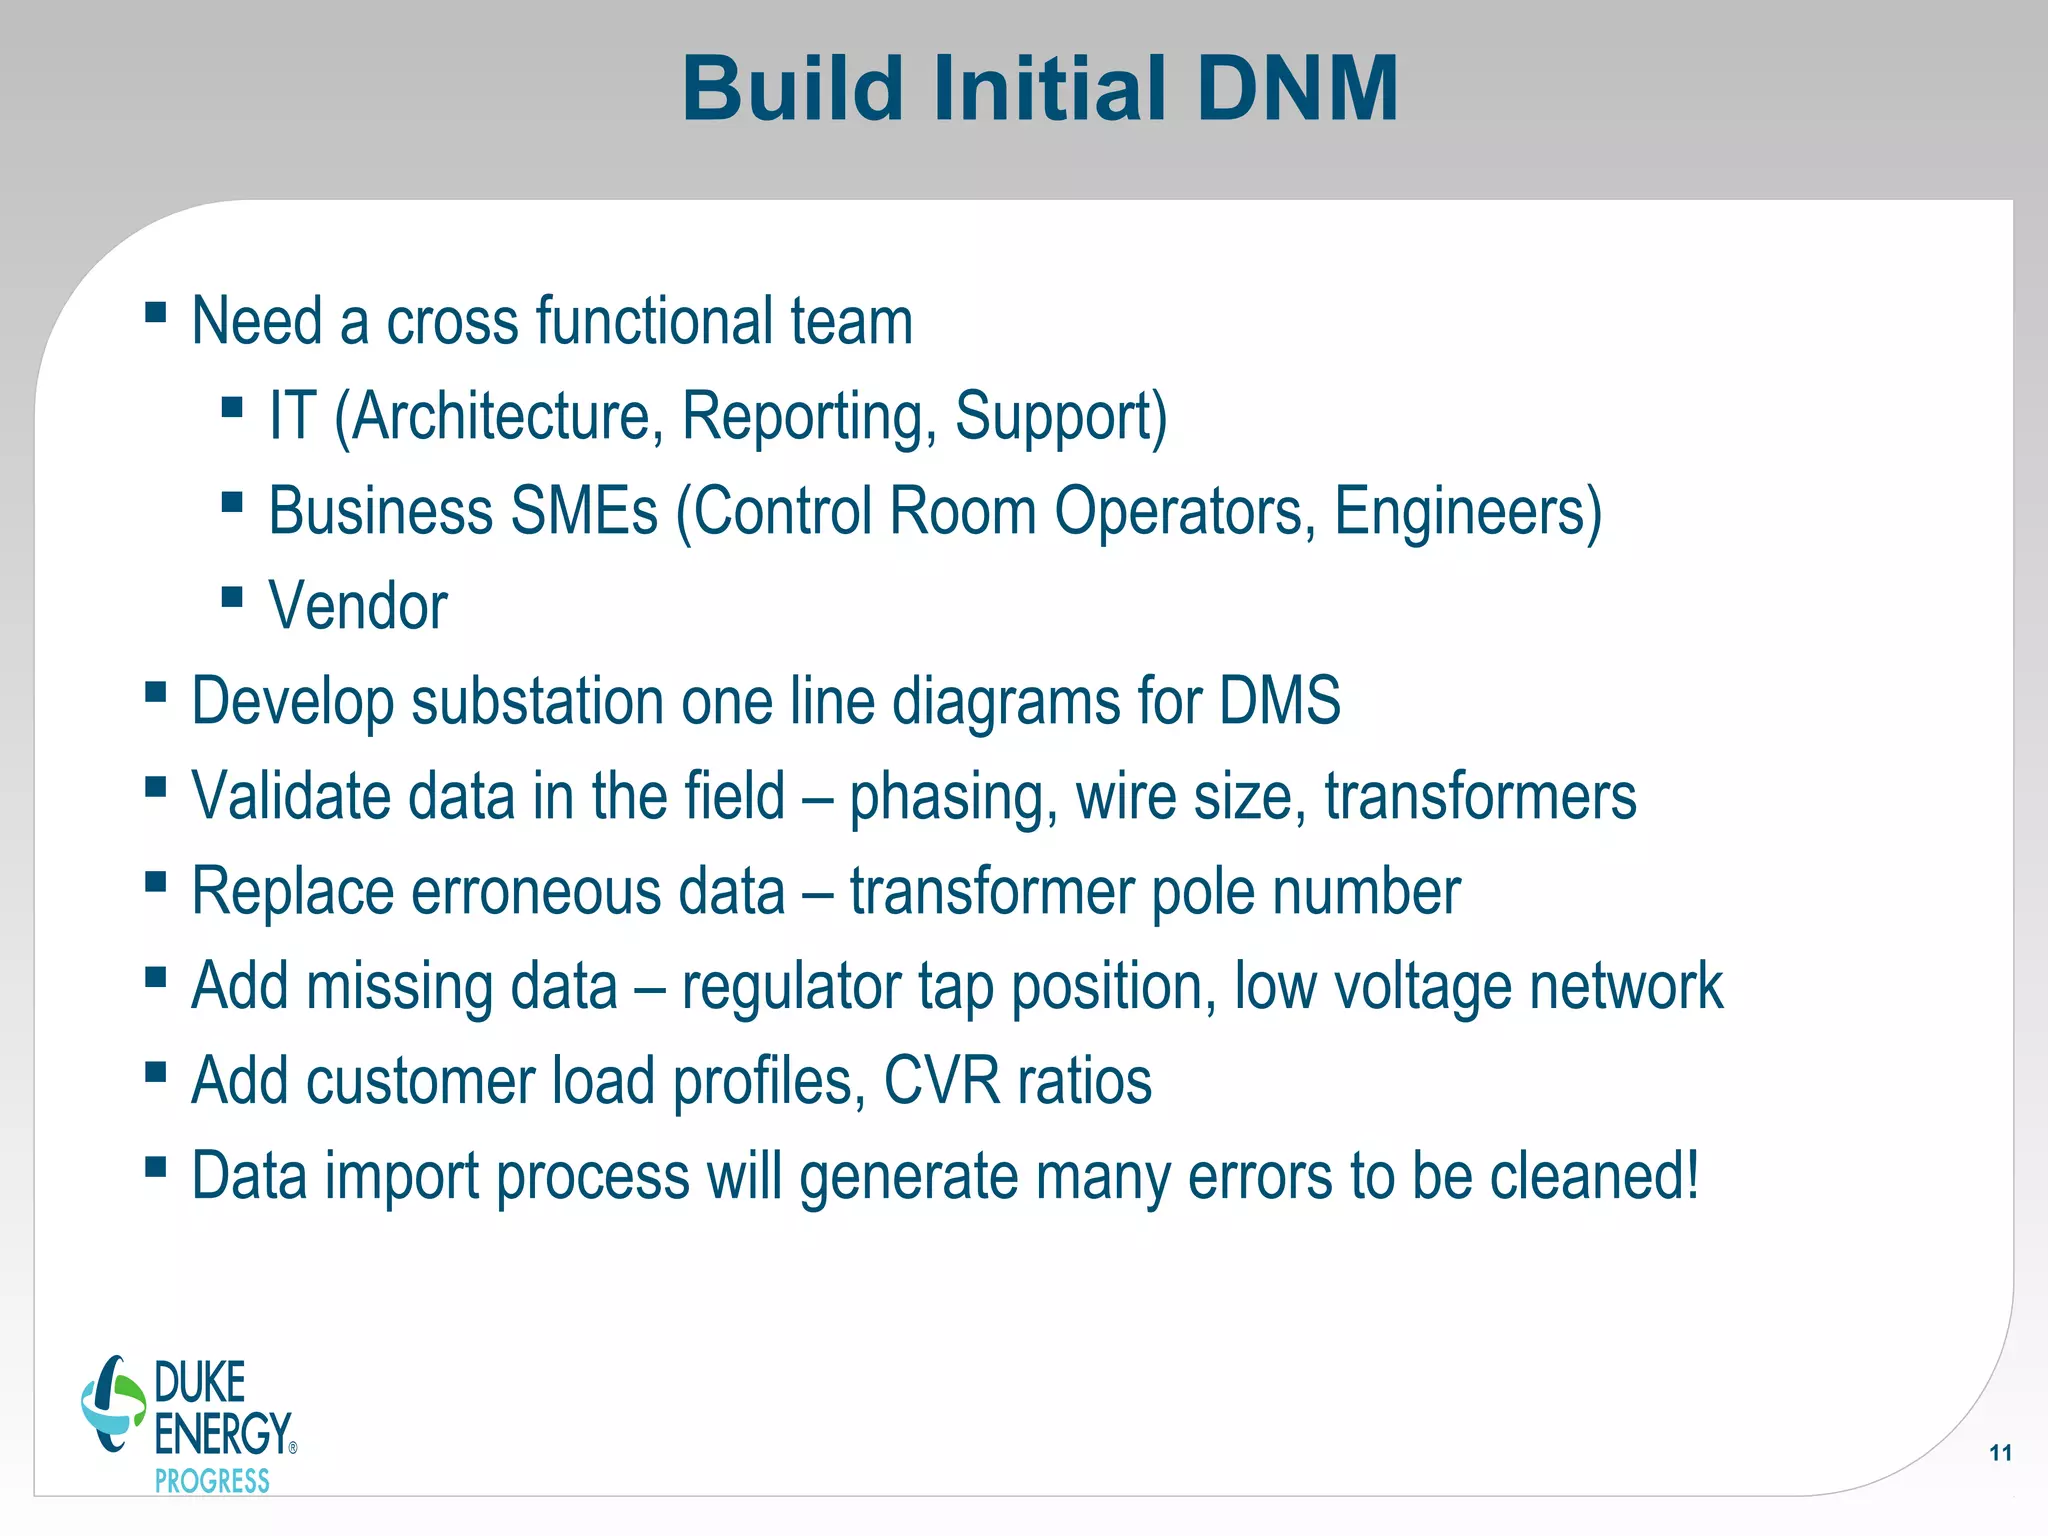
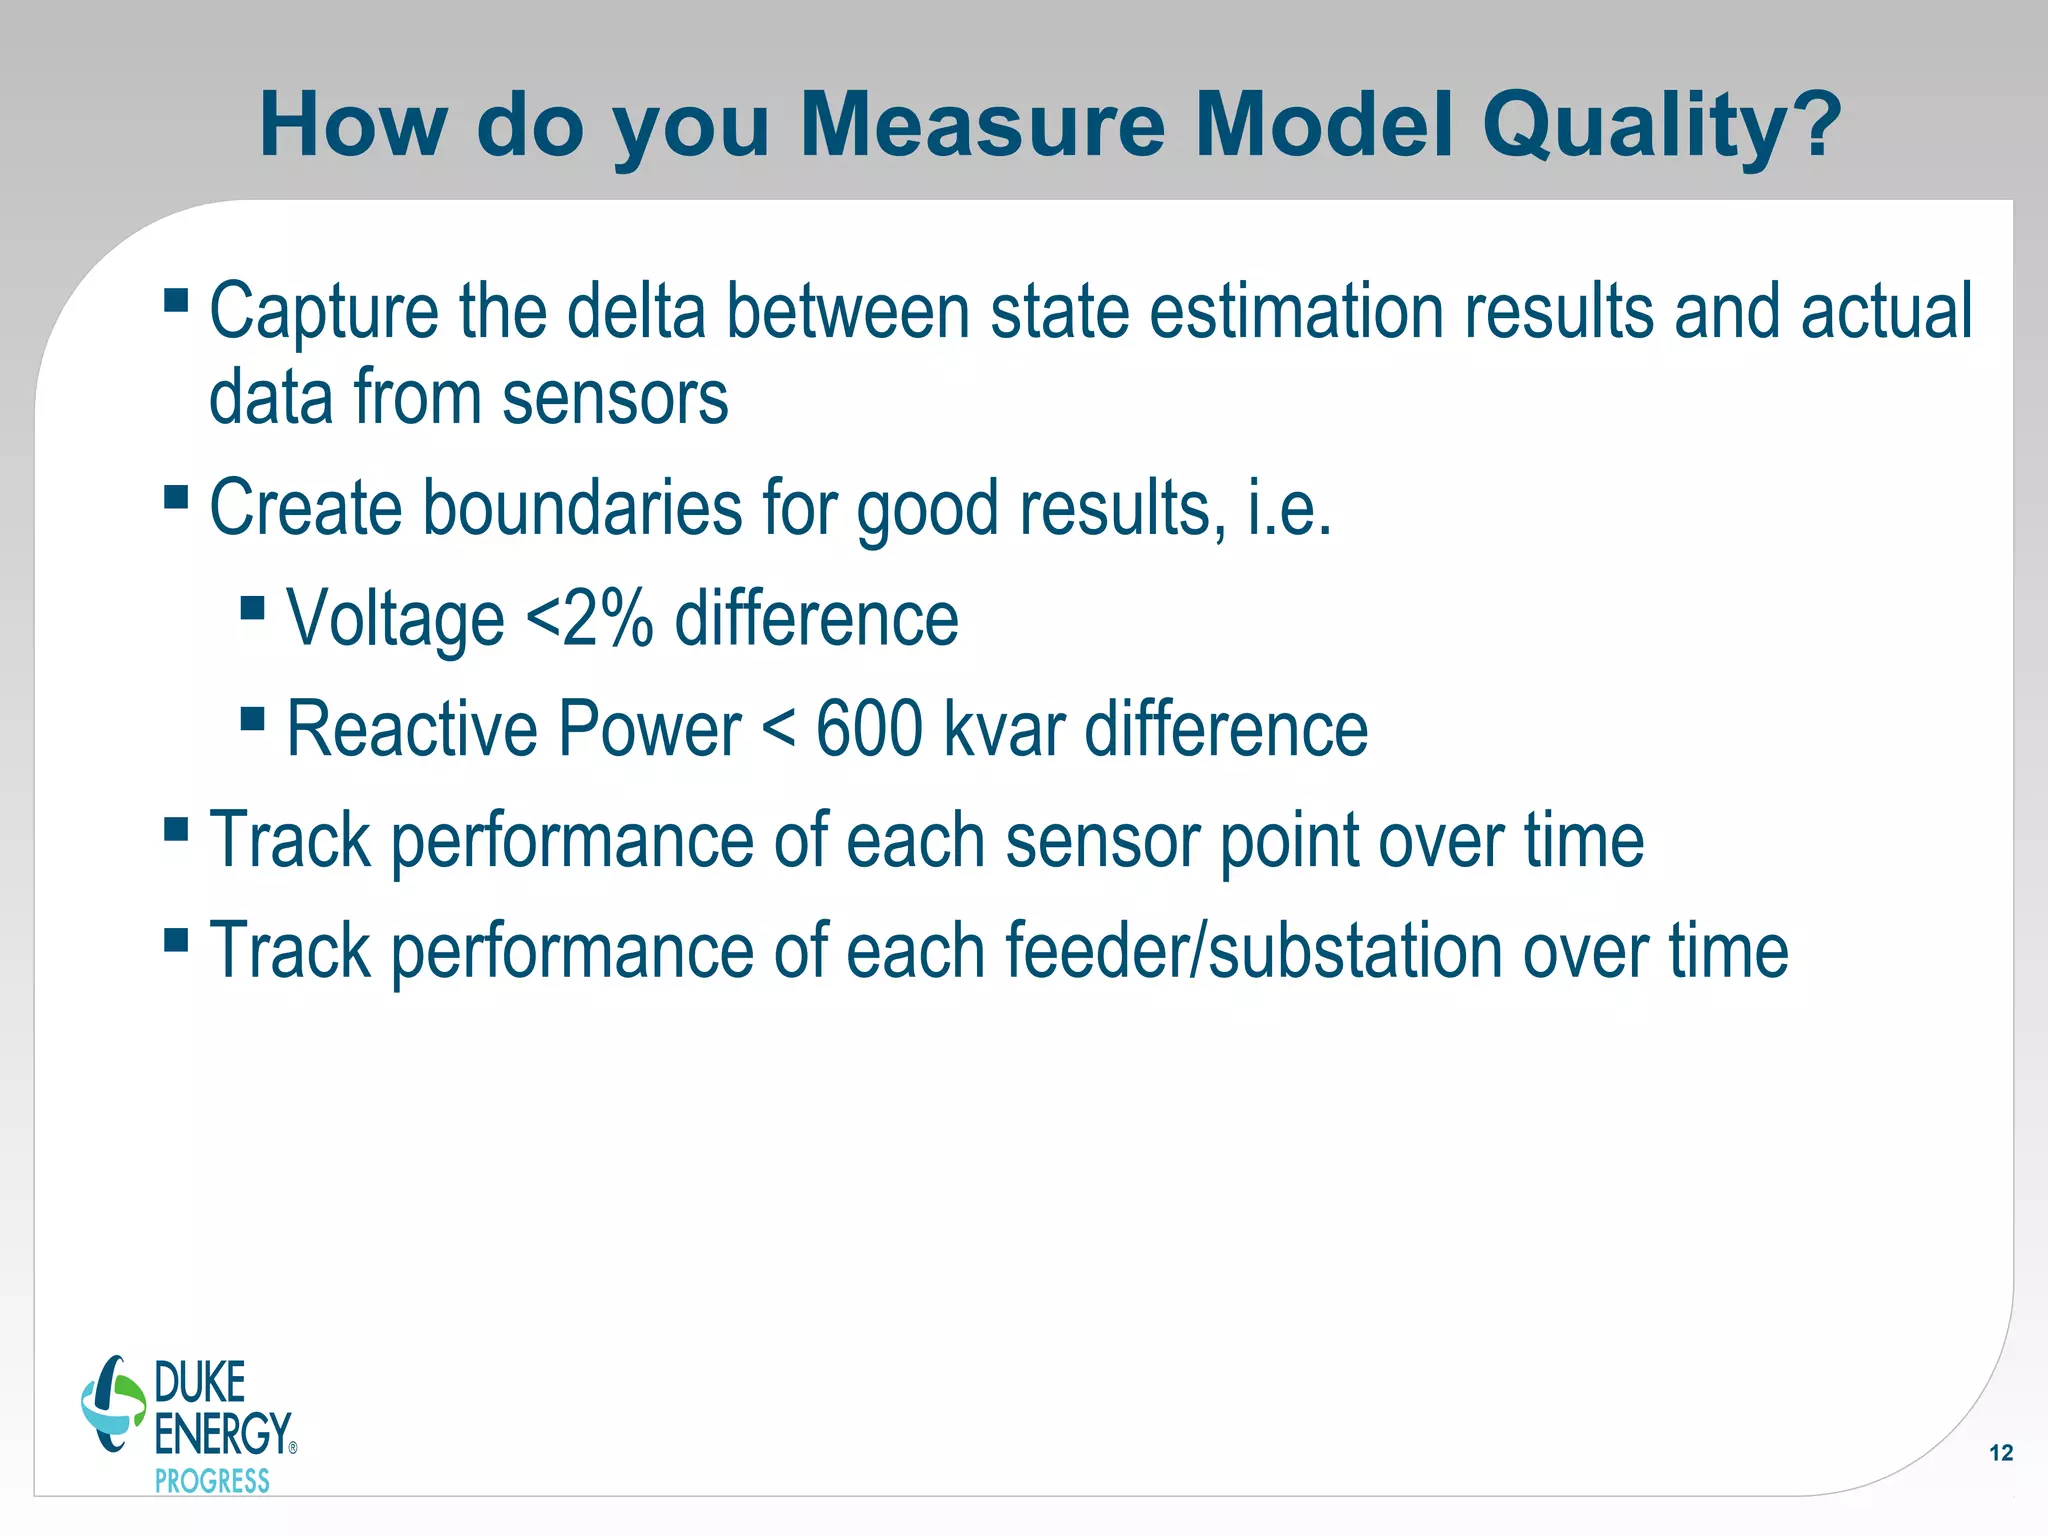
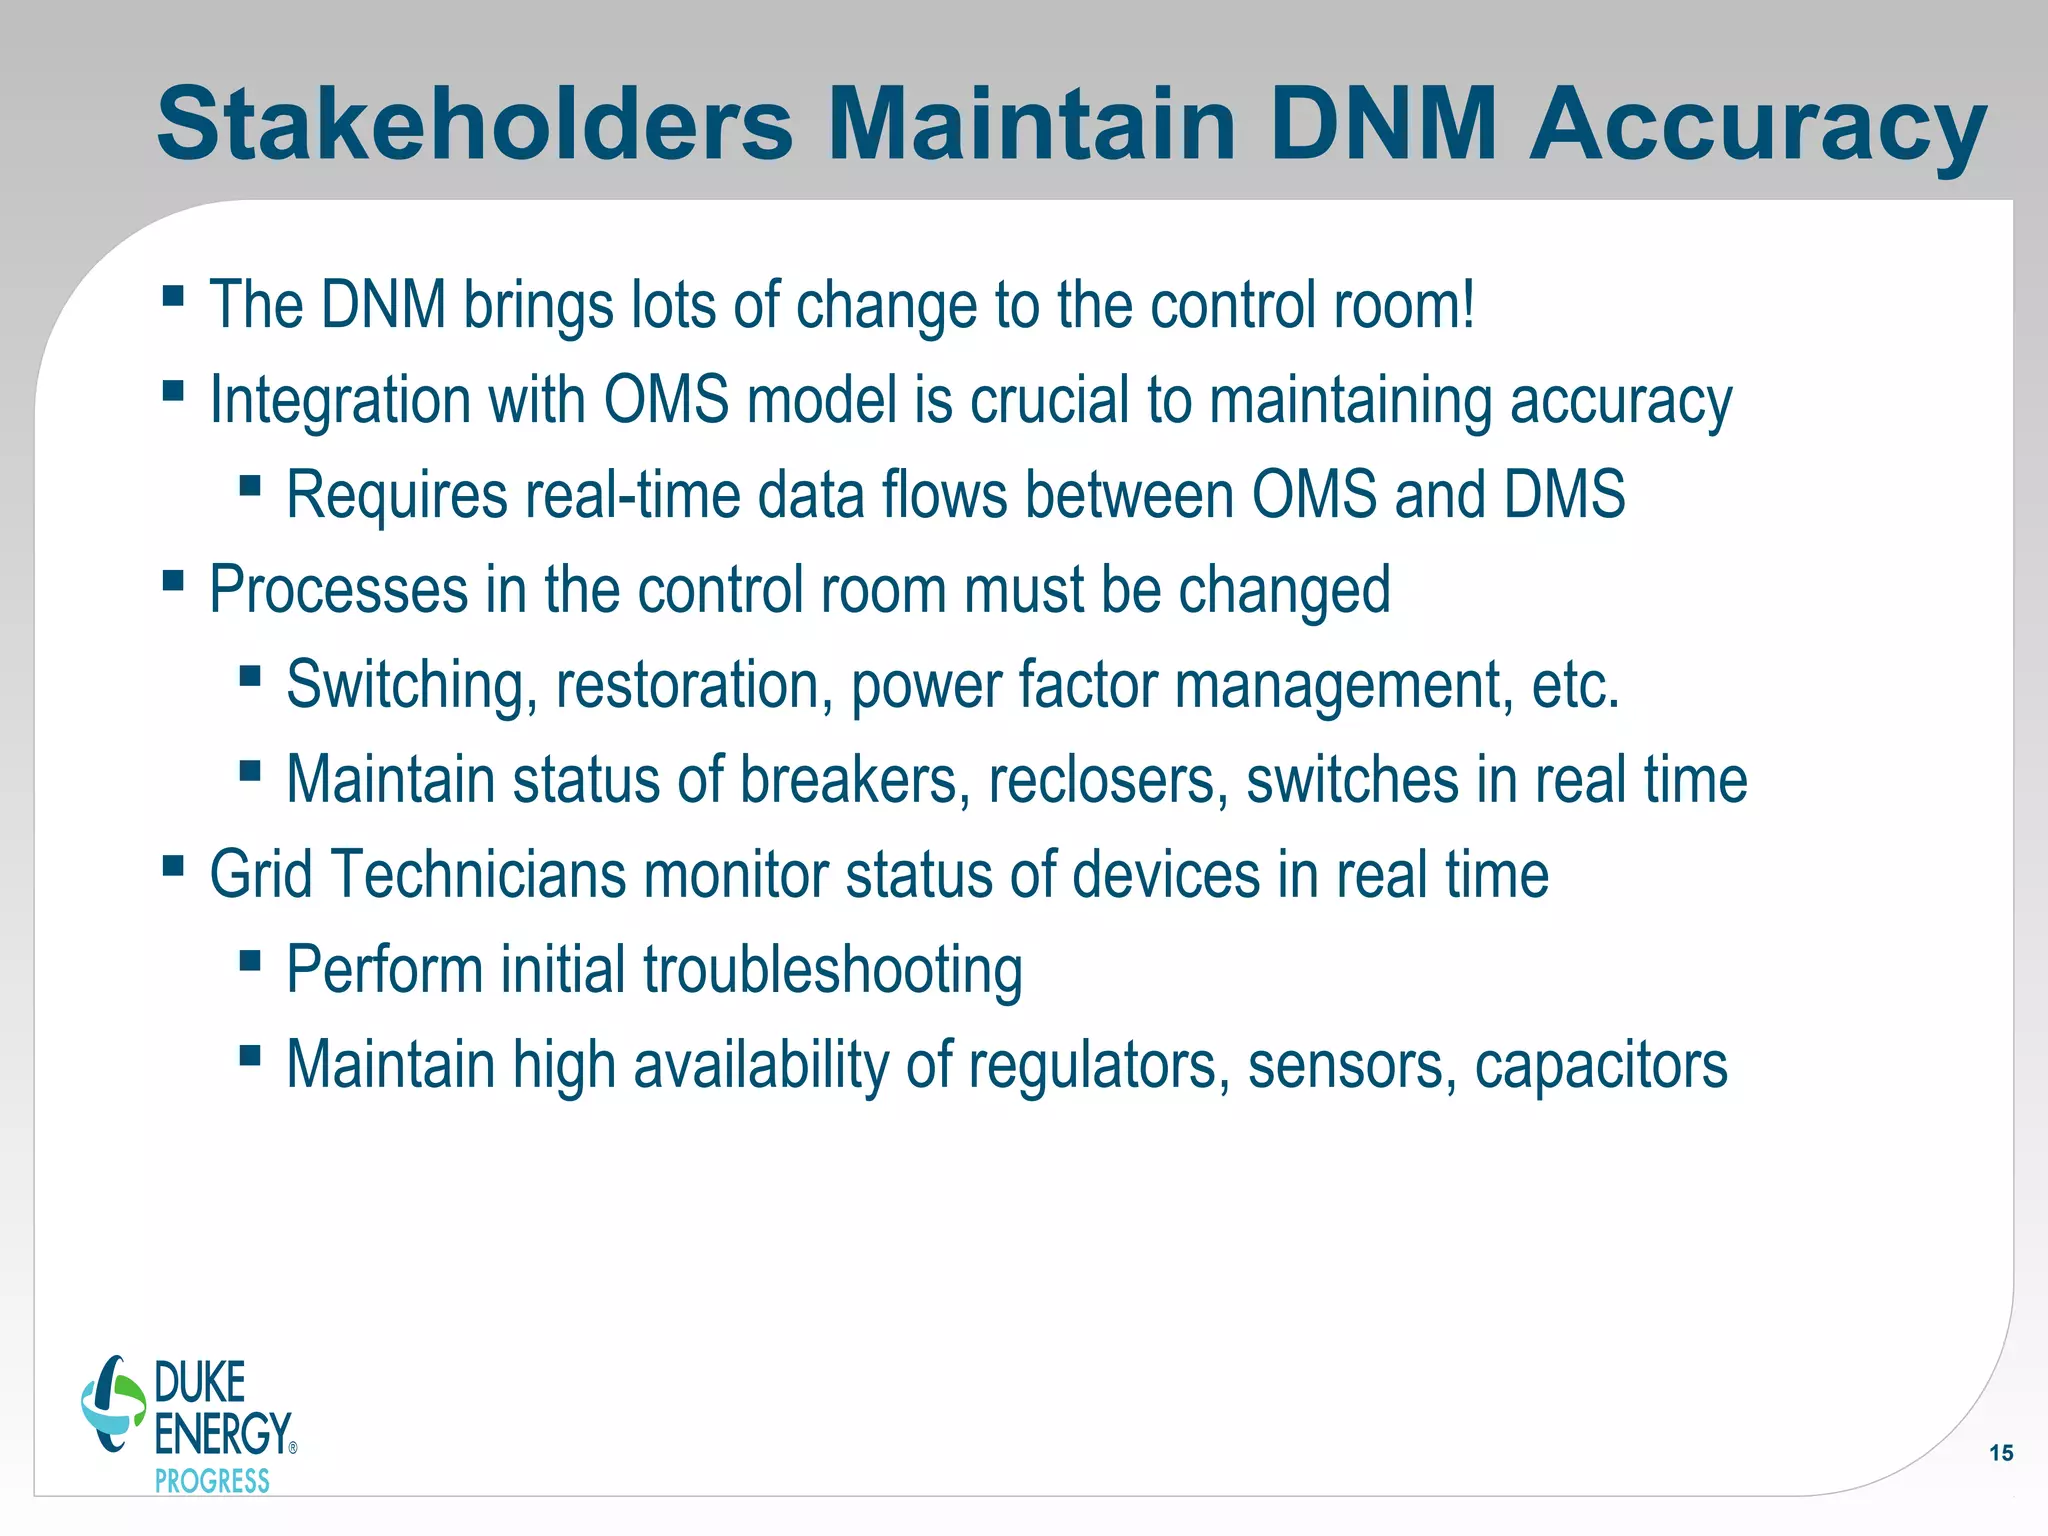
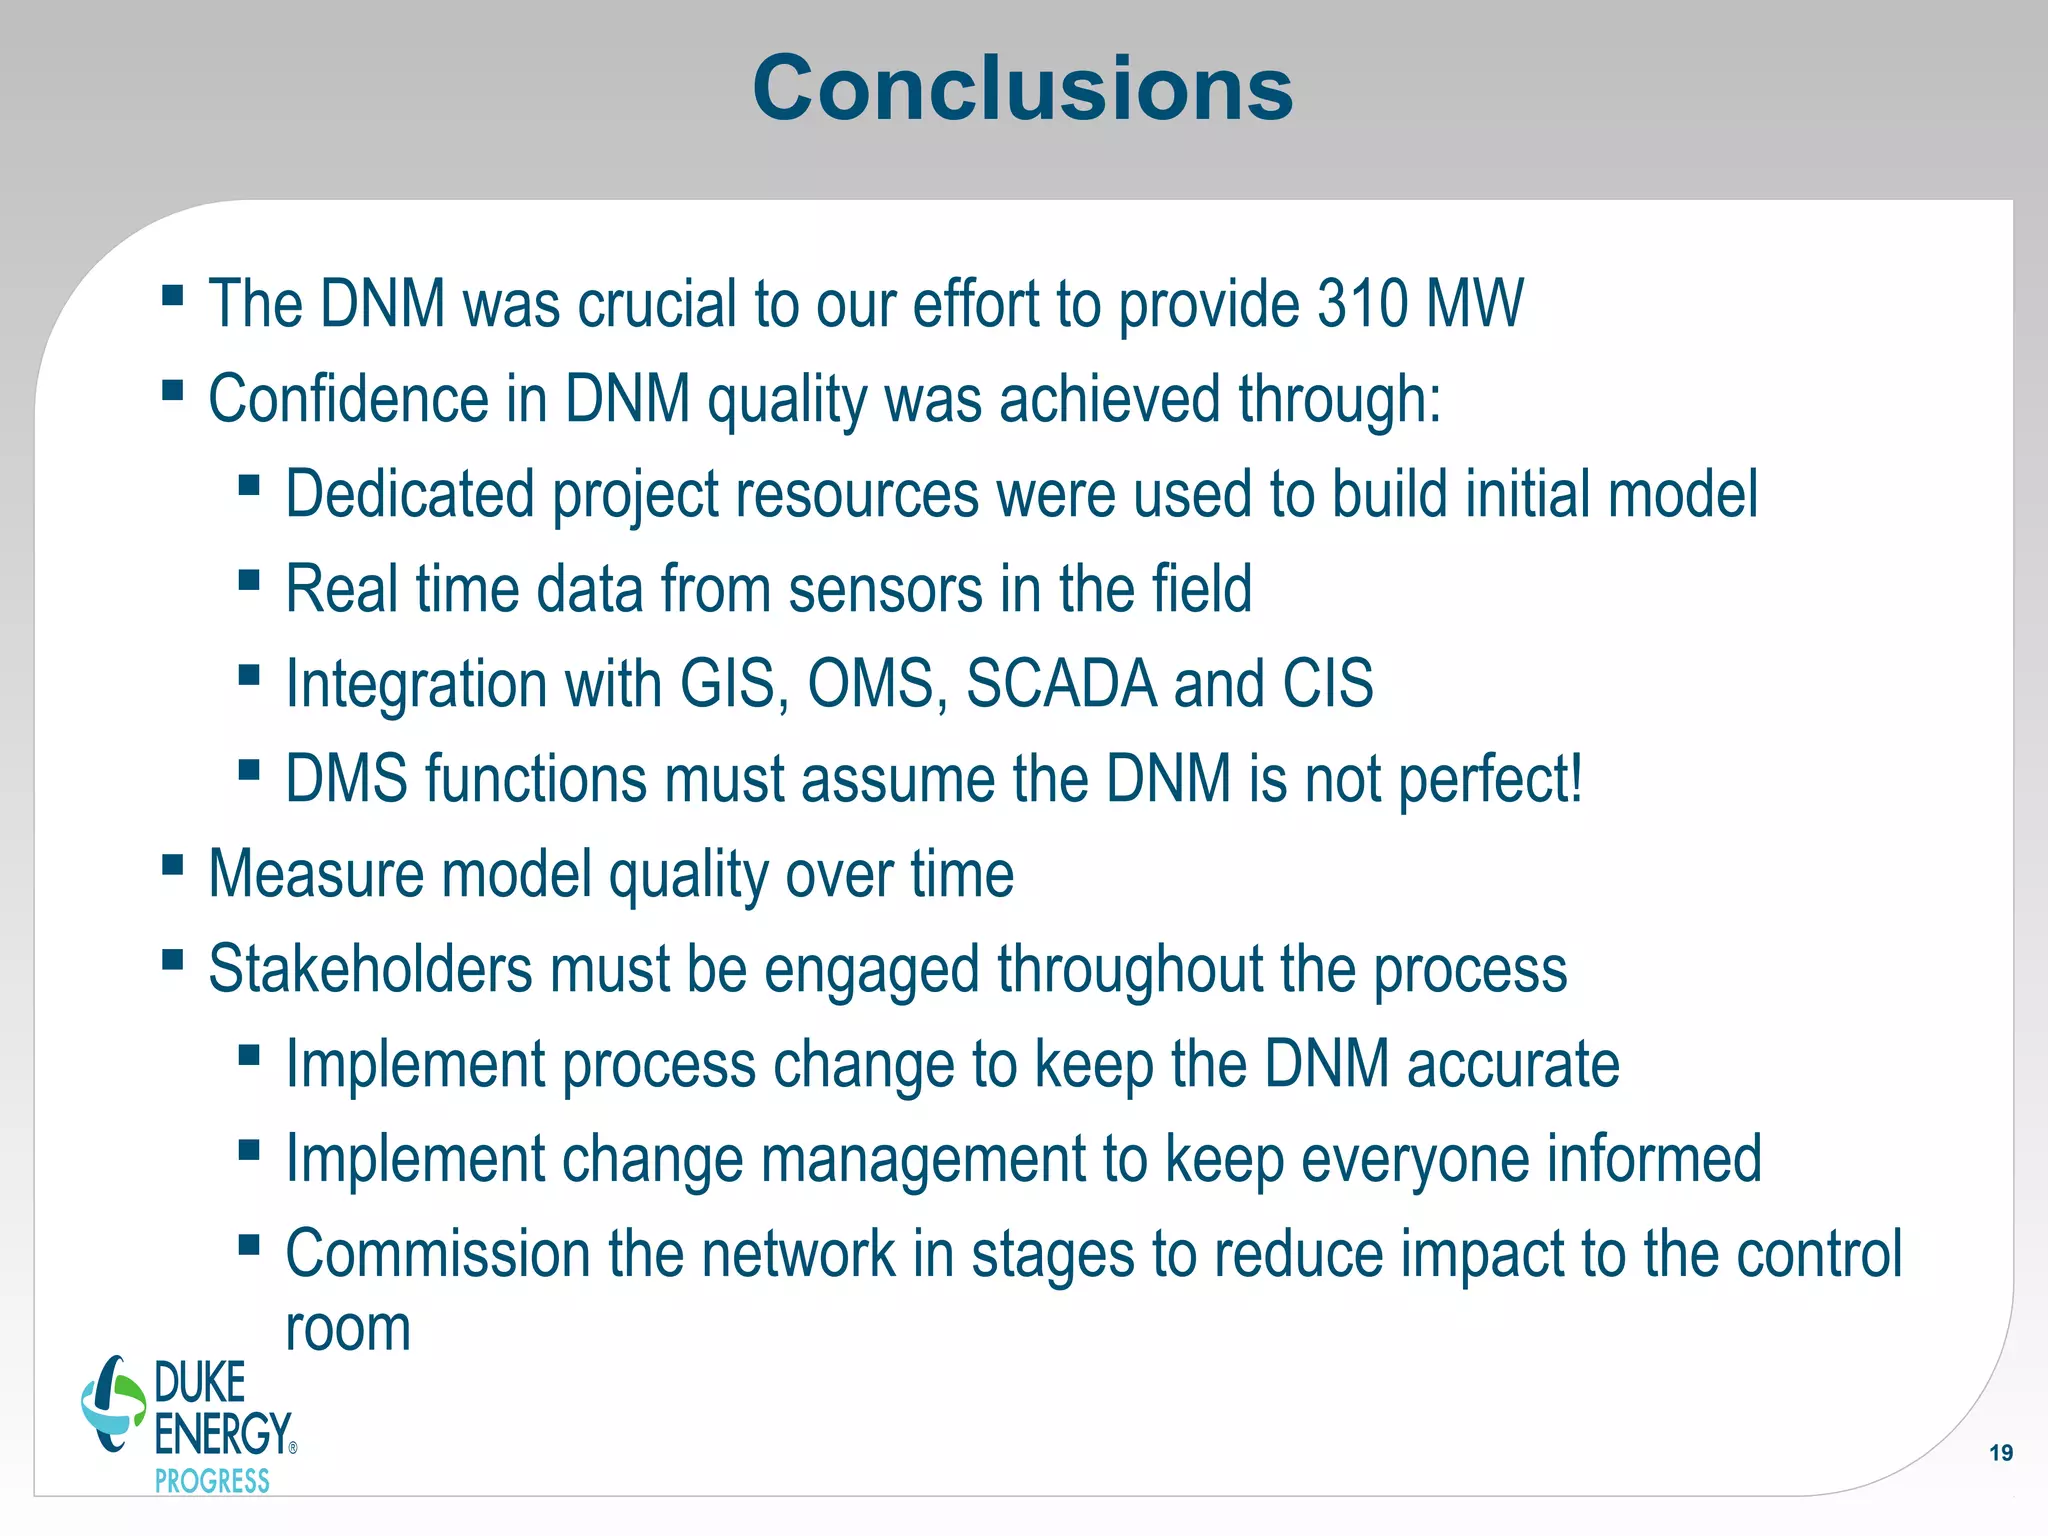
The Distribution Management System Network Model
The Cornerstone of a Successful DMS Implementation
Michael B. Johnson, PE
Project Director Grid Solution
Duke Energy
Tom Christopher
VP, Global Customer Relations, Smart Grid IT
Schneider Electric
1
February 5, 2015
Distribution Network Model (DNM)
Key Points
 Confidence in DNM is crucial to achieving optimized results
 Getting the DNM right can make or break a project
 DNM requires integration with GIS, OMS, SCADA and CIS
 Requires stakeholder engagement and change management
 Real time State Estimation (SE) has been commissioned at
Duke Energy as part of the DSDR Carolinas Project
2
Duke Energy
 Electric Customers: 7.1 Million
 Gas Customers: 500,000
 Market Cap: $49 Billion
 Employees: 29,250
 Service Territory: 104,000 sq mi
 Generation Capacity: 49,600 MW
 Transmission Lines: 32,000 mi
 Distribution Lines: 250,200 mi
Duke Energy International operates 4,300 MW’s
of generation
3
Duke Energy Progress & DSDR
(Distribution System Demand Response)
4
•Deployed on entire distribution
grid
•Controllable load: 8,400 MWs peak
•315 substations
•1,150 feeders
•1.5 million customers
•34,000 square miles of service area
Duke Energy Progress Statistics
The DSDR Business Case
5
Resource
Planning
Generation TransmissionSystem Operations
/ Dispatch
Fuel /
Purchased Power
Customer
Optimizing the Energy Value Chain
Distribution
Investment in
T&D eliminated
the need to build
235 MWs of new
peaking plants
DSDR Principles of Operation
6
Existing
Flattened Profile after feeder conditioning
Lower
Regulatory
Limit
Upper
Regulatory
Limit
• Flattened profile allows greater voltage reduction
• Dynamically lower voltage to regulatory limit
o
DMS network model used to maximize voltage reduction over time
o
Each regulating zone and each phase is optimized independently
Lower Voltage to Reduce MWs
Feeder
Voltage
Feeder Distance
A Typical DSDR Load Shape
Begin DSDR at 3:00 pm, Finish at 6:00 pm
7
DNM Accuracy Affects Performance
8
DMN accuracy can substantially impact how
much risk you take when moving voltage to the
regulatory limit
0.5 Volt range of error
could affect DSDR
benefit by 15%!
• Integrate with multiple business applications
• “Feed the DMS beast” both with real-time information and historical information
• Fast real-time feedback from the field is key to optimizing the system
Integrations Needed
9
CIS
Report
Analysi
s
1 2 3 4 1 2 3 4 1 2 3 4 1 2 3 4 1 2 3 4
20122008 2009 2010 2011
PLAN & DESIGN DSDR
CONDITION 1,100 FEEDERS to DSDR STANDARDS (MV Network)
INSTALL SUBSTATION ELECTRONICS and
CONTROLS (360 subs)
INSTALL FEEDER CONTROL DEVICES
(7800 devices)
OPTIMIZE SECONDARIES (LV Network)
COMMISSION EACH SUB
INSTALL DMS
Phase 1
Upgrade Legacy
DSCADA
MW OPTIMIZATION
BUILD IT and TELECOMMUNICATIONS INFRASTRUCTURE
High Level Project Plan
10
2013 2014
1 2 3 4 1 2 3 4
INSTALL DMS
Phase 2
COMMISSION EACH FUNCTION
DESIGN MODEL, INTEGRATE DATA
Approx 10 man-years
were needed to
achieve good DNM
Quality
Build Initial DNM
 Need a cross functional team
 IT (Architecture, Reporting, Support)
 Business SMEs (Control Room Operators, Engineers)
 Vendor
 Develop substation one line diagrams for DMS
 Validate data in the field – phasing, wire size, transformers
 Replace erroneous data – transformer pole number
 Add missing data – regulator tap position, low voltage network
 Add customer load profiles, CVR ratios
 Data import process will generate many errors to be cleaned!
11
How do you Measure Model Quality?
 Capture the delta between state estimation results and actual
data from sensors
 Create boundaries for good results, i.e.
 Voltage <2% difference
 Reactive Power < 600 kvar difference
 Track performance of each sensor point over time
 Track performance of each feeder/substation over time
12
Track DNM Quality over Time
13
Commission SE and Closed Loop Functions
14
Software Project to
Upgrade DSCADA and
Place DMS in
Production
Iterative Process
to Commission
SE and DSDR
Stakeholders Maintain DNM Accuracy
 The DNM brings lots of change to the control room!
 Integration with OMS model is crucial to maintaining accuracy
 Requires real-time data flows between OMS and DMS
 Processes in the control room must be changed
 Switching, restoration, power factor management, etc.
 Maintain status of breakers, reclosers, switches in real time
 Grid Technicians monitor status of devices in real time
 Perform initial troubleshooting
 Maintain high availability of regulators, sensors, capacitors
15
DNM Requires Focus from the Whole
Organization
 Process changes are needed from many stakeholders to ensure data
is managed well
 Work Order Design, Construction, GIS Techs, Engineering, IT
 Because many organizations are affected the timeline will be longer
than you’d like
 Start process development early and include change management
resources
 You should assume that bad/missing data will happen:
 Improve processes
 OR correct it during model import process
 OR your DMS will manage it in real time
16
Real Time Data is Used to Improve State Estimation
17
Switch
Router
Distribution Feeder
Cap Bank
Recloser
(Sensor data)
VR
Regulator
S
Sensor
DSDR Substation
Cap Bank
SEL
Feeder
Breaker
S
Voltage
Regulato
r
VRC
Gateway
Telecom
Cabinet
PQ Meter
• Each Sensor sends status and analog data to DMS in 10 to 60
second intervals
• Real Power, Reactive Power, Voltage and Current
• Tap Position, Switch Status
• 3,500 Regulators
• 2,800 Line Capacitors
• 1,500 MV sensors
• 800 Reclosers
• 3,000 LV sensors
Sensor
Real Time Data is Used to Improve State Estimation
18
• SCADA database has approx. 400,000 points
• 90,000 of those points are used by State Estimation
• 30,000 points – Voltage
• 15,000 points – Current
• 18,000 points – Real Power
• 18,000 points – Reactive Power
• 8,000 points – Power Factor
• That’s an average of 4 to 5 sensing locations per feeder
which typically serves > 1,000 customers
• When DSDR is not active, DSE and optimization
algorithms operate every 15 to 25 minutes
Conclusions
 The DNM was crucial to our effort to provide 310 MW
 Confidence in DNM quality was achieved through:
 Dedicated project resources were used to build initial model
 Real time data from sensors in the field
 Integration with GIS, OMS, SCADA and CIS
 DMS functions must assume the DNM is not perfect!
 Measure model quality over time
 Stakeholders must be engaged throughout the process
 Implement process change to keep the DNM accurate
 Implement change management to keep everyone informed
 Commission the network in stages to reduce impact to the control
room
19
20
Michael B. Johnson, PE
MichaelB.Johnson@duke-energy.com
Tom Christopher
tom.christopher@schneider-electric.com

Dtech 2015 the distribution management system network model

  • 1.
    The Distribution ManagementSystem Network Model The Cornerstone of a Successful DMS Implementation Michael B. Johnson, PE Project Director Grid Solution Duke Energy Tom Christopher VP, Global Customer Relations, Smart Grid IT Schneider Electric 1 February 5, 2015
  • 2.
    Distribution Network Model(DNM) Key Points  Confidence in DNM is crucial to achieving optimized results  Getting the DNM right can make or break a project  DNM requires integration with GIS, OMS, SCADA and CIS  Requires stakeholder engagement and change management  Real time State Estimation (SE) has been commissioned at Duke Energy as part of the DSDR Carolinas Project 2
  • 3.
    Duke Energy  ElectricCustomers: 7.1 Million  Gas Customers: 500,000  Market Cap: $49 Billion  Employees: 29,250  Service Territory: 104,000 sq mi  Generation Capacity: 49,600 MW  Transmission Lines: 32,000 mi  Distribution Lines: 250,200 mi Duke Energy International operates 4,300 MW’s of generation 3
  • 4.
    Duke Energy Progress& DSDR (Distribution System Demand Response) 4 •Deployed on entire distribution grid •Controllable load: 8,400 MWs peak •315 substations •1,150 feeders •1.5 million customers •34,000 square miles of service area Duke Energy Progress Statistics
  • 5.
    The DSDR BusinessCase 5 Resource Planning Generation TransmissionSystem Operations / Dispatch Fuel / Purchased Power Customer Optimizing the Energy Value Chain Distribution Investment in T&D eliminated the need to build 235 MWs of new peaking plants
  • 6.
    DSDR Principles ofOperation 6 Existing Flattened Profile after feeder conditioning Lower Regulatory Limit Upper Regulatory Limit • Flattened profile allows greater voltage reduction • Dynamically lower voltage to regulatory limit o DMS network model used to maximize voltage reduction over time o Each regulating zone and each phase is optimized independently Lower Voltage to Reduce MWs Feeder Voltage Feeder Distance
  • 7.
    A Typical DSDRLoad Shape Begin DSDR at 3:00 pm, Finish at 6:00 pm 7
  • 8.
    DNM Accuracy AffectsPerformance 8 DMN accuracy can substantially impact how much risk you take when moving voltage to the regulatory limit 0.5 Volt range of error could affect DSDR benefit by 15%!
  • 9.
    • Integrate withmultiple business applications • “Feed the DMS beast” both with real-time information and historical information • Fast real-time feedback from the field is key to optimizing the system Integrations Needed 9 CIS Report Analysi s
  • 10.
    1 2 34 1 2 3 4 1 2 3 4 1 2 3 4 1 2 3 4 20122008 2009 2010 2011 PLAN & DESIGN DSDR CONDITION 1,100 FEEDERS to DSDR STANDARDS (MV Network) INSTALL SUBSTATION ELECTRONICS and CONTROLS (360 subs) INSTALL FEEDER CONTROL DEVICES (7800 devices) OPTIMIZE SECONDARIES (LV Network) COMMISSION EACH SUB INSTALL DMS Phase 1 Upgrade Legacy DSCADA MW OPTIMIZATION BUILD IT and TELECOMMUNICATIONS INFRASTRUCTURE High Level Project Plan 10 2013 2014 1 2 3 4 1 2 3 4 INSTALL DMS Phase 2 COMMISSION EACH FUNCTION DESIGN MODEL, INTEGRATE DATA Approx 10 man-years were needed to achieve good DNM Quality
  • 11.
    Build Initial DNM Need a cross functional team  IT (Architecture, Reporting, Support)  Business SMEs (Control Room Operators, Engineers)  Vendor  Develop substation one line diagrams for DMS  Validate data in the field – phasing, wire size, transformers  Replace erroneous data – transformer pole number  Add missing data – regulator tap position, low voltage network  Add customer load profiles, CVR ratios  Data import process will generate many errors to be cleaned! 11
  • 12.
    How do youMeasure Model Quality?  Capture the delta between state estimation results and actual data from sensors  Create boundaries for good results, i.e.  Voltage <2% difference  Reactive Power < 600 kvar difference  Track performance of each sensor point over time  Track performance of each feeder/substation over time 12
  • 13.
    Track DNM Qualityover Time 13
  • 14.
    Commission SE andClosed Loop Functions 14 Software Project to Upgrade DSCADA and Place DMS in Production Iterative Process to Commission SE and DSDR
  • 15.
    Stakeholders Maintain DNMAccuracy  The DNM brings lots of change to the control room!  Integration with OMS model is crucial to maintaining accuracy  Requires real-time data flows between OMS and DMS  Processes in the control room must be changed  Switching, restoration, power factor management, etc.  Maintain status of breakers, reclosers, switches in real time  Grid Technicians monitor status of devices in real time  Perform initial troubleshooting  Maintain high availability of regulators, sensors, capacitors 15
  • 16.
    DNM Requires Focusfrom the Whole Organization  Process changes are needed from many stakeholders to ensure data is managed well  Work Order Design, Construction, GIS Techs, Engineering, IT  Because many organizations are affected the timeline will be longer than you’d like  Start process development early and include change management resources  You should assume that bad/missing data will happen:  Improve processes  OR correct it during model import process  OR your DMS will manage it in real time 16
  • 17.
    Real Time Datais Used to Improve State Estimation 17 Switch Router Distribution Feeder Cap Bank Recloser (Sensor data) VR Regulator S Sensor DSDR Substation Cap Bank SEL Feeder Breaker S Voltage Regulato r VRC Gateway Telecom Cabinet PQ Meter • Each Sensor sends status and analog data to DMS in 10 to 60 second intervals • Real Power, Reactive Power, Voltage and Current • Tap Position, Switch Status • 3,500 Regulators • 2,800 Line Capacitors • 1,500 MV sensors • 800 Reclosers • 3,000 LV sensors Sensor
  • 18.
    Real Time Datais Used to Improve State Estimation 18 • SCADA database has approx. 400,000 points • 90,000 of those points are used by State Estimation • 30,000 points – Voltage • 15,000 points – Current • 18,000 points – Real Power • 18,000 points – Reactive Power • 8,000 points – Power Factor • That’s an average of 4 to 5 sensing locations per feeder which typically serves > 1,000 customers • When DSDR is not active, DSE and optimization algorithms operate every 15 to 25 minutes
  • 19.
    Conclusions  The DNMwas crucial to our effort to provide 310 MW  Confidence in DNM quality was achieved through:  Dedicated project resources were used to build initial model  Real time data from sensors in the field  Integration with GIS, OMS, SCADA and CIS  DMS functions must assume the DNM is not perfect!  Measure model quality over time  Stakeholders must be engaged throughout the process  Implement process change to keep the DNM accurate  Implement change management to keep everyone informed  Commission the network in stages to reduce impact to the control room 19
  • 20.
    20 Michael B. Johnson,PE MichaelB.Johnson@duke-energy.com Tom Christopher tom.christopher@schneider-electric.com