Download to read offline
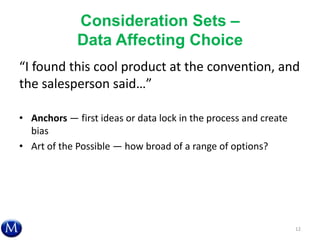
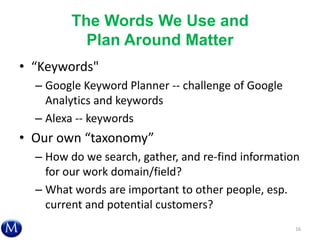

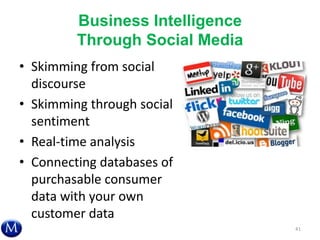
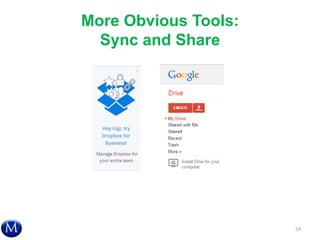
![Challenges with Aggregated Data
• Who are you? Multiple devices or browsers
• Who are you? 5 users on Netflix, etc.
42
Source: By Jeremy Keith (Flickr: Cuddling with multiple devices)
[CC-BY-2.0 (http://creativecommons.org/licenses/by/2.0)], via Wikimedia Commons](https://image.slidesharecdn.com/drinking-20from-20the-20digital-20data-20firehose-20041714-140414201928-phpapp01/85/Drinking-from-the-Digital-Data-Fire-Hose-42-320.jpg)

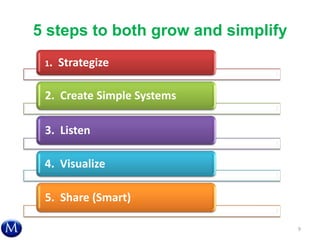
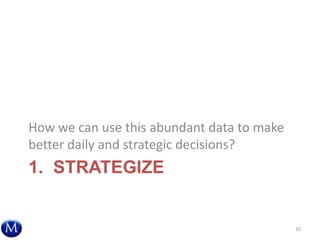
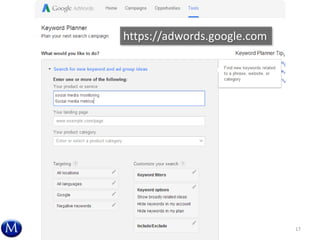
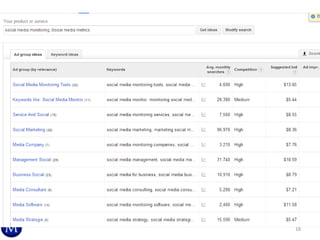
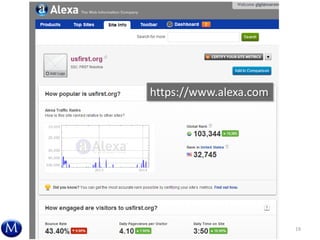
This document provides an overview of a webinar about using data more effectively. The webinar discusses strategies for proactively gathering relevant data, saving time in current data practices, and using social media for business intelligence. It outlines a 5-step process: 1) strategizing how to use abundant data, 2) creating simple systems to access and store data, 3) listening to data from within and outside the organization, 4) visualizing data to make and persuade around decisions, and 5) sharing data and tools collaboratively. Examples of specific tools are also provided. The webinar aims to help organizations and individuals improve key performance metrics by developing a data strategy and better leveraging abundant data sources.


![제 23회 보아즈(BOAZ) 빅데이터 컨퍼런스 - [MBOAX] : ABSA를 활용한 소비자 반응 분석 기반 운영 효율화 대시보드 설계](https://cdn.slidesharecdn.com/ss_thumbnails/3-1boaz23rdconferencemboax-260203102709-9d519923-thumbnail.jpg?width=640&height=640&fit=bounds)


