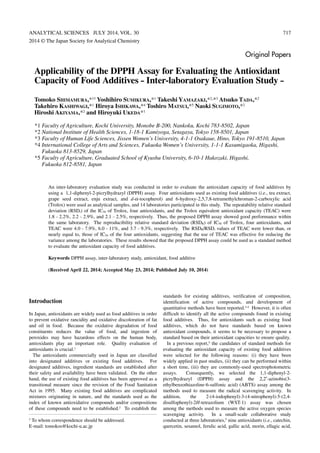
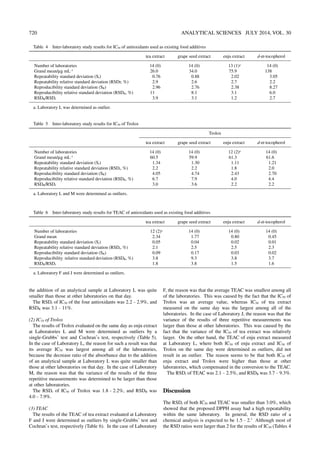
2. 718 ANALYTICAL SCIENCES JULY 2014, VOL. 30
d-α-tocopherol, and d-δ-tocopherol) were evaluated using the
above-mentioned assays. The protocol of the DPPH assay was
then improved based on the results of the small-scale
collaborative study. Herein, the antioxidative activities of five
analytical samples, four antioxidants used as existing food
additives (i.e., tea extract, grape seed extract, enju extract and
d-α-tocopherol), and 6-hydroxy-2,5,7,8-tetramethylchroman-2-
carboxylic acid (Trolox) were evaluated using the DPPH assay
based on the improved protocol at fourteen laboratories.
Thereafter, we investigated the validity of this assay as a
standard method.
Experimental
Participating laboratories
This inter-laboratory evaluation study was conducted
according to an international harmonized protocol.6 The
fourteen laboratories that participated in this study was as
follows: Food Analysis Technology Center SUNATEC;
International College of Arts and Sciences, Fukuoka Women’s
University; Mycotoxin Research Association; Japan Food
Research Laboratories; Faculty of Agriculture, Graduated
School of Kyushu University; Japan Inspection Association of
Food and Food Industry Environment; Japan Frozen Foods
Inspection Corporation; College of Pharmacy, Kinjo Gakuin
University; Faculty of Agriculture, Kochi University; Graduate
School of Pharmaceutical Sciences, Nagoya City University;
Division of Food Additives, National Institute of Health
Sciences; College of Bioresources Science, Nihon University;
Shin Nihon Kentei Kyokai; Tokyo Kenbikyoin Foundation.
These laboratories were indicated as A to N in a random order.
The analytical procedure listing the methods for preparing
reagents and analytical samples, measuring, and the handling of
data was distributed to the participating laboratories.
Analytical samples
Tea extract (main component: catechin), grape seed extract
(main component: proanthocyanidin), enju extract (Japanese
Pagoda Tree extract; main component: rutin), and d-α-tocopherol
were obtained from the Japan Food Additive Association. One
gram of the food additive sample from the same lot was
distributed to each laboratory. The water solubility of active
compounds in tea extract and grape seed extract is relatively
high, and that in enju extract and d-α-tocopherol is relatively
low. Based on the results of a preliminary experiment, tea
extract and grape seed extract, which belonged to the class of
high antioxidant capacity, enju extract, which belonged to the
class of medium activity, and d-α-tocopherol, which belonged
to the class of low activity, were selected as analytical samples
among the various antioxidants of existing food additives.
Trolox of the same lot was purchased from Sigma-Aldrich (St.
Louis, MO) and distributed to each laboratory without opening.
The method used for storing analytical samples was detailed in
the analytical procedure.
DPPH radical scavenging assay
In this study, the DPPH assay was conducted according to the
following procedure. DPPH (Wako Pure Chemical Industries,
Osaka, Japan) of the same lot was distributed to the participating
laboratories. The methods for preparing each reagent were
detailed in the analytical procedures. To prevent the influence
of static electricity during the weighing of a reagent, a static
electricity remover (EST-M, Ishiyama Seisakusyo Co., Ltd.,
Tokyo, Japan) was distributed to the participating laboratories.
(1) Preparing DPPH solution
DPPH (7.89 mg) was weighed on a chemical balance with a
minimum weighing limit of 10 μg or smaller. Thereafter, it was
dissolved in 99.5% ethanol to obtain a constant volume by
filling 100 mL of a measuring flask or a measuring cylinder
with a stopper (0.2 mM DPPH). The absorbance of a DPPH
solution is empirically known to decrease with time until
approximately 1 h after preparation. Therefore, it was kept in
the dark for 2 h until the absorbance stabilized. After 2 h, 1 mL
of the DPPH solution was added into a test tube or sampling
tube, and then 200 μL of ethanol and 800 μL of 0.1 M Tris–HCl
buffer (pH 7.4) were added. After mixing, the absorbance at
517 nm was measured. A mixed solution containing 1.2 mL of
ethanol and 800 μL of Tris–HCl buffer was used as the blank.
When the absorbance was in a range of 1.00 ± 0.05, the prepared
DPPH solution was used directly for the measurements; when
the absorbance exceeded 1.05, ethanol was added to dilute the
solution to be within a range of 1.00 ± 0.05. Afterwards, the
solution was used for the measurements. The DPPH solution
was stored in the dark at room temperature during the assay, and
used up on the day of preparation.
(2) DPPH assay procedure
After 200 μL of an analytical sample solution and 800 μL of
0.1 M Tris–HCl buffer (pH 7.4) were added into a test tube or
sampling tube, 1 mL of the DPPH solution was added.
Immediately, the solution was mixed with a test tube mixer for
10 s. Thereafter, it was left at room temperature in the dark.
Exactly 30 min after the addition of the DPPH solution, the
absorbance of the solution at 517 nm was measured. A mixed
solution of 1.2 mL of ethanol and 800 μL of Tris–HCl buffer
was used as the blank.
The absorbance at the addition of the analytical sample was
expressed as As, the absorbance at the addition of ethanol
instead of the sample as Ac, and the inhibition ratio (%) was
obtained from the following equation:
Inhibition ratio (%) = {(Ac – As)/Ac} × 100.
In the analytical procedure distributed, the measurements at
six points of concentration, including control, were required.
The measurement of the DPPH radical scavenging activity for
the analytical sample solution at each concentration was
repeated three times.
(3) Calculation of IC50
The IC50 of each analytical sample was calculated according
to the following procedure:
(1) Inhibition ratios (y) were plotted against the sample
concentrations (x) at all six points, and the respective regression
line (y = ax + b) was drawn.
The regression line was not required to pass through the
origin. In this step, we verified that all of the measurement
points were basically on the regression line. In addition, it was
also verified that two points at around the 50% inhibition did
not have a deviation from the regression line. In fact, because
the inhibition curve is not completely straight, but slightly
curved, we decided to calculate the IC50 value using the
interpolation method by joining the two points around the 50%
inhibition with a straight line as follows:
(2) Two points enclosing a 50% inhibition ratio were selected,
and a regression line (Y = AX + B) was drawn. The regression
line was not required to pass through the origin.
(3) X (sample concentration) was calculated, when Y in the
regression equation of (2) was substituted with 50.
3. ANALYTICAL SCIENCES JULY 2014, VOL. 30 719
(4) The average value of (3) obtained at each of the three
repetitive measurements was calculated. This value was set as
the IC50 (μg mL–1) value of each analytical sample.
(4) Calculation of Trolox equivalent antioxidant capacity
The DPPH radical scavenging activity of each analytical
sample was expressed as the Trolox equivalent antioxidant
capacity (TEAC). TEAC was calculated as follows:
TEAC = IC50 of Trolox (μg mL–1
)/IC50 of sample (μg mL–1
).
The higher TEAC value means the higher DPPH radical
scavenging activity. In this study, the values of the IC50 of an
analytical sample and IC50 of Trolox, measured on the same day,
were used to obtain the TEAC.
Statistical Analyses
Statistical analyses of the collected data were conducted as
follows:6 outlier detection was conducted using the Cochran’s
test, single-Grubbs’ test, and paired-Grubbs’ test. The Cochran’s
test was used to identify the outlying variance. The single and
paired-Grubbs’ tests was used to identify the outlying value
from the averages. Based on the result of each test, the outliers
were rejected. An analysis of the variance was then conducted
for each analytical sample so as to calculate the repeatability
standard deviation (Sr), reproducibility standard deviation (SR),
repeatability relative standard deviation (RSDr), reproducibility
relative standard deviation (RSDR), and RSD ratio (RSDR/RSDr).
Microsoft Office Excel 2010 was used for data analysis.
Results
Values reported by the participating laboratories
Tables 1 and 2 show the IC50 of the antioxidants (μg mL–1)
and the IC50 of Trolox (μg mL–1), respectively, which were
reported by the fourteen laboratories. In this study, one
antioxidant and Trolox were measured on the same day, and the
TEAC of each antioxidant was calculated based on the IC50 of
Trolox obtained on the same day. Therefore, as shown in
Table 2, Trolox measured on each day was dealt as an
independent data point for statistical analysis. Table 3 gives the
TEAC calculated from the values appearing in Tables 1 and 2.
Results of inter-laboratory study
Tables 4 and 5 show the results of an inter-laboratory study on
the IC50 of the antioxidants used as existing food additives and
the IC50 of Trolox, respectively. Table 6 gives the results of the
inter-laboratory study on TEAC.
(1) IC50 of the antioxidants used as existing food additives
In the results on the IC50 of tea extract, grape seed extract,
enju extract and d-α-tocopherol (Table 4), the result of enju
extract measured by Laboratory L was determined as an outlier
by a single-Grubbs’ test. The reason was that the average of
IC50 at Laboratory L was largest among all of the laboratories
(Table 1), because the decrease ratio of the absorbance due to
Table 1 IC50 of antioxidants used as existing food additives
determined using the DPPH assay in the inter-laboratory study
Laboratory
IC50/μg mL–1 a
tea extract
grape seed
extract
enju extract d-α-tocopherol
A
B
C
D
E
F
G
H
I
J
K
L
M
N
27.0 ± 0.4
25.2 ± 0.3
25.7 ± 1.0
29.4 ± 0.2
24.2 ± 0.4
30.8 ± 1.7
25.3 ± 0.8
24.4 ± 0.03
26.2 ± 0.6
20.7 ± 1.4
25.3 ± 0.1
27.5 ± 0.4
25.7 ± 0.8
26.3 ± 0.5
38.0 ± 0.8
33.7 ± 1.8
33.5 ± 0.7
32.7 ± 0.2
31.1 ± 0.3
36.1 ± 0.8
33.4 ± 1.1
33.5 ± 0
32.9 ± 0.9
31.4 ± 0.4
37.5 ± 1.4
35.9 ± 0.6
34.4 ± 0.9
31.5 ± 0.5
76.6 ± 0.4
75.6 ± 0.2
73.9 ± 1.5
77.6 ± 1.0
77.8 ± 0.9
77.8 ± 3.0
74.1 ± 0.5
74.9 ± 0.1
78.2 ± 0.5
74.6 ± 2.0
76.4 ± 4.5
92.1 ± 1.2
75.3 ± 3.7
74.3 ± 1.4
141 ± 1.7
139 ± 5.4
133 ± 3.5
137 ± 0.8
133 ± 0.9
142 ± 3.0
128 ± 1.7
134 ± 0
143 ± 0.8
148 ± 6.4
150 ± 3.1
137 ± 1.6
130 ± 4.1
135 ± 1.7
a. Mean ± S.D. (n = 3).
Table 2 IC50 of Trolox determined using the DPPH assay in the
inter-laboratory study
Laboratory
IC50/μg mL–1 a
Trolox
tea extract
grape seed
extract
enju extract d-α-tocopherol
A
B
C
D
E
F
G
H
I
J
K
L
M
N
64.2 ± 0.8
57.9 ± 2.0
62.9 ± 1.1
65.9 ± 0.08
56.7 ± 0.2
61.2 ± 1.1
59.1 ± 1.8
56.4 ± 0.1
62.9 ± 0.5
55.9 ± 1.2
61.5 ± 2.8
64.1 ± 0.8
58.8 ± 1.8
59.1 ± 1.3
64.3 ± 0.7
61.9 ± 2.4
60.8 ± 1.4
61.8 ± 0.5
57.6 ± 0.2
65.2 ± 1.4
59.1 ± 1.9
58.1 ± 0.1
61.2 ± 1.0
55.5 ± 1.3
50.6 ± 1.3
62.9 ± 1.2
61.4 ± 1.8
58.0 ± 0.3
64.6 ± 1.0
61.4 ± 2.2
59.8 ± 1.1
63.5 ± 0.5
61.5 ± 0.7
62.7 ± 0.5
59.3 ± 1.8
58.5 ± 0.1
63.1 ± 0.4
61.2 ± 0.4
61.0 ± 1.8
70.1 ± 1.0
57.6 ± 3.4
59.3 ± 0.3
61.3 ± 1.2
63.0 ± 1.9
58.6 ± 1.6
62.7 ± 0.3
61.8 ± 0.8
65.1 ± 1.2
58.5 ± 0.7
60.5 ± 0.1
61.9 ± 0.7
64.4 ± 2.0
63.0 ± 1.7
61.5 ± 0.6
58.3 ± 1.6
61.9 ± 0.3
a. Mean ± S.D. (n = 3).
Table 3 TEAC of antioxidants used as existing food additives
determined using the DPPH assay in the inter-laboratory study
Laboratory
TEACa
tea extract
grape seed
extract
enju extract d-α-tocopherol
A
B
C
D
E
F
G
H
I
J
K
L
M
N
2.38 ± 0.04
2.30 ± 0.03
2.45 ± 0.10
2.24 ± 0.01
2.34 ± 0.04
1.99 ± 0.11
2.34 ± 0.07
2.32 ± 0.003
2.40 ± 0.06
2.71 ± 0.18
2.44 ± 0.008
2.33 ± 0.03
2.29 ± 0.07
2.25 ± 0.04
1.69 ± 0.04
1.84 ± 0.10
1.82 ± 0.04
1.89 ± 0.009
1.85 ± 0.02
1.81 ± 0.04
1.77 ± 0.06
1.73 ± 0
1.86 ± 0.05
1.77 ± 0.03
1.35 ± 0.05
1.76 ± 0.03
1.79 ± 0.05
1.85 ± 0.03
0.84 ± 0.004
0.81 ± 0.002
0.81 ± 0.02
0.82 ± 0.01
0.79 ± 0.009
0.81 ± 0.03
0.80 ± 0.006
0.78 ± 0.001
0.81 ± 0.005
0.82 ± 0.02
0.80 ± 0.05
0.76 ± 0.01
0.77 ± 0.04
0.80 ± 0.02
0.44 ± 0.005
0.45 ± 0.02
0.44 ± 0.01
0.46 ± 0.003
0.47 ± 0.003
0.46 ± 0.01
0.46 ± 0.006
0.45 ± 0
0.43 ± 0.003
0.44 ± 0.02
0.42 ± 0.008
0.45 ± 0.005
0.45 ± 0.01
0.46 ± 0.006
a. Mean ± S.D. (n = 3).
4. 720 ANALYTICAL SCIENCES JULY 2014, VOL. 30
the addition of an analytical sample at Laboratory L was quite
smaller than those at other laboratories on that day.
The RSDr of IC50 of the four antioxidants was 2.2 – 2.9%, and
RSDR was 3.1 – 11%.
(2) IC50 of Trolox
The results of Trolox evaluated on the same day as enju extract
at Laboratories L and M were determined as outliers by a
single-Grubbs’ test and Cochran’s test, respectively (Table 5).
In the case of Laboratory L, the reason for such a result was that
its average IC50 was largest among all of the laboratories,
because the decrease ratio of the absorbance due to the addition
of an analytical sample at Laboratory L was quite smaller than
those at other laboratories on that day. In the case of Laboratory
M, the reason was that the variance of the results of the three
repetitive measurements was determined to be larger than those
at other laboratories.
The RSDr of IC50 of Trolox was 1.8 – 2.2%, and RSDR was
4.0 – 7.9%.
(3) TEAC
The results of the TEAC of tea extract evaluated at Laboratory
F and J were determined as outliers by single-Grubbs’ test and
Cochran’s test, respectively (Table 6). In the case of Laboratory
F, the reason was that the average TEAC was smallest among all
of the laboratories. This was caused by the fact that the IC50 of
Trolox was an average value, whereas IC50 of tea extract
measured on the same day was the largest among all of the
laboratories. In the case of Laboratory J, the reason was that the
variance of the results of three repetitive measurements was
larger than those at other laboratories. This was caused by the
fact that the variance of the IC50 of tea extract was relatively
larger. On the other hand, the TEAC of enju extract measured
at Laboratory L, where both IC50 of enju extract and IC50 of
Trolox on the same day were determined as outliers, did not
result in an outlier. The reason seems to be that both IC50 of
enju extract and Trolox were higher than those at other
laboratories, which compensated in the conversion to the TEAC.
The RSDr of TEAC was 2.1 – 2.5%, and RSDR was 3.7 – 9.3%.
Discussion
The RSDr of both IC50 and TEAC was smaller than 3.0%, which
showed that the proposed DPPH assay had a high repeatability
within the same laboratory. In general, the RSD ratio of a
chemical analysis is expected to be 1.5 – 2.7 Although most of
the RSD ratios were larger than 2 for the results of IC50 (Tables 4
Table 4 Inter-laboratory study results for IC50 of antioxidants used as existing food additives
tea extract grape seed extract enju extract d-α-tocopherol
Number of laboratories
Grand mean/μg mL–1
Repeatability standard deviation (Sr)
Repeatability relative standard deviation (RSDr, %)
Reproducibility standard deviation (SR)
Reproducibility relative standard deviation (RSDR, %)
RSDR/RSDr
14 (0)
26.0
0.76
2.9
2.96
11
3.9
14 (0)
34.0
0.88
2.6
2.76
8.1
3.1
13 (1)a
75.9
2.02
2.7
2.38
3.1
1.2
14 (0)
138
3.05
2.2
8.27
6.0
2.7
a. Laboratory L was determined as outlier.
Table 6 Inter-laboratory study results for TEAC of antioxidants used as existing food additives
tea extract grape seed extract enju extract d-α-tocopherol
Number of laboratories
Grand mean
Repeatability standard deviation (Sr)
Repeatability relative standard deviation (RSDr, %)
Reproducibility standard deviation (SR)
Reproducibility relative standard deviation (RSDR, %)
RSDR/RSDr
12 (2)a
2.34
0.05
2.1
0.09
3.8
1.8
14 (0)
1.77
0.04
2.5
0.17
9.3
3.8
14 (0)
0.80
0.02
2.5
0.03
3.8
1.5
14 (0)
0.45
0.01
2.3
0.02
3.7
1.6
a. Laboratory F and J were determined as outliers.
Table 5 Inter-laboratory study results for IC50 of Trolox
Trolox
tea extract grape seed extract enju extract d-α-tocopherol
Number of laboratories
Grand mean/μg mL–1
Repeatability standard deviation (Sr)
Repeatability relative standard deviation (RSDr, %)
Reproducibility standard deviation (SR)
Reproducibility relative standard deviation (RSDR, %)
RSDR/RSDr
14 (0)
60.5
1.34
2.2
4.05
6.7
3.0
14 (0)
59.9
1.30
2.2
4.74
7.9
3.6
12 (2)a
61.3
1.11
1.8
2.43
4.0
2.2
14 (0)
61.6
1.21
2.0
2.70
4.4
2.2
a. Laboratory L and M were determined as outliers.
5. ANALYTICAL SCIENCES JULY 2014, VOL. 30 721
and 5), the RSD ratios of tea extract, enju extract, and
d-α-tocopherol were smaller than 2 concerning the result of
TEAC (Table 6). This result suggests that the use of the TEAC,
a value calculated from the IC50 of the antioxidant and IC50 of
Trolox measured on the same day, was effective for reducing the
inter-laboratory differences by compensating for the variations.
Although many inter-laboratory evaluation studies on standard
methods for food components have been conducted, there are
few reports on a large-scale evaluation study on antioxidant
capacity assays.8 In the case of the inter-laboratory collaborative
study on improved Hydrophilic Oxygen Radical Absorbance
Capacity (H-ORAC) assay, in which 14 laboratories participated,
and (+)-catechin, ferulic acid, caffeine acid, hesperetin, Trolox,
and five kinds of food (i.e., cabbage, onion, apple, Satsuma
orange, and eggplant) were used as analytical samples, it was
reported that the RSDr of the H-ORAC value (μmol Trolox/L)
was 4.6 – 19%, and the RSDR was 7.0 – 21%.9 As the result of
evaluating further improved H-ORAC assay at five laboratories
using similar samples, it was reported that the RSDr was
1.8 – 9.4%, and the RSDR was 4.4 – 14%.9 An inter-laboratory
collaborative study on the DPPH assay for 11 kinds of food and
beverages at nine laboratories was also reported.10 In the DPPH
assay used in the previous report,10
the DPPH concentration was
0.1 mM, the volume of the reaction solution was approximately
50 mL, the reaction time was 4 h, and the reaction temperature
was 35°C; those reaction conditions were largely different from
those used in this study. As a result, it was reported that the
RSDr of the antioxidant capacity (μmol Trolox/100 g) was
1.1 – 25%, and RSDR was 5.3 – 59%.10
Since the measurement
principle of the DPPH assay was different from that of the
ORAC assay, and the procedure and nature of the analytical
samples in the DPPH assay used in the previous report were
largely different from those in our study, the results of the two
studies cannot be directly compared. However, the repeatability
and reproducibility obtained in our study was found to be higher
than those in the previous two reports.9,10
Herein, the absorbance was measured with spectrophotometers
owned by the laboratories. Therefore, the equipment type was
not unified. Although one of the laboratories used a shipper unit
to measure the absorbance, neither the difference in types of
spectrophotometers nor the difference in absorbance measuring
methods had any influence on the results of this study.
Therefore, the proposed DPPH assay had robustness not to be
affected by types of the spectrophotometer.
As mentioned above, we selected antioxidants having different
water solubility and antioxidant capacity based on the results of
a preliminary experiment. The inter-laboratory evaluation
revealed that the difference in the water solubility and antioxidant
capacity of antioxidative compounds did not have a large
influence on the precision of the proposed DPPH assay.
Therefore, the proposed DPPH assay is applicable for evaluating
the antioxidant capacity of a wide range of antioxidants.
Based on the above reasons, we concluded that the protocol of
the DPPH assay used in this study is applicable as a standard
method to evaluate the antioxidant capacity of antioxidants used
as existing food additives. From now on, the antioxidative
capacities of other existing food additives will be continuously
collected to establish standard values for individual antioxidants
based on their antioxidant capacities.
Acknowledgements
We expressed our deepest appreciation to all of the participating
laboratories in this study. This study was supported by a
Grant-in-Aid for Scientific Research from the Ministry of
Health, Welfare and Labour of Japan.
References
1. H.-D. Belitz, W. Grosch, and P. Schieberle, “Food
Chemistry”, 4th ed., 2009, Springer-Verlag GmbH,
Heidelberg, 187.
2. K. Sato, Shokuhin Eiseigaku Zasshi, 2010, 51, 331.
3. T. Yoshida, K. Terasaka, S. Kato, F. Bai, N. Sugimoto, H.
Akiyama, T. Yamazaki, and H. Mizukami, Chem. Pharm.
Bull., 2013, 61, 1264.
4. K. Ishizuki, A. Tada, N. Sugimoto, K. Matsumoto, H.
Ukeda, H. Matsufuji, T. Yamazaki, and Y. Kawamura, Jpn.
J. Food Chem. Safety, 2010, 17, 192.
5. T. Shimamura, R. Matsuura, T. Tokuda, N. Sugimoto, T.
Yamazaki, H. Matsufuji, T. Matsui, K. Matsumoto, and H.
Ukeda, Nippon Shokuhin Kagaku Kogaku Kaishi, 2007, 54,
482.
6. W. Horwitz, Pure Appl. Chem., 1995, 67, 331.
7. W. Horwitz, L. R. Kamps, and K. W. Boyer, J. AOAC Int.,
1980, 63, 1344.
8. A. Hakoda, Nippon Shokuhin Kagaku Kogaku Kaishi, 2010,
57, 134.
9. J. Watanabe, T. Oki, J. Takebayashi, K. Yamasaki, Y.
Takano-Ishikawa, A. Hino, and A. Yasui, Anal. Sci., 2012,
28, 159.
10. D. W. Plank, J. Szpylka, H. Sapirstein, D. Woollard, C. M.
Zapf, V. Lee, C. Y. Chen, R. H. Liu, R. Tsao, A. Düsterloh,
and S. Baugh, J. AOAC Int., 2012, 95, 1562.