Treated wastewater has significantly improved DM yield compared to ground water. The form of nitrogen provided by the water was determinant in drawing yields. Irrigation with ground water (where nitrogen is as nitrate) induces a faster migration of nitrogen at depth. In contrast, using treated wastewater (where nitrogen is as ammonium), resulting in a relative distribution of the remaining nitric smaller in the lower profile and therefore higher in the surface, especially after the second year (2010). In addition, the relative distribution of nitrates in the soil surface is even more important in the presence of organic manure. All happens as if a certain amount of ammonium provided by treated wastewater is retained in the organic compounds of manure. Yields were significantly lower in irrigation with treated wastewater in the second year and especially when fertilization was given in additional. If the soil can be used for storage of the nitrogen supplied by the treated wastewater during the first year of irrigation (24 kg N-NO3/ha before irrigation to 115 kg N-NO3/ha after irrigation), to the second year the capacity drops (to 64 N-NO3/ha) and a significant increase in nitrate leaching occurs. Therefore, unlike the contribution of manure that seems enrich the topsoil nitrate nitrogen, at least during the first campaign, mineral fertilization unreasoning causes faster migration of nitrogen at depth.
Improving Fruit Quality and Nutritional Value of Deglet Nour dates subjected ...Agriculture Journal IJOEAR
A field study was carried out during the two consecutive years (2015-2016) in the region of Biskra, southern east of Algeria on date palms of Deglet-Nour variety, grown in a salty environment. To study the combined effect of salinity and phospho-potassium fertilization on the quality and nutritional value of dates, two sites of different salinity, occupied by 54 date palms variety Deglet-Nour has been selected. The palms were fertilized by receiving three doses of potassium (0, 2 and 3 kg / palm) as potassium sulphate K 2 SO 4 (50%) combined with three levels of phosphorus (0, 1 and 2 kg / palm) as superphosphate (TSP 46%). The results revealed that applying 2 kg of potassium/palm in an excessively salty environment and 3 kg/palm in a low or unsalted environment associated to 1 kg of phosphorus in the two different cases of salinity of the two sites S1 and S2 improving the fruit traits.
An efficient incentive of Nitrate and Fluoride on Organic highland cropping s...IOSR Journals
Abstract: Exerting necessitated concentrations of Nitrate and fluoride to the organic highland cropping
systems is a vital management technique. All the chemical elements of the earth’s crust occur in widely differing
omnipresent concentrations, due to their different nuclear chemical formation and geochemical history. The use
of biological nitrogen and fluoride inputs complicates its balancing act due to dandier uncertainty in inorganic
Nitrogen and Fluoride availability. The growers to strike maintain Nitrogen provisioning to support crop
growth and retention of limit pollution followed by fluoride associated soils. Due to various activities of the man
in domestic field, agriculture area and industrial establishment the environment around us consisting soil, water
and air gets polluted. Fluoride inexhaustible concentrations forbid the growth of crop even though nitrates
reposit in the cultivated soils. The purpose of this project was to establish kinetics when nitro fluorides
associated in the highland soils to different crop systems towards environmental pollutions. Cordia Africana
and alfalfa are the plants which make soil to get enrichment of Nitrates and deescalate of concentrations of
fluorides from cultivated soils through its decomposition. This entire study went on its conventionally tilled
crops followed by Cordia Africana and alfalfa stems and leaf particles. Surface soil nitrate concentrations were
measured weekly, biweekly by volumetric analysis and nitrate leaching was estimated from tension Lysimeters
which were buried at the soil bedrock interface. Subsequently by using Orion 720A fluoride ion meter, deescalated
concentrations of fluorides have been measured. The demonstrated concentrations of Soil in NO3
variables, coefficients of variations from the mean concentrations across all samplings have been recorded
sporadically. The total area of the soil bed was maintained the same PH values until project was completed by
weigh Lysimeters. The timing of elevated Nitrate concentrations (10-15PPM) and the concentrations of fluoride
in deeper soil water corresponds with fallow periods. These dynamics will assist growers in adapting the timing
management operations and reduces nitrate departures.
Enhancing Productivity and Livelihoods Among Smallholder Irrigators through B...Jenkins Macedo
This is a research project in progress. A full report with results will be available at the end of the year [2014] and after the thesis has being defended at Clark University. This research is funded by Purdue University Center for Global Food Security through a grant funded by the USAID.
Recently, concern over agricultural diffuse pollution sources in integrated water quality management has been growing. High inorganic and organic fertilisers application rates may increase groundwater pollution and these effects were investigated in the Dufuya Wetland (19o17’S; 29o21’E) in Chief Sogwala area of Lower Gweru Communal Lands, approximately 42km west of the City of Gweru, Zimbabwe. Forty-two (42) water samples were collected for analysis of pH, conductivity, calcium, nitrates, and phosphates during the months of September, October, and November 2008. A questionnaire procedure was used for collection of manure application rate, wetland and crop management data in the studied area. The results demonstrated that cattle manure in the Dufuya wetland is applied at the rate of 30t/ha- 60t/ha per year. Groundwater and surface runoff water samples have pH, conductivity, calcium, phosphates and nitrates levels within the WHO permissible guideline of 6.5-8.5, 1500µScm-1, 200mg/l, 0.09mg/l and 10mg/l respectively. The mean nitrate and phosphate concentrations in surface run-off water in the garden and the sponge are 0.00275mg/l, 0.0117mg/l and 0.00377mg/l, 0.00077mg/l respectively. Groundwater concentrations are 0.026mg/l, 0.0167mg/l and 0.0021mg/l, 0.00228mg/l for nitrates and phosphates respectively. There was no significant difference in the mean concentrations of nitrates and phosphates in water (ground/surface) in the sponge and the garden (P < 0.005). Fertiliser applications have no negative effects on dambo water quality.
Assessment of Zinc and Copper Status of Fadama Soils In Borgu Local Governmen...Agriculture Journal IJOEAR
Abstract— The status of Zinc (Zn) and Copper (Cu) of fadama soils under cultivation at Borgu Local Government Area, Niger State, Nigeria was studied. Soil samples were purposely collected from three extension blocks, namely; Wawa, Babana and Goffanti. Particle size distribution of the soils showed sandy loam texture. The soils pH were either slightly acidic or neutral with a range between 6.05 and 6.93. The level of Organic Carbon (OC) ranged between low and medium, total nitrogen were rated high, available phosphorus were low while exchangeable cations (Na, K, Ca, Mg) were all rated high. Though soil content of Zn and Cu were very low, values were not significantly (P<0.05) different for all locations. The mean values for Zn ranged between 0.496 and 0.592 mg/kg, while Cu ranged between 0.550 and 0.945 mg/kg. This result implies that soil amendments in the form of organic manure and/or supplement of Zn and Cu would enhance nutrient availability for optimum yields of crops for the resource-poor farmers in the study area.
Effects of drip irrigation frequency and depth on soil hydro-physical propert...inventionjournals
International Journal of Engineering and Science Invention (IJESI) is an international journal intended for professionals and researchers in all fields of computer science and electronics. IJESI publishes research articles and reviews within the whole field Engineering Science and Technology, new teaching methods, assessment, validation and the impact of new technologies and it will continue to provide information on the latest trends and developments in this ever-expanding subject. The publications of papers are selected through double peer reviewed to ensure originality, relevance, and readability. The articles published in our journal can be accessed online.
Effects of Irrigation Practices on Some Soil Chemical Properties on OMI Irrig...IJERA Editor
Irrigation practices have been observed to impact scheme soil properties and other parameters negatively. These could be as a result of irrigation water quality, method of application and nature of scheme soil. This study was therefore conducted to study the effects of irrigation practices on the soils of Omi irrigation scheme Kogi state, Nigeria after 13years of operation. Soil samples were taken at depths 0 – 20 cm (A1), 20 – 80 cm (A2) and 80 – 120 cm (A3) from two operating lands (OL); OL 5 and OL 18 of the study area. The samples were analysed for chemical parameters (pH, CEC, ESP, Mg2+, Ca2+, OM, and OC). The soil pH which was in the neutral range (pH=6.65 to 7.00) at inception of scheme, has become slightly acidic (pH=6.53 to 6.60). Cation exchange capacity (CEC) levels have also increased from 10cmol+kg-1 to 35cmol+kg-1. While Organic matter (OM) and Organic carbon (OC) also have marked increase in their levels (baseline as 0.93 to 1.08; for year 2013 as 9.52 to 9.79). Generally, the analysis indicated a need for proper monitoring of the scheme soil to prevent further deterioration.
Assessment of aquaculture sediment for agricultural fertilizer supplement and...researchagriculture
Overuse of farmlands for crop production and rising cost of chemical Overuse of farmlands for crop production and rising cost of chemical fertilizers have grossly affected crop yield, production and food availability, and the search for alternative use of locally available aquaculture-waste for fertilizer and soil improvement can improve crop yield and food availability for the teaming population of Nigeria and other sub-Saharan African countries. This research determined the pH, Organic Matter, nitrate and phosphate qualities of 10 fishpond sediments for use as agricultural fertilizer supplement and soil conditioner in Owerri, Nigeria. Samples were subjected to standard physicochemical analysis. The pH ranged from 8.1-7.3, organic matter from 46.6-61.3 g/kg, nitrate from 2.6-3.2 g/kg and phosphate from 0.05-0.1 g/kg. The higher the organic matter in the sediment samples, the higher the recorded pH, nitrate and phosphate from the different ponds sediments. Organic material, nitrate, phosphate and pH variation in the sediments might be due to nutrients added to pond water from fertilizer, unconsumed feed, fish feaces and metabolites. The nitrate and phosphate are major plant nutrients; organic matter can be used as soil conditioner. The pH can determine the soil chemistry and availability of the nutrients. The fish pond sediment can help to improve soil texture and soil fertility, which may influence soil aeration, water, and nutrient-holding capacity and root penetration by crops and increased crops growth and yield. It can serve as alternative uses for fertilizer, soil conditioner, and its application as a waste management approach in aquaculture for environmental sustainability.
Article Citation:
Ihejirika CE, Onwudike SU, Nwaogu LA, Emereibeole EI, Ebe TE and Ejiogu CC.
Assessment of aquaculture sediment for agricultural fertilizer supplement and soil conditioner in Owerri Urban, Nigeria.
Journal of Research in Agriculture (2012) 1(1): 034-038.
Full Text:
http://www.jagri.info/documents/AG0009.pdf
Assessment of aquaculture sediment for agricultural fertilizer supplement an...researchagriculture
Overuse of farmlands for crop production and rising cost of chemical
Overuse of farmlands for crop production and rising cost of chemical fertilizers have
grossly affected crop yield, production and food availability, and the search for
alternative use of locally available aquaculture
-
waste for fertilizer and soil
improvement can improve crop yield and food availability for the teaming population
of Nigeria and other sub
-
Saharan African countries. This research determined the pH,
Organic Matter, nitrate and phosphate qualities of 10 fishpond sediments for use as
agricultural fertilizer supplement and soil conditioner in Owerri, Nigeria. Samples
were subjected to standard physicochemical analysis. The pH ranged from 8.1
-
7.3,
organic matter from 46.6
-
61.3 g/kg, nitrate from 2.6
-
3.2 g/kg and phosphate from
0.05
-
0.1 g/kg. The higher the organic matter in the sediment samples, the higher the
recorded pH, nitrate and phosphate from the different ponds sediments. Organic
material, nitrate, phosphate and pH variation in the sediments might be due to
nutrients added to pond water from fertilizer, unconsumed feed, fish feaces and
metabolites. The nitrate and phosphate are major plant nutrients; organic matter can
be used as soil conditioner. The pH can determine the soil chemistry and availability
of the nutrients. The fish pond sediment can help to improve soil texture and soil
fertility, which may influence soil aeration, water, and nutrient
-
holding capacity and
root penetration by crops and increased crops growth and yield. It can serve as
alternative uses for fertilizer, soil conditioner, and its application as a waste
management approach in aquaculture for environmental sustainability.
— The study evaluated the effects of land use and occupation in water quality in two sub-basins located in the State of Paraná, Brazil. The first sub-basin has 69.8% of native vegetation (natural) and the other has 54.1% of the land cultivated (anthropic). Samples were collected from April to December 2015, analyzing the following parameters: dissolved oxygen, temperature, electrical conductivity, pH, total dissolved solids, turbidity, color, biochemical oxygen demand, total nitrogen, total phosphorus and fecal coliforms. The natural sub-basin presented, significantly, better water quality. Total phosphorus, biochemical oxygen demand and fecal coliforms exceeded the legal limits on the anthropic sub-basin. At this sub-basin correlation was found between cumulative rainfall of five days with turbidity and fecal coliforms, two days cumulative rainfall and total nitrogen, as well as between air and water temperature, affecting the dissolved oxygen, pH, electrical conductivity and fecal coliforms. In the natural sub-basin correlation was found between cumulative rainfall of two days and turbidity, total dissolved solids and electrical conductivity.
Effects of salinity stress on growth, Water use efficiency and biomass partit...Innspub Net
Future crop production is predicted to face significant challenges from salinity stress due to secondary salinization. Therefore future-proofing crop production in these conditions is an essential path towards addressing food security. We evaluated the effect of irrigation with water of 0, 4 and 8 ppt salinity on growth, biomass partitioning, WUE and chlorophyll fluorescence of Vernonia hymenolepis A.Rich as ameliorated by fertilization with three levels of NPK20:10:10. Data were analysed for variance using the General Linear Model ANOVA procedure, after positive tests for normality and homogeneity of variance. Means were separated through the Dunnett test. Pearson Correlation was done to determine relationship between variables and these were spatially projected using the Factor Analysis procedure, without rotation. Under fertilization at 8 g NPK20:10:10 per plant, growth was stimulated by salinity increase to 4 ppt (35.43cm) compared to 30.43cm for control plants. Fertilizer application significantly improved all the biomass fractions of plants irrigated with water of 4 ppt relative to the control, while root:shoot ratios were highest for unfertilized plants indicating resource re-allocation to roots for better foraging. Chlorophyll fluorescence ranged between 0.716 and 0.727 and did not differ significantly across treatments. These values indicate that all treatments were under stress, including control plants. Values of WUE and RGR indicate that fertilization of plants irrigated with water of 4ppt salinity enhances growth and Harvest Index of V. hymenolepis, in spite of the registered stress. This is significant to future food security.
Integrated Effect of Mulching Materials and Furrow Irrigation Methods on Yiel...Premier Publishers
A field experiment was conducted at Werer, Middle Awash Valley during the dry season of the 2016-17, 2017-18 and 2018-19 to investigate the effects of mulching materials and furrow irrigation methods on onion yield and water productivity under semi-arid conditions. Split plot design with three replications, in which the irrigation methods (Conventional, Fixed and Alternate Furrow) were assigned to the main plot and the three mulching materials (no mulch, wheat straw and white plastic mulch), were to the sub-plot. Results indicate that marketable onion bulb yield and water use efficiency were affected by the main effect of furrow irrigation methods and mulching materials (p< 0.05). But the interaction of irrigation methods and mulch had no significant effect on marketable onion bulb yield and water use efficiency. The conventional furrow irrigation (10081.52kg ha-1) and wheat straw mulch (12121.63 kg ha-1) resulted in the maximum marketable bulb yield. The highest water use efficiency (3.27 kg/m3) was obtained from alternate furrow irrigation method with straw mulch. This suggests that under limited irrigation water, alternate furrow irrigation along with wheat straw mulch minimize evaporation loss; maximize water productivity and sustain onion production at Amibara and similar agro-ecology and soil type.
Quantification of annual soil greenhouse gas emissions under different land u...ILRI
Prepared by Sheila Wachiye , Lutz Merbold, Timo Vesala, Janne Rinne, Matti Räsänen and Petri Pellikka for the General Assembly 2019 of the European Geosciences Union (EGU), Vienna, Austria, 7–12 April 2019.
2 ijhaf dec-2017-3-effect of biochar issued fromAI Publications
Cassava is an important food crop cultivated (75%) by smallholder farmers. However, yields are very low and rarely exceed 17tons/ha-1. A study was carried out at Nkolbisson in the humid forest zone (HFZ) of Cameroon to assess the effect of three types of biochar issued from Cassava (CSb), Ricehusk (RHb), and Corncob (CCb) on the root yield of variety 8034 cassava cultivated along a soil fertility gradient. The biochars were produced using an Elsa pyrolysis technology with carbonisation time of 50-58mins and temperature ranging from 400-6500C. Twelve 8m2 plots were constructed in three sites from the higher elevated, moderately elevated and flat fields.The biochars were applied at 20t.ha-1in three replicationsin a completely randomized design.Results showed that the biochars were high in nutrients containing 4.17-18.15g.kg-1 N, 22.26-42.51 mg.kg-1 P, 2.48-4.18 cmol.kg-1 K and pH (H2O: 7.78-10.81) and were significantly higher than the no-input soil containing 0.79g.kg-1 N, 7.41mg.kg-1 P, 1.42 cmol.kg-1 K and pH (5.68). Cassava root yield was significantly higher (P < 0.05) in RHb plots (23.22 t.ha-1) than CCb (20.53 t.ha-1), CSb (18.67 t.ha-1) and the no-input soil (16.13 t.ha-1). The addition of biochar particularly RHb, increasednutrient uptake in cassava leaves and roots compared with theno-input soil. The study concludes that biochars with higher N, Pand K content tend to increase cassava root yield and suggestsincreasing the quantity of biochar to 40t/ha-1or continuous application in combination with other farming options such as poultry manure, compost or mineral fertilizer tomaximize cassava productivity given the benefits of biochar.
Treatment Performance of Domestic Wastewater in a Tropical Constructed Wetlan...Oswar Mungkasa
prepared by Jonah S Butler* *Fulbright Scholar, DILG-GTZ Affiliate in Philippines: For Environmental Science Study on Wastewater Treatment. (Email: Jonahsbutler@gmail.com) for Urban Environments in Asia, 25-28 May 2011, Manila, Philippines. organized by International Water Association (IWA).
Impact of wastewater irrigation on major nutrient status in soil near Bhaluka...AbdullaAlAsif1
The population increase has not only increased the fresh water demand but also increased the volume of wastewater generated. Treated or recycled wastewater (RWW) appears to be the only water resource that is increasing as other sources are dwindling. Increasing need for water has resulted in the emergence of domestic wastewater application for agriculture and its relative use. The present study was conducted at the Department of Agricultural Chemistry, Bangladesh Agricultural University, Mymensingh during 2013 to evaluate the contribution of wastewater to major soil nutrients (N, P, K, S, Ca, Mg, B and Na) and fluctuation in physicochemical properties of soil (soil pH and Ec) from waste carrying canal at 10 selected sites of Bhaluka Upazila. Three (3) soil samples were collected at 0, 30 and 60 m distances from the waste discharging canals. The pH, EC, N, P, K, S, Ca, Mg, B and Na in soil samples decreased gradually with the increase of distance from waste discharging canal. Maximum concentrations of N at 60 and 0m distance varied from 8400 to 9700, P from 1850 to 5000, K from 4600 to 6000, S from 2000 to 4000, Ca from 7500 to 28800, Mg from 7500 to 7800, B from 90 to 2800 and Na from 2300 to 3100 μg g-1 in test soil.The results showed better nutrient status of the soil along waste discharge canals. The findings give applicable advice to commercial farmers and agricultural researchers for proper management and use of treated industrial wastewater for agricultural purpose.
Growth, gas exchanges and accumulation of inorganic matter of Populus nigra L...Innspub Net
Tunisia has made considerable efforts to solve major environmental problems. Reforestation of vast marginal
spaces with appropriate species, such as poplar, is one of the economic and environmental challenges (I-488). The fast-growingof this rupicolous species has a high specific versatility in its use. However, its need for water will limit their use in reforestation in areas where water resources are scarce. To cope with this situation, the use of unconventional water resources, including wastewater treatment, is a promising way to increase domestic
production of wood. Thus, the treated wastewater is valued as a source of unquestionable water, but also as a
source of nutrients. These plants were raised under non-binding for four months and divided into two lots
irrigated daily to field capacity with (i) potable water (control : T) and (ii) with treated waste water (TWW).
Biomass production, gas exchange and some mineral ions were measured during the experiment, in summer. Our results indicate that irrigation with treated wastewater has submitted a substantially marked effect resulting in an increase of gas exchange. Furthermore, after 60 days, the accumulation of certain metal ions (Cd, Pb and Ni) has resulted in a major malfunction on gas exchange.
performance evaluation and characterization of wetted soil parameters of impr...IJEAB
Field study was conducted to evaluate the emission uniformity (EU), global coefficient of variation (CGv), emitter flow variation (Qvar) and distribution uniformity (DU), and determine the wetted radius (rw) on soil surface of improvised medi-emitters installed in a tomato field. Soil water content (SWC) at four layers was determined after different periods of irrigation. Radius of wetted soil surface was determined and predicted. Irrigation frequency had no significant effect on the average discharge rate of the medi-emitters throughout the growing cycle. Average Qvar and CGv were significantly (P=0.05) influenced by the frequency of application while the EU and DU did not significantly (P=0.05) differ among the treatments. There were significant differences in the average values of SWC in different soil layers under the different periods of irrigation. Both the observed and calculated rw on the soil surface were fitted with fourth order polynomial. The model performance parameters of MAE and RMSE between the calculated and observed radii were low, indicating good prediction. Medical infusion set can successfully replace the more expensive conventional emitters for drip irrigation system.
Aptitude of Ground waters for Irrigation in the South-East Coastal Region of ...inventionjournals
Development of agricultural areas pressures on the availability of water resources in the South-East coastal region of Côte d'Ivoire (from Abidjan to Aboisso) require farmers to use groundwater for irrigation food and industrial crops. The objective of this study is to assess the aptitude of groundwater for irrigation in this region by using methods that take into account the Sodium Adsorption Report (SAR) and the Permeability Index (PI). The different results show that the SAR values range from 0.03 to 9.90 with an average of 1.83 while the PIs range from 5.11 to 210.77 with an average of 91.40. The C1S1 and C2S1 classes, corresponding to the water suitable for irrigation, represent 95% of the water sampled. In general, therefore, the sampled waters quality is suitable for irrigation except the boreholes waters of Memni (No. 59) and Palmafrique (No. 64).
Sugarcane and Tobacco growing in Uganda: impacts on soil and water systems – ...Dr. Joshua Zake
In this paper, I shared issues and insights for sustainable production of agro-commodities using sugarcane and tobacco in Uganda as a case. It was presented during the stakeholders dialogue & inception meeting on, ‘Support to communities and private sector to develop partnerships for sustainable management of natural resources, ecosystem services, chemicals and waste management, held in Gulu and Masindi.
The meeting was organized by Tree Talk Plus in collaboration with the ENR-CSO Network, Environmental Alert, Ministry of water & Environment and United Nations Development Program through the framework of the Inclusive Growth for Poverty Reduction Program.
Credit of peanut to subsequent wheat under desert farming conditions in prese...IJAEMSJORNAL
Rotation with leguminous crops to break non-legume monocultures has been established to benefit the latter. The lacking information on this cultivation system in stressed environments encouraged the implementation of two field trials in two different locations of Ismailia desert soils. The experimental design included the cultivation of wheat subsequent to peanut in presence of diazotroph inoculation and N fertilization. Bradyrhizobial inoculation of the legume in combination with 50 kg N acre-1 resulted in the highest total biological yields of 4.24 and 5.01 kg plot-1 at the experimental sites 1 and 2, respective seed yields of 1.46 and 1.61 kg pot-1 were recorded. In case of the cereal crop, the measured acetylene reducing activities in soils of associative diazotroph-inoculated plants together with 50 kg N acre-1 were the highest being 515.8-886.2 and 616.7-1066.2 nmoles C2H4 g-1 h-1 at locations 1 and 2 respectively. The enzymatic activity of fallow-cultivated wheat generally represented ca. 95 % of that in subsequent to peanut. Irrespective of inoculation and N fertilization, the wheat biomass yield increases in residual effect-field over the fallow one were 6.4-35.1 % and 4.6-38.5 % at experimental sites 1 and 2 respectively. Increase percentages of 3.1-26.6 and 6.9-44.7 were scored as well for grain yield. The beneficial residual effect of the legume to the succeeding cereal was also extended to protein yields, increases of 4.0-14.2 % and 4.5-7.6 % were estimated for grain protein as well as 8.3-24.1 % and 8.1-35.3 % for straw protein yield. The findings of this study proved that the positively yield turnover of a legume is extended to the subsequent non-legume. Besides, the beneficial residual effects of legumes toward rotated non legumes could be magnified by diazotroph inoculation together with adequate N supply particularly in stressed environments represented, in the present study, by Ismailia sandy soil.
Viability, method and device for horticultural crops with brackish and marine...Agriculture Journal IJOEAR
The method that humanity has adopted to hydrate and thus give life to the plants, imitating the model that was most visible, is the rain. However, the great secret to the contribution of nutrients to the vegetables, the irrigation itself, is on earth, in the groundwater layers and aquifers that hoard and administer the water, keeping every drop of rain and distributing the water through the basins, underground rivers, watering indirectly from the mountain to the sea. The key is in the different circulation velocities of the groundwater because of the nature of the substrates. However, agriculture has taken irrigation from above as we know it and has focused especially on drainage capacity. From this point of view, saline water is not beneficial for irrigated agriculture, but may be the only source of irrigation water in large arid regions, especially in developing countries, where the extreme scarcity of freshwater and the rapidly growing population require more water. When considering the possibility of watering with seawater without desalinating, always by means of capillarity systems, it is essential to take into consideration the different strata of soils, the distance to the groundwater, the composition of seawater, the capacity of drainage, chemical reactions of the soil with salts, etc. The modification of any of these parameters can produce effects of salinization, loss of humidity or desertification among others. This study presents the accumulated experience through the joint collaboration between the Centre for Research in Security and food Control of the Polytechnic University of Catalonia (CRESCA) and the Aqua Maris Foundation in capillary irrigation and it proposes a system and device that allows the controlled development of different vegetal species using brackish and seawater.
Similar to Does fertilization practices increase residual nitrate nitrogen in soil irrigated with treated wastewater? An experimental trial on maize (20)
Welcome to WIPAC Monthly the magazine brought to you by the LinkedIn Group Water Industry Process Automation & Control.
In this month's edition, along with this month's industry news to celebrate the 13 years since the group was created we have articles including
A case study of the used of Advanced Process Control at the Wastewater Treatment works at Lleida in Spain
A look back on an article on smart wastewater networks in order to see how the industry has measured up in the interim around the adoption of Digital Transformation in the Water Industry.
Hierarchical Digital Twin of a Naval Power SystemKerry Sado
A hierarchical digital twin of a Naval DC power system has been developed and experimentally verified. Similar to other state-of-the-art digital twins, this technology creates a digital replica of the physical system executed in real-time or faster, which can modify hardware controls. However, its advantage stems from distributing computational efforts by utilizing a hierarchical structure composed of lower-level digital twin blocks and a higher-level system digital twin. Each digital twin block is associated with a physical subsystem of the hardware and communicates with a singular system digital twin, which creates a system-level response. By extracting information from each level of the hierarchy, power system controls of the hardware were reconfigured autonomously. This hierarchical digital twin development offers several advantages over other digital twins, particularly in the field of naval power systems. The hierarchical structure allows for greater computational efficiency and scalability while the ability to autonomously reconfigure hardware controls offers increased flexibility and responsiveness. The hierarchical decomposition and models utilized were well aligned with the physical twin, as indicated by the maximum deviations between the developed digital twin hierarchy and the hardware.
Water scarcity is the lack of fresh water resources to meet the standard water demand. There are two type of water scarcity. One is physical. The other is economic water scarcity.
Sachpazis:Terzaghi Bearing Capacity Estimation in simple terms with Calculati...Dr.Costas Sachpazis
Terzaghi's soil bearing capacity theory, developed by Karl Terzaghi, is a fundamental principle in geotechnical engineering used to determine the bearing capacity of shallow foundations. This theory provides a method to calculate the ultimate bearing capacity of soil, which is the maximum load per unit area that the soil can support without undergoing shear failure. The Calculation HTML Code included.
Explore the innovative world of trenchless pipe repair with our comprehensive guide, "The Benefits and Techniques of Trenchless Pipe Repair." This document delves into the modern methods of repairing underground pipes without the need for extensive excavation, highlighting the numerous advantages and the latest techniques used in the industry.
Learn about the cost savings, reduced environmental impact, and minimal disruption associated with trenchless technology. Discover detailed explanations of popular techniques such as pipe bursting, cured-in-place pipe (CIPP) lining, and directional drilling. Understand how these methods can be applied to various types of infrastructure, from residential plumbing to large-scale municipal systems.
Ideal for homeowners, contractors, engineers, and anyone interested in modern plumbing solutions, this guide provides valuable insights into why trenchless pipe repair is becoming the preferred choice for pipe rehabilitation. Stay informed about the latest advancements and best practices in the field.
The Benefits and Techniques of Trenchless Pipe Repair.pdf
Does fertilization practices increase residual nitrate nitrogen in soil irrigated with treated wastewater? An experimental trial on maize
1. International Journal of Environment, Agriculture and Biotechnology (IJEAB) Vol-2, Issue-2, Mar-Apr- 2017
http://dx.doi.org/10.22161/ijeab/2.2.33 ISSN: 2456-1878
www.ijeab.com Page | 819
Does fertilization practices increase residual
nitrate nitrogen in soil irrigated with treated
wastewater? An experimental trial on maize
Mohamed Naceur Khelil1
, Seloua Rejeb1
, Jean Pierre Destain2
, Dimitri Xanthoulis3
1
Institut National de Recherche en Génie Rural Eaux te Fôrets, B.P 10, Ariana 2080, Tunisie.
2
Centre Wallon de Recherche Agronomique, Gembloux, Belgique
3
Unité Hydraulique, Gembloux Agro Bio Tech (Ulg)
Abstract— Treated wastewater has significantly
improved DM yield compared to ground water. The form
of nitrogen provided by the water was determinant in
drawing yields. Irrigation with ground water (where
nitrogen is as nitrate) induces a faster migration of
nitrogen at depth. In contrast, using treated wastewater
(where nitrogen is as ammonium), resulting in a relative
distribution of the remaining nitric smaller in the lower
profile and therefore higher in the surface, especially
after the second year (2010). In addition, the relative
distribution of nitrates in the soil surface is even more
important in the presence of organic manure. All happens
as if a certain amount of ammonium provided by treated
wastewater is retained in the organic compounds of
manure. Yields were significantly lower in irrigation with
treated wastewater in the second year and especially
when fertilization was given in additional. If the soil can
be used for storage of the nitrogen supplied by the treated
wastewater during the first year of irrigation (24 kg N-
NO3/ha before irrigation to 115 kg N-NO3/ha after
irrigation), to the second year the capacity drops (to 64
N-NO3/ha) and a significant increase in nitrate leaching
occurs. Therefore, unlike the contribution of manure that
seems enrich the topsoil nitrate nitrogen, at least during
the first campaign, mineral fertilization unreasoning
causes faster migration of nitrogen at depth.
Keywords—Treated wastewater, Fertilizer, Nitrate
leaching, Dry matter.
I. INTRODUCTION
In arid and semi-arid region, water has become
increasingly rare source which by its lack alters the socio
economic development. To preserve their fields and keep
constant production of their crops to continue living,
farmers are willing to use all types of water such as
treated wastewater (TWW). In Tunisia, this method is an
old (since 1960) and popular practice in agriculture.
Despite of this long experience, a great effort remains to
spend to convince farmers about fertilizers and economic
potential of this water and to raise farmers' awareness of
the drawbacks of poor use of these waters. Irrigation with
TWW has been used for three purposes: (i)
complementary treatment method for wastewater
(Bouwer and Chaney, 1974); (ii) use of marginal water as
an available water source for agriculture (Bouwer and
Idelovitch, 1987; Al-Jaloud et al., 1995; Tanji, 1997) – a
sector demanding ~ 83% of the consumptive water use in
Tunisia (iii) use of TWW as nutrient source (Bouwer and
Chaney, 1974; Vazquez-Montiel et al., 1996; Khelil et al.,
2011) associated with mineral fertilizer savings and high
crop yields (Smith and Peterson, 1982; Feigin et al., 1991;
Khelil et al., 2005).
In many studies worldwide the use of TWW as water and
nutrient sources in agricultural have been introduced as a
viable alternative for TWW destination in the
environment. However, various studies have revealed that
the nutrient supply only by TWW irrigation was not
sufficient to meet plant nutrient requirements resulting in
yield decreases. The problem could be solved by an
adapted effluent/fertilizer management (khelil et al., 2012;
da Fonseca et al., 2007a). Due to the often observed
accumulation of nitrogen losses (leaching, volatilization
and denitrification) after TWW irrigation, the monitoring
of these components is of crucial importance for a
sustainable use. According to Rafael Marques Pereira
Leal and al. (2009), throughout the irrigation period, high
NO3-N concentrations (up to 388 mg/ l with treatment
receiving 200% of crop water demand) was measured in
soil solution below the root zone, indicating the potential
of groundwater contamination. Nitrogen (N) cycling in
agro-systems can also be altered by TWW irrigation,
mainly in the long-term (da Fonseca et al., 2007a).
Several studies have shown increased total carbon (TC)
and total nitrogen (TN) contents in the soil due to C and N
input by TWW irrigation (Friedel et al., 2000; Ramirez-
Fuentes et al., 2002). Other studies have found decreased
contents of soil TC and TN (Speir et al., 1999; Snow et
al., 1999), mainly attributed to enhanced mineralization
2. International Journal of Environment, Agriculture and Biotechnology (IJEAB) Vol-2, Issue-2, Mar-Apr- 2017
http://dx.doi.org/10.22161/ijeab/2.2.33 ISSN: 2456-1878
www.ijeab.com Page | 820
and nitrification processes under effluent irrigation (da
Fonseca et al., 2007b ). Of greater concern, increasing
concentrations of nitrate (NO3-N) in soil solution due to
TWW irrigation have often been reported (Polglase et al.,
1995; Smith and Bond, 1999; Gwenzi and Munondo,
2008), representing one of the main challenges for the
sustainable land application of effluents (Bond, 1998; da
Fonseca et al., 2007a).
Otherwise, the soil-plant system, if adequately managed,
encourages retention of TWW components mainly due to
the incorporation of elements in the dry matter (DM) of
plants (Bouwer and Chaney, 1974; Vaisman et al., 1981),
leading to decreasing element concentrations in ground
and surface waters (Feigin et al., 1978). Harvest and
removal of plant material withdraw the accumulated
elements, which further contribute to prevent leaching of
elements, mainly nitrogen (N) and enrichments in the
subsoil solution and the groundwater concentrations
(Quin and Forsythe, 1978; Hook, 1981). Although
irrigation with TWW may mitigate the damage and
utilization of natural water resources and enables the
diversion of nutrients from TWW and save the
conventional inorganic and organic fertilizers including
nitrogen fertilizers, it may result in risks that need to be
considered in more detail, especially since farmers do not
conceive reducing their fertilizer supply. With this in
mind, a study of experimental was conducted at the
Agricultural Experimentation Unit – Nabeul-Tunisia to
study the impact of the different fertilizations practices
adopted by farmers on maize yield and on nitrate status of
the ground after harvest and to serve as farmer’s
awareness to convince them to reduce their contribution
in terms of fertilizers, including irrigation with treated
wastewater.
II. MATERIALS AND METHODS
This field study was conducted during the summer in
2009 and 2010, as part of a larger study in bilateral
collaboration between the Agronomic research Center,
(CRAg) Gembloux ABT(ULg) from Belgium and the
Rural, Water and forest research Institute “INRGREF” of
Tunisia. The field had been for maize in summer and
vegetables in winter for three years prior 2009. Some
physical and chemical properties of the experimental soil
determined before sowing are presented in Table 1.
Table.1: Physicochemical and moisture characteristics of
the soil
Paramètres
Soil depth
( Cm)
0 /20 20/40 40/60 60/80
80/
100
%
Coarse silt 5 5 5 -
Fine sand 29 24 30 -
Coarse sand 64 68 64 - -
Conductivity
ds.m-1
25° C
2.01 1.87 1.98 - -
% Organic
matter
0.4 0.3 0.2 - -
% Total
nitrogen
0.087 0.066 0.045 - -
% Carbon 0.3 0.2 0.1 - -
C/N 3.4 3.0 2.2 - -
Humidity at
pF 4.2
2.88 1.97 1.28 1.10 1.10
Humidity at
pF 2.7
8.68 6.76 4.43 2.77 2.72
weight
Density (da)
1.35 1.35 1.35 1.35 1.35
Ru (mm) 15.66 12.93 8.50 4.51 4.37
pF 4.2 corresponds to moisture at the point of wilting. 2.7
pF corresponds to moisture at field capacity. da, bulk
density. Ru, reserves calculated in mm per layer (20 cm x
2 = da (Humidity in pF2.7 - humidity at pF 4.2)
These analyzes show that the soil is sandy type of low
organic matter, with a C/N ratio, lower than 10. Moisture
content expressed as% at pF 2.7 and pF 4.2 by 20 cm
layer to a depth of 100 cm, were used to calculate the
usable water reserves (Ru) for the soil (Table 1). From
Table above, the Ru soil decreases with depth for both pF,
indicating a low water-holding capacity of about 45mm
on 1m soil depth. The use of a sheet of water over Ru,
leads to a loss of water and solute by the system and
automatically contributes to groundwater pollution.
The experimental protocol was designed to use
fertilization practices used by farmers. The treatment
comprised: (i) two irrigation water qualities, treated
wastewater (TWW) and well water (WW), and (ii) four
practices fertilization taken as treatments for each kind of
water : (1) treatment without fertilizer (0N), (2) treatment
with application of 120kgN/ha as ammonium nitrate,
brought in two equivalent fractions, at raising and at
elongation stage, (3) a treatment that corresponds to the
application of 20t/ha of cow manure and (4) a treatment
which represents the joint application of manure and
3. International Journal of Environment, Agriculture and Biotechnology (IJEAB) Vol-2, Issue-2, Mar-Apr- 2017
http://dx.doi.org/10.22161/ijeab/2.2.33 ISSN: 2456-1878
www.ijeab.com Page | 821
mineral fertilizer (120kg N/ha + 20t/ha of manure). The
experiment was organized in a randomized complete
block design with four replications. Each treatment block
was 2.25m by 4.2 m. TWW used in this study come from
the wastewater treatment plant SE4 and WW used was a
mixture of shallow wells on the experimental station.
Water samples were collected ones a week in wells and
outlet valves distribution of wastewater. The main
characteristics of the two types of water are shown in the
following table (Table 2).
Table.2: Characteristics of irrigation water
Parameters
Well water
(WW)
Treated wastewater
(TWW)
mg/l
NO3- 129 (±19.2) < 5
N-NH4 2.36 (±0.26) 36 (±07.68)
HCO3- 219 (± 25.6) 344,94 (±37.24)
SO4-- 487 (± 131.5) 426,51 (±148.6)
Cl- 729.2 (± 50) 548,57 (±55.14)
Ca++ 238.8 (±13.6) 126,79 (±17.12)
Mg++ 90 (± 6) 90,00 (±07.45)
P - 5.37 (±01.99)
K+
60.45 (±
13.6)
31,64 (±03.40)
Na+
579.4 (±
40.7)
408,94 (±176.4)
pH
7.29 (±
0.14)
7,15 (±0.14)
Sels dissous
(g/l)
2.86 (±
0.21)
2,17 (±0.26)
SAR
8.10 (±
0.66)
8,00 (±0.94)
Cd - 0,009 (±0.01)
Co - -
Cr - -
Cu - -
Fe - 0,005 (±0.02)
Mn - 0,003 (±0.01)
Ni - 0,006 (±0.005)
Pb - 0,030 (±0.014)
Zn - 0,009 (±0.005)
The TWW is rich in potassium and in nitrogen and poor
in phosphor and nitrate and have salinity comparable to
that of the WW. The concentration of heavy metals in
TWW is below Tunisian standard (NT 106.03) on the use
of TWW in agriculture. The N composition of TWW
ranged from 28 to 51 mg N-NH4/l, with an average of 36
mg N-NH4/l and contained less than 2 mg/l of NO3
-
.
However, WW were loaded with nitrate with an average
of 25 mg N-NO3
-
and accounted less than 2 mg/l of
nitrogen as ammonium. Mineral composition of manure is
comparable in 2009 and 2010 but with a lower
phosphorus content in 2010 (Table 3).
Table.3: Chemical characteristics of manure
Parameters
Manure
2009
Manure
2010
(%)
Total nitrogen 0.707 0.779
Ammoniacal
nitrogen
0.004 0.001
Organic
nitrogen
0.703 0.778
Dry matter 53.25 32.18
Carbon 55.34 55.26
P 0.741 0.375
K 1.782 1.900
Ca 5.086 4.248
Mg 0.505 0.419
C/N 78.15 70.93
N composition was in the order of 0.7% which
corresponds to a contribution of 140 kg N/ha. Manure is
rich in calcium but low in magnesium with a C/N ratio of
about 75.
Due to the sandy nature of the soil, a pre-irrigation was
performed in order to fix the soil and to ensure optimum
germination and emergence. Feed maize (zea mays) was
planted on monthly statement on Mai in 0.65 m row
spacing and with a spacing of 0.2 m within the row, with
two seeds per hill. Plant was thinned before fertilization to
keep one foot per hill shortly after emergence. Each
repetition consisted of four lines representing 80 feet of
Maize. Manure was spread and incorporated into the soil
two weeks before planting, while nitrogen fertilizer was
applied online at equal fraction at 3-leaf stage and at
elongating stage.
Water irrigation levels were designed to approximate the
seasonal evapotranspiration (ETP) minus precipitation
deficit, according to the following formula “Water
requirement = Kc x ETP – effective rainfall – R”, where
R is the stock of the soil moisture at planting time,
assumed equal to zero. Water requirement was calculated
on the basis of the average climatic parameters of the
experimental station (ETP), calculated by the Penman-
Monteith formula on 12-year period (1997/2008) and on
the bases of crop coefficients (Kc ) at various vegetative
stages of maize, mentioned in Richard et al (1998). The
crop ETP requirement was 750mm from mid Mai to mid
September under local conditions. According to Rebour
and Deloye (1971), water use efficiency was estimated at
95% for drip irrigation, so that an additional of 5% (equal
to 27 mm) excess water was applied to meet 100% water
use efficiency. A total of 19 irrigations were made in
4. International Journal of Environment, Agriculture and Biotechnology (IJEAB) Vol-2, Issue-2, Mar-Apr- 2017
http://dx.doi.org/10.22161/ijeab/2.2.33 ISSN: 2456-1878
www.ijeab.com Page | 822
2009 and 2010. Overall, the crop received a total amount
of about 544 mm (5440 m3
/ha) for each year and for each
kind of water (Table 4).
Table.4: Water requirement of maize and irrigation
scheduling
Parameter
Months from May to
September
Tota
l
(mm
)
M J J A S
ETP
(mm /Mois)
13
4
155 182 163
11
6
750
Kc 0.5
0.6
5
1.0
8
0.9 0.6 -
Besoin/Mois
(mm)
67 100 197 147 70 581
number of
irrigation
1 4 7 6 1 19
Rate/irrigatio
n
24
27.
4
31.
4
27.
4
25 -
Rate/month
(mm)
24 110 220 165 25 544
Before sowing, a characterization of the content of nitric
nitrogen in soil was performed. Then, after each campaign
a soil sample is taken to determine the residual nitrate
nitrogen. Only one plant sampling was carried out at pasty
milky stage in 2009. While in 2010, to follow the dilution
of nitrogen in the dry matter “DM” (N% DM), four
sampling during the vegetative cycle were performed. The
fourth sampling coincided with the pasty milky stage. All
samples were made on the above ground part of ten corn
feet taken on a surface of 1m². All plant portions were
dried at 70°C, and weights were recorded. Soil sampling
concerned a profile probed by 80 cm layer of 20 cm.
Three carrots repetition were performed. For each depth,
the three samples were mixed and an average sample
depth was analyzed. Analyzes are concerned mainly
nitrogen, either in the soil or in the plant. Mineral nitrogen
in the soil was determined on the filtrate after extraction
with KCl (0.5 M) with a dilution of 1/5, the nitrate
analysis was performed at CRA-W by colorimetry using a
continuous flow system. The principle is to reduce the
nitrate by hydrogen sulphate then to cause the Griess
reaction on the nitrite formed to give a purple compound.
The plant tissue was ground and analyzed for total N
using kjeldhal digestion method according to Bremner
and Mulvaney (1982).
III. RESULTS AND DISCUSSION
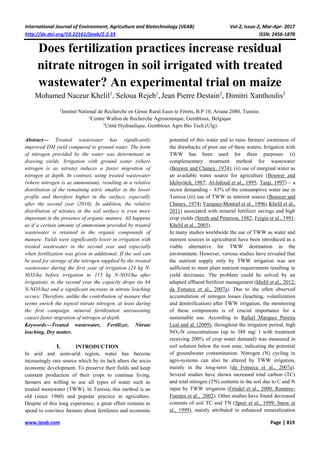
3.1 Dry matter yield production
Irrigation with treated wastewater has greatly improved
the production of DM especially in 2009 despite the
significant amount of nitrate nitrogen provided by WW
(Fig 1).
Fig.1: Effect of the kind of water and of fertilizer practices on the DM yield of feed maize.
R² = 0.8687
R² = 0.8303
0
2
4
6
8
10
12
14
16
0 5 10 15
drymatteryield(t/ha)
Treatment
Treated wastewater
2009
2010
Poly. (2009)
Poly. (2010)
0N 120 kgN/ha 20 t/ha manure 120 kg+20t/ha
manure
R² = 0.8687
R² = 0.8168
0
2
4
6
8
10
12
14
16
0 5 10 15
drymatteryield(t/ha)
Treatment
Maize 2009
TWW
WW
Poly. (TWW)
Poly. (WW)
0N 120 kgN/ha 20 t/ha manure 120 kg+20t/ha
manure
R² = 0.8393
R² = 0.7665
0
2
4
6
8
10
12
14
16
0 5 10 15
drymatteryield(t/ha)
Treatment
Maize 2010
TWW
WW
Poly. (TWW)
Poly. (WW)
0N 120 kgN/ha 20 t/ha manure 20 kg+20t/ha
manure
R² = 0.8168
R² = 0.7436
0
2
4
6
8
10
12
14
16
0 5 10 15
drymatteryield(t/ha)
Treatment
Well water
2009
2010
Poly. (2009)
Poly. (2010)
0N 120 kgN/ha 20 t/ha manure 20 kg+20t/ha
manure
R² = 0.8687
R² = 0.8303
0
2
4
6
8
10
12
14
16
0 5 10 15
drymatteryield(t/ha)
Treatment
Treated wastewater
2009
2010
Poly. (2009)
Poly. (2010)
0N 120 kgN/ha 20 t/ha manure 120 kg+20t/ha
manure
R² = 0.8687
R² = 0.8168
0
2
4
6
8
10
12
14
16
0 5 10 15
drymatteryield(t/ha)
Treatment
Maize 2009
TWW
WW
Poly. (TWW)
Poly. (WW)
0N 120 kgN/ha 20 t/ha manure 120 kg+20t/ha
manure
R² = 0.8393
R² = 0.7665
0
2
4
6
8
10
12
14
16
0 5 10 15
drymatteryield(t/ha)
Treatment
Maize 2010
TWW
WW
Poly. (TWW)
Poly. (WW)
0N 120 kgN/ha 20 t/ha manure 20 kg+20t/ha
manure
R² = 0.8168
R² = 0.7436
0
2
4
6
8
10
12
14
16
0 5 10 15
drymatteryield(t/ha)
Treatment
Well water
2009
2010
Poly. (2009)
Poly. (2010)
0N 120 kgN/ha 20 t/ha manure 20 kg+20t/ha
manure
5. International Journal of Environment, Agriculture and Biotechnology (IJEAB) Vol-2, Issue-2, Mar-Apr- 2017
http://dx.doi.org/10.22161/ijeab/2.2.33 ISSN: 2456-1878
www.ijeab.com Page | 823
This improvement would explained either by the wealth
of treated wastewater with other nutrients such as P, Ca,
Mg, or also by the low efficiency of the nitrate nitrogen
provided by TW throughout the vegetative cycle and even
at times when the plant absorbs less. The nitrate nitrogen
is also exposed to leaching, especially at the beginning
and at the end the vegetative cycle. Vazquez-Montiel
(1996) on maize, noted an increase in yield and N content
(% N) and phosphorus (P%) in irrigation with TWW
compared to WW. Moreover, the comparison between the
two years shows that the yield response to different
fertilization practices was more significant in 2009 than in
2010. It seems that the memory effect of previous
contributions (in 2009 and even before planting) is
produced on corn in 2010. In the WW treatment, the DM
production was similar for both years. Whereas, we note a
decrease in DM production in 2010 when TWW was used
for irrigation, notably when a supplemental fertilization
was added.
3.2 Effect of the treatments on the dilution of N in
aboveground biomass during maize growth
The dilution curves of N in the aboveground biomass
during maize growth in 2010 (Fig 2), were compared to
the reference curve used for non-limiting nitrogen
nutrition for grasses (Lemaire and Salette, 1984).
Fig.2: Dilution curve of nitrogen (N%) in the dry matter production (DM) depending on water qualities and fertilization
practices
Regardless of treatment, nitrogen dilution in the DM
during the growth cycle decrease with increasing dry
matter production. The following mathematical
relationship has been applied to our results:
α = N% (DM) -β
1
In the absence of fertilizer, the dilution curve is below the
reference curve and shows that nitrogen nutrition was
significantly better with TWW compared to WW
treatment (Fig 2A). By cons, when nitrogen fertilizer was
added, N nutrition is rather better with WW irrigation.
(Fig 2B), it even exceeds the reference curve in WW
irrigation when manure (20 t/ha) was spread (Fig 2C),
indicating a good nitrogen nutrition notably at final
harvest. The difference between the two treatments WW
and TWW is probably due to growth retardation observed
on TWW plots. Independent on water irrigation quality,
mineral fertilization improves nitrogen nutrition even in
the presence of manure. However, improved nitrogen
nutrition of maize was not followed by a significant
increase in the DM production due to the luxury
0
2
4
6
0 5 10
N%(DM)
DM(t/ha)
Manure supply (20t/ha)
C WW
TWW
Power
(referencecurve)
0
2
4
6
0 5 10
N%(DM)
DM(t/ha)
Fertilizer supply and manure
D
WW
TWW
Power(reference
curve)
0
2
4
6
0 5 10
N%(DM)
DM (t/ha)
without fertilizer (0N)
A WW
TWW
Power
(referencecurve)
0
2
4
6
0 5 10
N%(DM)
DM (t/ha)
Fertilizer supply(120kgN/ha)
B
WW
TWW
6. International Journal of Environment, Agriculture and Biotechnology (IJEAB) Vol-2, Issue-2, Mar-Apr- 2017
http://dx.doi.org/10.22161/ijeab/2.2.33 ISSN: 2456-1878
www.ijeab.com Page | 824
consumption of nitrogen especially on the plots irrigated
with TWW. We assume therefore that irrigation with
TWW with higher N content in addition to fertilizer input,
leads to promote a situation of excess nitrogen resulting in
a depressive effect on nitrogen nutrition and on DM
production. All these observations support the thesis
already advanced by Salette and Lemaire (1981) on the
existence of a more or less closely relationship between
the accumulation of nitrogen in shoots and their dry
matter growth.
3.3 Effect of treatments on the relationship between
dry matter produced and nitrogen uptake
The relationship between DM and N exported has been
demonstrated for stands of grasses by Salette and Lemaire
(1981). It can result in the following mathematical
relationship:
N uptake = 10 α (DM) 1-β
2
This is in fact an allometric relationship between nitrogen
uptake and DM production. The coefficient
(1 - β) is the ratio of the relative rates of N uptake and
relative growth rates, the coefficient 10α represents the
amount of nitrogen absorbed for the production of the
first tone of DM. However, although this relationship is
much talking in terms of agronomic, since it describes the
relationship between growth and nitrogen uptake. The
comparison of the different relationships between them
arises under Lemaire et al. (1985) a statistical problem not
satisfactorily solved theoretically. In our work, we used
the method Dagnelie (1969), cited by Lemaire et al.
(1985), which is based on the determination of the
confidence interval of the orthogonal regression
coefficient. We have used this method to compare the
values of the allometric coefficient (1 - β) and the
coefficient values 10α. Though, the values used to
calculate the regressions curves are the average of four
samples which were used for determining the DM yield
and N content.
Fig.3: Relationship between allometric growth of DM and nitrogen uptake in maize (2010)
R² = 0.9516
R² = 0.8795
R² = 0.9356
R² = 0.8837
0
20
40
60
80
100
120
140
160
180
200
0 5 10 15
Nuptake(kg/ha)
DM production (t/ha)
D
TWW 0
all TWW treatments
WW 0
all WW treatments
R² = 0.9356
R² = 0.9516
0
20
40
60
80
100
120
140
160
180
200
0 5 10 15
Nuptake(kg/ha)
DM production (t/ha)
A
WW 0
TWW 0
R² = 0.9356
R² = 0.9304
R² = 0.9507
R² = 0.9368
0
20
40
60
80
100
120
140
160
180
200
0 5 10 15
Nuptake(kg/ha)
DM production (t/ha)
B
WW 0N
WW N
WW M
WW MN
R² = 0.9516
R² = 0.9304
R² = 0.8478
R² = 0.9524
0
20
40
60
80
100
120
140
160
180
200
0 5 10 15
Nuptake(kg/ha)
DM production (t/ha)
C
TWW 0N
TWW N
TWW M
TWW MN
7. International Journal of Environment, Agriculture and Biotechnology (IJEAB) Vol-2, Issue-2, Mar-Apr- 2017
http://dx.doi.org/10.22161/ijeab/2.2.33 ISSN: 2456-1878
www.ijeab.com Page | 825
For our work, the values were between 0.3 and 0.4% N
for the WW and between 0.1 and 0.3% N for TWW. This
precision corresponds to a variation of the coefficient 10α
of about 3 to 4 kgN/ha and 1 to 3 kgN/ha for the well and
the treated wastewater, respectively. In the absence of
fertilization, irrigation with treated wastewater
significantly increases the nitrogen and the DM
production. However, when well water is used for
irrigation we note a deflection of the allometric
relationship reflecting a slowing of nitrogen uptake
followed by DM production stagnation despite continuing
input of N by these waters. This slowdown is probably
linked to the nitric form of nitrogen supplied by well
water that is relatively labile and more exposed to
leaching than ammonium provided by TWW. Otherwise,
in TWW irrigation, no effect of fertilizer used on the
relationship between the dry matter produced / nitrogen
input was observed (Fig 3). However, when manure and
nitrogen fertilizer was applied together, we note a slight
improvement in the absorption of N at the end of growth,
represented by an accumulation of 15 kgN without being
translated into DM. This excess nitrogen consumption at
the end of culture could be the result of the mineralization
of nitrogen from manure or also from soil under the action
of microbial biomass. Unlike irrigation by TWW; a
significant effect of fertilizing practices on nitrogen
absorption and on the production of DM was recorded
when WW was used for irrigation (Fig 3). This significant
effect is all the more important as the total dose of N
added is significant. Comparing the coefficients 10α and
(1-β) at the same level of growth, shows that the lowest
nitrogen uptake was recorded with WW0 treatment (Table
5) with the absorption of 23 kgN/ha for the production of
the first ton of MS against 26-39 kg N/ha for the rest of
the treatments. This difference is dependent on the
treatment and is related to the amount of available
nitrogen in the soil with treated wastewater irrigation.
Comparing the value of 10α we note that in irrigation
with TWW, the value of 10α is the highest for the
treatment with mineral fertilizer input split. Whereas, 10α
value is significantly lower with manure. This could be
explained by the organization of a certain amount of
ammonia nitrogen supplied by TWW rendered
inaccessible to the plant, especially since the value of the
manure C/N ratio is well over 20. However, in irrigation
with WW, the difference between the values of 10α for all
treatments with fertilization does not exceed 4 kg/ha. It
should also be noted that, at the end of growth, and
particularly with treatments with an addition of 120 kg
N/ha, a curve decline reflects a more marked slowdown in
nitrogen withdrawals at the end of growth, which is
explained by a more low coefficient value (1-β) (Table 5).
This slowing of the absorption of N at the end of growth
coincides with the depletion of the nitrogen reserves in
the soil just after a phase of acceleration of N absorption
following the applications of mineral fertilizer
(ammonitrate). For the rest of the treatments, including
control treatments, the value of (1-β) is similar, indicating
a consistency in the nitrogen absorption during the
vegetative cycle and also a constant supply of N by the
environment.
Table.5: Comparison of the coefficients 10 α and 1-β of
the relation Nexp = 10α (DM) 1-β
The highest allometry coefficient (0.81) corresponds to
the treatment receiving the highest total dose of N (450
kgN/ha), shows that the N content in the plant decreases
little during growth, from 1.99 at the beginning growth at
1.46 at the end of growth. This coefficient would be a
sign of luxury consumption of N and probably of growth
retardation.
3.4 Effect of treatments on nitrate nitrogen in the soil
The profile before sowing was poor with nitrate nitrogen
content of 15kgN-NO3/ha at surface and practically
nothing beyond 40cm depth (Fig 4). Only irrigation,
without any addition of fertilizer, modifies and in the
same way as well with the TWW and WW the nitric
profile. About 40 kgN-NO3/ha was found on the soil
Traitement
s
10
α
1-β R²
confidenc
e interval
of (1-β)
P = 5%
TWW-0N 27
0.7
6
0.99
0
0.03
TWW-
120N
39
0.5
3
0.68
9
0.02
TWW-20t
Fumier/ha
26
0.7
3
0.87
0
0.12
TWW-
120N+20t
Fumier/ha
25
0.8
1
0.91
5
0.16
WW-0N 23
0.7
5
0.99
2
0.03
WW-120N 33
0.6
3
0.90
9
0.08
WW-20t
Fumier/ha
35
0.7
7
0.97
6
0.01
WW-
120N+20t
Fumier/ha
31
0.7
4
0.99
4
0.02
8. International Journal of Environment, Agriculture and Biotechnology (IJEAB) Vol-2, Issue-2, Mar-Apr- 2017
http://dx.doi.org/10.22161/ijeab/2.2.33 ISSN: 2456-1878
www.ijeab.com Page | 826
surface but also at depth after harvest (Fig 4), highlighting
a deep migration of nitrate. Hence the lack of effect of the
nitrogen form (NO-
3 vs NH+
4) provided by the two types
of water on the nitric profile in the soil. It is often
reported in the literature that ammonium ions contributed
by the TWW is rapidly oxidized to nitrate after irrigation
(Speir et al, 1999). This conversion is actually favored by
the sandy nature of our soil, the irrigation technique that
prevents water logging of the soil and also by climatic
conditions, ie high temperature, 30-35 ° C (Marot-Gaudry
., 1997). This rapid conversion of ammonium to nitrate,
often leads to an accumulation of nitrate ions in the soil
(Page et al, 1998). Similarly, Vazquez-Montiel et al.
(1996) reported that the concentration of ammonium in
soils irrigated with treated wastewater is generally low.
Berdai et al. (1998) find that the maximum levels of
ammonia nitrogen are achieved at 48 hours after
irrigation. After 48 hours, the nitric and ammonia nitrogen
content decreases due to losses through gaseous channels,
leaching and absorption by the plan
The addition of 120kgN/ha results in an enrichment of the
soil profile with nitrate more important on the surface of
the soil and with the TWW irrigation. This enrichment is,
on the one hand, the result of an intense microbial activity
in the rhizosphere and, on the other hand, the product of
an acceleration of the nitrification of the organic nitrogen
in the soil under the effect of nitrogen fertilizer. Recently,
Belligno et al. (2000), by incubating soil in the presence
of treated wastewater and clear water plus the same
amount of N, find that the amount of nitric nitrogen in the
soil is higher in irrigation with treated wastewater.
Fig.4: Nitrate remaining in the soil after the first harvest in 2009
The same authors suggest that the addition of nitrogen
fertilizer in irrigation with treated wastewater accelerates
nitrification in the soil. Papadopoulos and Styliano
(1988), using a treated wastewater with 30 mg N/l and
receiving 60 mg N/l as ammonium nitrate fertilizer and a
well water with the same total amount of N (90 mg/l),
find that nitrate migration below the root zone is higher in
the treatment with treated wastewater. Nashikkar (1993)
showed that the organic matter load explained by the high
value of the BOD can also accelerate the conversion of
NH4 to NO3 due to the anoxic conditions that it favors.
The retention of nitrate nitrogen in the upper zone of the
soil when TWW is used for irrigation reflects the intensity
of microbial activity in this part of the ground. However,
in the absence of uptake by crops, this nitrogen will
migrate into the water table with the first autumn rainfall.
In irrigation with well water the addition of 120 N slightly
increases the amount of nitrate in the soil profile
compared to the control "WW-0N" while keeping the
same aspect of the profile. This flat profile indicates that a
large amount of N is lost only by nitrate leaching. This
loss in fact explains the absence of the response of the
DM yields to nitrogenous fertilizers.
.
-90
-80
-70
-60
-50
-40
-30
-20
-10
0
0 50 100 150
Depth(cm)
kg N-NO3/ha
Zero N
before
Maize 2009
Well water
Treated
wastewater
-90
-80
-70
-60
-50
-40
-30
-20
-10
0
0 50 100 150
Depth(cm)
kg N-NO3/ha
20 t/ha Manure
Before
Maize 2009
Well water
Treated
wastewater
-90
-80
-70
-60
-50
-40
-30
-20
-10
0
0 50 100 150
Depth(cm)
kg N-NO3/ha
20 t/ha Manure + 120
kgN/ha
Before
Maize 2009
Well water
Treated
wastewater
-90
-80
-70
-60
-50
-40
-30
-20
-10
0
0 30 60 90 120 150
Depth(cm)
kg N-NO3 /ha
before
planting 2009
Well water
Treated
wastewater
120 kgN/ha
9. International Journal of Environment, Agriculture and Biotechnology (IJEAB) Vol-2, Issue-2, Mar-Apr- 2017
http://dx.doi.org/10.22161/ijeab/2.2.33 ISSN: 2456-1878
www.ijeab.com Page | 827
Fig.5: comparison of residual nitrate nitrogen in the soil after harvest in 2009 and 2010
Moreover, in the presence of manure we note an
accumulation of nitrates in the upper part of the soil. This
nitrogen has two origins, depending on the type of water
used. In WW irrigation, these nitrates certainly come from
irrigation water. Thus, in this case, the manure has to help
to retain this nitrogen and prevent it from going to the
water table, at least temporarily before covering the soil
with a nitrate trap crop (NTC). However, in TWW
irrigation, the residual nitrogen was greater than in WW
irrigation, this may be the result of significant
mineralization of manure organic matter due to high
microbial activity sustained by the supply of a
carbonaceous substrate by the treated wastewater (HCO3
= 345 mg/l). The comparison of the nitrate profile
between control and manure treatments supports this
hypothesis. In fact, in irrigation with WW the nitric
profile is similar for the control and the treatment with
manure. While in TWW irrigation, the nitric profile is
more enriched in the presence of manure. Only in the
presence of fertilizer and manure that an enrichment of
the nitric nitrogen profile has been noticed especially on
the soil surface in WW irrigation,. This significant
increase in nitrate nitrogen at the soil surface is probably
the result of active mineralization of the organic matter of
the manure under the effect of the mineral fertilizer. By
cons, On the other hand, in irrigation with TWW, the
nitric profile is generally more enriched in nitric nitrogen
than in irrigation with WW. The comparison of the nitric
profile between the two years shows that, in general, the
shape of the nitric profiles was practically similar between
the two campaigns (fig 5). However, the profile appears
to be less loaded with nitric nitrogen after the second
season (2010). It is therefore assumed that the nitrogen
retention and its storage in the soil are achieved with the
high total nitrogen dose brought in 2009, especially in
TWW irrigation with manure and fertilizer. Jordan et al.
(1997) reported that if the soil can be used for storage of
nitrogen contributed by TWW during the first year of
irrigation (of 1-46 micromol/l before irrigation to 30-71
mmol/l after irrigation), in the second year retention
capacity decreases and a significant increase in nitrate
leaching occurs. This leaching can be minimized by using
plant species that could effectively remove nitrogen from
the soil as forage crops (Gant et al, 1982; FAO, 2003). In
-80
-60
-40
-20
0
0 30 60 90 120 150
Depth(cm)
N-NO3 (kg/ha)
WW -0N
before
planting
2009
after
cutting
2009
after
cutting
2010 -80
-60
-40
-20
0
0 30 60 90 120 150
Depth(cm)
N-NO3 (kg/ha)
WW-120N
before
planting
2009
after
cutting
2009
after
cutting
2010 -80
-60
-40
-20
0
0 30 60 90 120 150
Depth(cm)
N-NO3 (kg/ha)
WW- M
before
planting
2009
after
cutting
2009
after
cutting
2010
-80
-60
-40
-20
0
0 30 60 90 120 150
Depth(cm)
N-NO3 (kg/ha)
WW- MN
before
planting
2009
after
cutting
2009
after
cutting
2010
-80
-60
-40
-20
0
0 30 60 90 120 150
Depth(cm)
N-NO3 (kg/ha)
TWW- 0N
before
planting
2009
after
cutting
2009
after
cutting
2010
-80
-60
-40
-20
0
0 30 60 90 120 150
Depth(cm)
N-NO3 (kg/ha)
TWW-120N
before
planting
2009
after
cutting
2009
after
cutting
2010
-80
-60
-40
-20
0
0 30 60 90 120 150Depth(cm)
N-N03 (kg/ha)
TWW- M
before
planting
2009
after
cutting
2009
after
cutting
2010
-80
-60
-40
-20
0
0 30 60 90 120 150
Depth(cm)
N-NO3 (kg/ha)
TWW- MN
before
planting
2009
after
cutting
2009
after
cutting
2010
10. International Journal of Environment, Agriculture and Biotechnology (IJEAB) Vol-2, Issue-2, Mar-Apr- 2017
http://dx.doi.org/10.22161/ijeab/2.2.33 ISSN: 2456-1878
www.ijeab.com Page | 828
irrigation with WW loaded with nitrate, the situation is
different. Residual nitric nitrogen at the end of cultivation
is practically low and does not vary between the two years
especially for the treatment zero N but it increases with
the total N added. This in turn increases leaching losses of
nitrates, especially in the presence of manure and nitrogen
fertilizer. Hook and Burton (1979) suggest using crops
that can undergo several cuts to reduce leaching.
IV. CONCLUSION
Irrigation with treated wastewater has significantly
improved the DM production and maize grain yield
compared to well water despite the richness of well water
by nitrate nitrogen. We believe that the form of nitrogen
contributed by water played a decisive role in the
development of yields. In contrast to ammonium provided
by treated wastewater, that can be fixed on the clay-
humus complex of the soil and it's released slowly
according to culture needs; the nitrates are mobile enough
and because they are provided throughout the vegetative
cycle by the well water, are rather exposed to losses by
leaching. The observation of nitric profile end of the
culture supports this hypothesis. Irrigation with WW,
where nitrogen is mainly nitric form, causes a rapid
migration of nitrogen to the soil depth. However,
irrigation with TWW, where nitrogen is mainly
ammoniacal, results in a lower nitrate distribution in the
soil depth and greater in the soil surface, notably in 2010.
These yield differences between the two types of water
are probably the result of the higher fertilizer value (P, K,
Ca, Mg and S) in the treated wastewater.
If the yields were stable in the two years in irrigation with
WW, a drop in yields with TWW irrigation and especially
with supplementary fertilization was noticed. Indeed, the
TWW and fertilizer contributions seem to favor a
situation of excess N which has led to a depressing effect
on yields. However, according to other studies (Khelil et
al., 2005), a reasoned starter fertilizer taking into account
the N content in water and soil could be recommended.
This fertilizer should’t exceeds 30% of the dose usually
given.
In addition, additional mineral or even organic
fertilization enriches the soil profile with nitric nitrogen.
These nitric reserves may be very different for similar
yields. In 2009, the profile was more loaded with nitric
nitrogen than in 2010 and especially in the TWW
treatment with fertilization. So, if the soil can be used as
storage for the nitrogen contained in TWW in the first
growing season from 24 kg N-NO3/ha before irrigation to
115 kg N-NO3/ha after irrigation. At the end of the second
growing season, storage capacity dropped to 64 kg N-
NO3/ha, which suggests that a considerable increase in
nitrate leaching occurred. Therefore, in contrast to
manure, which seems to enrich the upper part of the soil
with nitrogen, at least during the first year of growth,
unreasoned mineral fertilization leads to a more rapid
migration of nitrogen at depth.
REFERENCES
[1] Al-Jaloud A.A., Ghulam H., Adnan J., AL Saati
A.J., Shaik Karimulla S., 1995. Effect of
wastewater irrigation on mineral composition of
corn and sorghum plants in a pot experiment, J.
Plant Nutr. 1677–1692.
[2] Belligno A., Meli S. and Porto M. 2000. Irrigation
with lagooned citrus industry wastewater: Effect on
the soil nitrogen oxidation cycle. Journal of Applied
Botany. Angewandte Botanik 74, 61-66.
[3] Berdai H., Jellal N. , Soudi B., Jemali A., Jemali
B., Benchokroun T. and Khana A. 1998.
Reutilisation des eaux usées a des fins agricoles a
ouarzazate : Impact sur l’environnement.
International workshop on sewage treatment and
reuse.
[4] Bond, W.J., 1998. Effluent irrigation - an
environmental challenge for soil science. Aust. J.
Soil Res. 36, 821-830
[5] Bouwer, H., and Chaney, R.L. 1974. Land
treatment of wastewater. Adv.agron., 26, 133-176.
[6] Bouwer, H., and Idelovitch, E. 1987. Quality
requirements for irrigation with sewage water. J.
Irrig. Drain. Eng., 133, 516-535.
[7] Bremner, J.M and Mulvaney, C.S. 1982.
“Nitrogen - total”, In: Page A.L. (Ed.), Method of
Soil Analysis, Part 2, Chemical and Microbiological
properties, 2nd ed., Agronomy 9, Am. Soc. Agron.,
Madison, WI 53711, pp. 95–624.
[8] Choukr-Allah R., Aghai O. 2005. Impact de
l'irrigation par les eaux usées épurées sur la
productivité d'une culture de tomate de plein champ,
la salinité du sol et le bilan d'azote. In : Hamdy A.
(ed.). The use of non conventional water resources.
Bari : CIHEAM/EU DG Research, 2005. p. 165-171.
International Workshop, 2005/06/12-14, Alger
(Algeria).
http://om.ciheam.org/om/pdf/a66/00800306.pdf
[9] Da Fonseca, A.F., Herpin, U., Paula, A.M.,
Victoria, R.L., Melfi, A.J., 2007a. Agricultural use
of treated sewage effluents: agronomic and
environmental implications and perspectives for
Brazil. Sci. Agric. 64, 194-209.
[10]Da Fonseca, A.F., Herpin, U., Dias, C.T.S., Melfi,
A.J., 2007b. Nitrogen forms, pH and total carbon in
11. International Journal of Environment, Agriculture and Biotechnology (IJEAB) Vol-2, Issue-2, Mar-Apr- 2017
http://dx.doi.org/10.22161/ijeab/2.2.33 ISSN: 2456-1878
www.ijeab.com Page | 829
a soil incubated with treated sewage effluent.
Braz.Arch.Biol. Technol. 50, 743-752.
[11]FAO. 2003. L’irrigation avec des eaux usées
traitées. Manuel d’utilisation. Version française
provisoire pour révision. Organisation des Nations
Unies pour l’alimentation et l’agriculture. Bureau
régional pour le proche –Orient, le Caire, Egypte.
Septembre 2003.
[12]Feigin, A. Bielorai H. Dag Y., Kipnis T. and
Giskin M. 1978. The nitrogen factor in the
management of effluent irrigated soils. Vol. 125,
No.4 printed in U.S.A.
[13]Feigin, A., Ravina, I and Shalhevet, J. 1991.
Irrigation with treated sewage effluent: management
for environmental protection. Springer-Verlag,
Berlin Heidelberg.
[14]Friedel, J.K., Langer, T., Siebe, C., Stahr, K.,
2000. Effects of long-term waste water irrigation on
soil organic matter, soil microbial biomass and ist
activities in central Mexico. Boil. Fertil. soils 31,
414-421.
[15]Grant S.A., Kunze R.J. and Asrar G. 1982.
Irrigation with simulated secondary waste water on
tiled soil cropped to bromegrass and corn. J.
Environ. Qual., Vol.11,, no.3.
[16]Gwenzi, W and Munondo, R. 2008. Long- term
impacts of pasture irrigation with treated sewage
effluent on nutrient status of a sandy soil in
Zimbabwe. Nutr Cucl Agroecosyst 82. 197-207.
[17]Hook, J.E. 1981. Movement of phosphorus and
nitrogen in soil following application of municipal
wastewater. In – chemical mobility and reactivity in
soil systems, ed. D.W. Nelson; D.E. Elrick and K.K.
Tanji. Soil Sciences Society of America, Madison,
241-255.
[18]Hook J.E. and Burton T.M. 1979. Nitrate leaching
from sewage-irrigated perennial as affected by
catting managment. J. Env. Qual.. Vol 8: 496-502.
[19]Jordan, M.J., Nadelhoffer, K.J and Fry, B. 1997.
Nitrogen cycling in forest and grass ecosystems
irrigated with 15N-enriched wastewater. Ecological
application, 7, 864-881.
[20]Khelil, M.N. Rejeb, S. Henchi, B,. Destain, J.P.
2005. Effect of fertilizer rate and water irrigation
quality on the recovery of 15N-labeled fertilizer
applied to Sudangrass. Agronomy for Sustainable
Development, Springer Verlag (Germany), 2005, 25
(1), pp.137-143.
[21]Khelil, M.N., Destain., J.P. Rejeb., S and
Belgacem., H. 2011. Effects of irrigation water
quality on the recovery of 15N-fertilizer by Sorghum
in field study. Asian Journal of Agriculture and
Rural Development, Vol.1, No.2, pp.90-97
[22]Khelil, M.N., Destain., J.P. Rejeb., S and
Belgacem., H. 2012. Lateral Losses of 15N-
Fertilizer on a Sandy Soil and Its Impact on Plant N-
Recovery in Irrigated Sudangrass. ARPN Journal of
Science and Technology, VOL. 2, NO. 3. 257-264.
[23]Leal., R.M.P., Firme, L.P., Herpin., U., Da
Fonseca., A.F., Montes., C.R., Dos santos dias.,
C.T and Melfi., A.J. 2009. Carbon and nitrogen
cycling in a tropical Brazilian soil cropped with
sugarcane and irrigated with wastewater. Agric.
Water Manage. Doi : 10.1016/j.agwat.2009.09.018.
[24]Lemaire, G and Salette, J. 1984. Relation entre
dynamique de croissance et dynamique de
prélèvement d’azote pour un peuplement de
graminées fourragères-étude de l’effet du milieu.
Agronomie, 4, 5, 423-430.
[25]Lemaire, G., Cruz, P., Gosse, G and Chartier, M.
1985. Etude des relations entre la dynamique de
prélèvement d’azote et la dynamique de croissance
en matière sèche d’un peuplement de Luzerne
(Medicago sativa L.). Agronomie, 5, 8, 685-692.
[26]Marot-Gaudry, J.F. 1997. Assimilation de l’azote
chez les plantes: aspects physiologiques,
biochimiques et moléculaire. Jean-Francois Marot-
Gaudry (éd). INRA, 411p.
[27]Nashikkar V.J. 1993. Effect of reuse of high-Bod
Wastewaters for crop irrigation on soil nitrification.
Environment International, Vol. 19pp. 63-69.
[28]Page, S., Heault, C., Cheneby, D., Lagacherie, B
et Germon, J.C. 1998. Devenir de l’azote des eaux
résiduaires de féculerie après épandage sur un sol
cultivé (INRA, Dijon). Etude de Gestion des Sols
(France), Vol 5, 2, 117-133.
[29]Papadopoulos I. and Stylianou Y. 1988. Trickle
irrigation of cotton with treated sewage effluent. J.
Environ. Qual., Vol.17, no.4.
[30]Polglase, P.J; Tompkins, D; Stewart, L.G and
Fallkiner, R.A. 1995. Mineralization and leaching
of nitrogen in an effluent-irrigated pine plantation. J.
Environ. Qual., 24, 911-920.
[31]Quin., B.F and Forsythe., L.J. 1978. Surface
irrigation of pasture with treated sewage effluent. II.
Drainage losses of nitrate and other nutrients. New
Zealand Journal of Agricultural Research, V21,
427-434.
[32]Ramirez-Fuentes, E., Lucho-Constantino, C.,
Escamilla-Silva, E and Dendooven, L. 2002.
Characteristics and carbon and nitrogen dynamics in
soil irrigated with wastewater for different lengths of
time. Bioresource Technology, V85, 179-187.
12. International Journal of Environment, Agriculture and Biotechnology (IJEAB) Vol-2, Issue-2, Mar-Apr- 2017
http://dx.doi.org/10.22161/ijeab/2.2.33 ISSN: 2456-1878
www.ijeab.com Page | 830
[33]Rebour and Deloye (1971 Rebour, H., and M.
Deloye. 1971. Irrigation de surface et par aspersion.
Paris: Maison rustique.
[34]Richard, G.A., Luis, S.P., Dirk, R and Martin, S.
1998. Crop evapotranspiration-Guidelines for
computing crop water requirements. FAO irrigation
and drainage paper 56.
[35]Salette, J et Lemaire, F. 1981. Sur la variation de
la teneur en azote des graminées fouragères pendant
leur croissance : formulation d’une loi de dilution.
C.R.Acad.Sci Paris, 292,Ser, III, 875-878.
[36]Smith, J.H and Peterson, J.R. 1982. Recycling of
nitrogen through land application of agricultural,
food processing, and municipal wastes. In:
Stevenson, F.J. (Ed). Nitrogen in Agricultural Soils.
2ed. Madison: American Society of Agronomy/Soil
Science Society of America, 791-831.
[37]Smith, C.J and Bond, W.J. 1999. Losses of
nitrogen from an effluent-irrigated with plantation.
Australian Journal of soil Research, V37, 371-389.
[38]Snow, V.O; Smith, C.J; Polglase, P.J and Robert,
M.E. 1999. Nitrogen dynamics in a eucalypt
plantation irrigated with sewage effluent or bore
water. Australian Journal of soil Research. V 37,
527-544.
[39]Speir T.W. Van Schaik A.P. Kettles H.A.,
Vincent K.W. and Campbell D.J. 1999. Soil and
stream-water impacts of sewage effluent irrigation
onto steeply sloping land. J. Environ. Qual. 28 :
1105-1114.
[40]Tanji, K.K. 1997. Irrigation with marginal quality
waters. Journal of Irrigation and Drainage
Engineering. V 123, 165-169.
[41]Vaisman I., Shalhevet J., Kipnis T. & Feigin A.,
1982. Water Regime and Nitrogen Fertilization for
Rhodes Grass irrigated with Municipal Waste Water
on Sand Dune Soil. J. Environ. Qual., Vol.11,no.2,
1982.
[42]Vazquez-Montiel O., Horan N.J and Mara D.D.
1996. Management of domestic wastewater for
reuse in irrigation, Water Sci. Technol.(UK) 33,
355–362.