Academics must provide evidence to demonstrate the impact and outcomes of their scholarly work. This webinar, presented by librarians, will help faculty explore various forms of documentary evidence to support their case for excellence. Sponsored by the IUPUI Office of Academic Affairs.
Note: The webinar included demonstrations of Web of Science & Scopus, which the slides do not reflect.
LITA’s Altmetrics and Digital Analytics Interest Group is proud to present Heather Coates, Richard Naples, and Lauren Collister in our second free webinar of the season. Heather will introduce the concept of altmetrics with a quick "Altmetrics 101," Richard will discuss the Smithsonian's implementation of Altmetric, and Lauren will share the University of Pittsburgh's experience with Plum Analytics.
Existing Impact factors are heavily criticized as measures of scientific quality. However,they are still used to select candidates for positions or consider during promotion of academic staff or grant application processes. As a consequence, researchers tend to adapt their publication strategy to avoid negative impact on their careers. The presenter, a researcher and a librarian. describes the existing metrics and shows how to improve alternative impact factors.
An introduction to open science for the Library Journal webcast Case Studies for Open Science on February 9, 2016.
http://lj.libraryjournal.com/2016/01/webcasts/case-studies-for-open-science/
Updated 30/01/2015
This session included discussions around the value of bibliometrics for individual performance management/promotion and the REF.
What are bibliometrics?
Journal metrics
Personal metrics
Article level metrics and altmetrics
Early Career Tactics to Increase Scholarly ImpactElaine Lasda
Workshp for Ph.D. candidates, postdocs and faculy on how bilbiometrics, altmetrics, open access, ORCID, and other resources enable greater visibility of research output.
Lecture on "Altmetrics: An Alternative View-Point to Assess Research Impact" in Five days Advanced Training Programme on Bibliometrics and Research Output Analysis during 15th - 20th June, 2015 at INFLIBNET Centre, Gandhinagar.
Traditional metrics, such as the h-index and journal impact factors, are used to measure the scholarly impact of research. However, in the current climate of accountability by funding providers, fund recipients would benefit from a more comprehensive impact management system (IMS) to facilitate the capture and reporting of narratives (including metrics) about research impact in the academy, on social policy, in industry, and ultimately with the public.
Librarians have always been good at telling and facilitating stories. Research support librarians can use their storytelling skills to contribute to the implementation and administration of an impact management system. Being able to translate research impact into harvestable and reportable metadata is the key.
This presentation was provided by Pamela Shaw of Northwestern University during the NISO Webinar, Compliance with Funder Mandates, held on September 14, 2016
Webinar slides from June 8 Library Connect webinar "Researcher profiles and metrics that matter" with: Chris Belter, Bibliometrics Informationist, NIH Library; Andrea Michalek, VP of Research Metrics, Elsevier | Managing Director of Plum Analytics; Ellen Cole, Scholarly Publications Librarian, Learning and Research Services, Northumbria University.
View the webinar at: http://libraryconnect.elsevier.com/library-connect-webinars?commid=257883
June 18, 2014
NISO Virtual Conference: Transforming Assessment: Alternative Metrics and Other Trends
Assessing and Reporting Research Impact – A Role for the Library
- Kristi L. Holmes, Ph.D., Director, Galter Health Sciences Library, Northwestern University, Feinberg School of Medicine
Showcasing your Research Impact using BibliometricsCiarán Quinn
Seminar to make academics aware of the bibliometric resources available to them and how to use them to improve their research impact. The session looked at
• What are Bibliometrics and Altmetrics
• Why they are important for you
• How to identify your research impact
and research profile
• How to improve your citations
• How to identify potential research collaborations
Metrics: what they are and how to use themDavid Jenkins
In this training session we defined metrics (a.k.a. bibliometrics or quantitative research indicators), looked at how researchers are using them to demonstrate their excellence, contrasted three databases that provide metrics, examined certain popular metrics, looked at author profile systems in relation to metrics and discussed the uses and abuses of metrics.
We aimed to equip attendees with the knowledge they need to navigate this part of the research environment and we hope that people left with an understanding of how metrics can be useful and what their srengths and weaknesses are. The session really highlighted how metrics continue to be an important albeit contentious area that sheds a useful light on some of the murkier aspects of research assessment.
Publication Strategy: Helping Academics to Increase the Impact of their Res...Fintan Bracken
This presentation was given at the CONUL / ANLTC Seminar "Supporting the activities of your research community – issues and initiatives" Royal Irish Academy, Dublin in December 2014.The talk looked at methods of helping researchers to improve the impact of their research.
This presentation was provided by Emma Warren-Jones of Scholarcy, during the NISO event "Researcher Behaviors and the Impact of Technology," held on March 25, 2020.
The Right Metrics for Generation Open [Open Access Week 2014]Impactstory Team
The traditional way to understand and demonstrate your impact–through citation counts–doesn’t meet the needs of today’s researchers. What Generation Open needs is altmetrics.
In this presentation, we cover:
- what altmetrics are and the types of altmetrics today’s researchers can expect to receive,
- how you can track and share those metrics to get all the credit you deserve, and
- real life examples of scientists who used altmetrics to get grants and tenure
Presentation of findings on Bibliometrics; description, methods with examples, advantages and disadvantages. Methods: Citation counts, Publication counts, H-index and Journal Impact Factor (JIF).
Resources used are shared, please use them.
Presented to members of the Psychology department as part of the New Tricks Seminar series (February 2016)
• journal metrics using WoS and Scopus
• article level metrics in WoS, Scopus and Google Scholar, and from publishers and the differences in each. Touch on altmetrics.
• author metrics in the above. Touch on Publish or Perish
Tanya Williamson, Academic Liaison Librarian
A tool for librarians to select metrics across the research lifecycleLibrary_Connect
These slides introduce a range of research impact metrics. They were presented at the ER&L Conference (April 2017) by Chris James, Product Manager Research Metrics, Elsevier.
Quality Assurance for Journal GuidanceSmriti Arora
Definitions
What is the need for quality assurance in journals ?
Type of journals
Bibliometric indicators
How to identify credible journals ?
Predatory/cloned journals
A presentation delivered online to the Mountain Plains Management Conference at Cedar City, UT on Oct. 18, 2013.
Presented by: Jon Ritterbush of the Calvin T. Ryan Library at the University of Nebraska-Kearney.
A presentation on 'Publishing in Academic Journals – Tips to help you succeed' presented at the 2015 University of South Africa (Unisa) Authors Workshop organised by Unisa’s College of Graduate Studies and the Unisa Library
This presentation was provided by Sarah Koechlein of James Madison University, during the NISO event "From Submission to Publication: Creating and Conveying Quality," held on August 21, 2019.
Modern research metrics and new models of evaluation have risen high on the academic agenda in the last few years. In this session two UK institutions who have adopted such metrics across their faculty will share their motivations and experiences of doing so, and explain further how they are integrating these data into existing models of review and analysis.
Gather evidence to demonstrate the impact of your researchIUPUI
This workshop is the 3rd in a series of 4 titled "Maximize your impact" offered by the IUPUI University Library Center for Digital Scholarship. Faculty must provide strong evidence of impact in order to achieve promotion and tenure. Having strong evidence in year 5 is made easier by strategic dissemination early in your tenure track. In this hands-on workshop, we will introduce key sources of evidence to support your case, demonstrate strategies for gathering this evidence, and provide a variety of examples. These sources include citation metrics, article level metrics, and altmetrics as indicators of impact to support your narrative of excellence.
Teaching data management in a lab environment (IASSIST 2014)IUPUI
Equipping researchers with the skills to effectively utilize data in the global data ecosystem requires proficiency with data literacies and electronic resource management. This is a valuable opportunity for libraries to leverage existing expertise and infrastructure to address a significant gap data literacy education. This session will describe a workshop for developing core skills in data literacy. In light of the significant gap between common practice and effective strategies emerging from specific research communities, we incorporated elements of a lab format to build proficiency with specific strategies. The lab format is traditionally used for training procedural skills in a controlled setting, which is also appropriate for teaching many daily data management practices. The focus of the curriculum is to teach data management strategies that support data quality, transparency, and re-use. Given the variety of data formats and types used in health and social sciences research, we adopted a skills-based approach that transcends particular domains or methodologies. Attendees applied selected strategies using a combination of their own research projects and a carefully defined case study to build proficiency.
Objectives: To explore potential collaborations between academic libraries and Clinical Translational Science Award (CTSA)-funded institutes with respect to
data management training and support.
Methods: The National Institutes of Health CTSAs have established a well-funded, crucial infrastructure supporting large-scale collaborative biomedical research. This infrastructure is also valuable for smaller, more localized research projects. While infrastructure and corresponding support is often available for large, well-funded projects, these services have generally not been extended to smaller projects. This is a missed opportunity on both accounts. Academic libraries providing data services can leverage CTSA-based resources, while CTSA-funded institutes can extend their reach beyond large biomedical projectsto serve the long tail of research data.
Results: A year-long series of conversations with the Indiana CTSI Data Management Team resulted in resource sharing, consensus building about key issues in data management, provision of expert feedback on a data management training curriculum, and several avenues for future collaborations.
Conclusions:Data management training for graduate students and early career researchers is a vital area of need that would benefit from the combined infrastructure and expertise of translational science institutes and academic libraries. Such partnerships can leverage the instructional, preservation, and access expertise in academic libraries, along with the storage, security, and analytical expertise in translational science institutes to improve the management, protection, and access of valuable research data.
Data sharing promotes many goals of the NIH research endeavor. It is particularly important for unique data that cannot be readily replicated. Data sharing allows scientists to expedite the translation of research results into knowledge, products, and procedures to improve human health. Do you know what a data sharing plan should include? Are you aware of common practices and standards for data sharing? Do you know what services are available to help share your data responsibly? This workshop will begin to address these questions. Q&A will follow the presentation. Anyone interested in or planning to apply for NIH funding should attend. Note: The NIH data-sharing policy applies to applicants seeking $500,000 or more in direct costs in any year of the proposed research.
Data Management Lab: Session 4 Slides (more details at http://ulib.iupui.edu/digitalscholarship/dataservices/datamgmtlab)
What you will learn:
1. Build awareness of research data management issues associated with digital data.
2. Introduce methods to address common data management issues and facilitate data integrity.
3. Introduce institutional resources supporting effective data management methods.
4. Build proficiency in applying these methods.
5. Build strategic skills that enable attendees to solve new data management problems.
Data Management Lab: Session 4 Review OutlineIUPUI
Data Management Lab: Session 4 Review Outline (more details at http://ulib.iupui.edu/digitalscholarship/dataservices/datamgmtlab)
What you will learn:
1. Build awareness of research data management issues associated with digital data.
2. Introduce methods to address common data management issues and facilitate data integrity.
3. Introduce institutional resources supporting effective data management methods.
4. Build proficiency in applying these methods.
5. Build strategic skills that enable attendees to solve new data management problems.
Data Management Lab: Session 3 slides (more details at http://ulib.iupui.edu/digitalscholarship/dataservices/datamgmtlab)
What you will learn:
1. Build awareness of research data management issues associated with digital data.
2. Introduce methods to address common data management issues and facilitate data integrity.
3. Introduce institutional resources supporting effective data management methods.
4. Build proficiency in applying these methods.
5. Build strategic skills that enable attendees to solve new data management problems.
Data Management Lab: Session 3 Data Entry Best PracticesIUPUI
Data Management Lab: Session 3 Data Entry Best Practices (more details at http://ulib.iupui.edu/digitalscholarship/dataservices/datamgmtlab)
What you will learn:
1. Build awareness of research data management issues associated with digital data.
2. Introduce methods to address common data management issues and facilitate data integrity.
3. Introduce institutional resources supporting effective data management methods.
4. Build proficiency in applying these methods.
5. Build strategic skills that enable attendees to solve new data management problems.
Data Management Lab: Session 3 Data Coding Best PracticesIUPUI
Data Management Lab: Session 3 Data Entry Best Practices (more details at http://ulib.iupui.edu/digitalscholarship/dataservices/datamgmtlab)
What you will learn:
1. Build awareness of research data management issues associated with digital data.
2. Introduce methods to address common data management issues and facilitate data integrity.
3. Introduce institutional resources supporting effective data management methods.
4. Build proficiency in applying these methods.
5. Build strategic skills that enable attendees to solve new data management problems.
Spring 2014 Data Management Lab: Session 2 Slides (more details at http://ulib.iupui.edu/digitalscholarship/dataservices/datamgmtlab)
What you will learn:
1. Build awareness of research data management issues associated with digital data.
2. Introduce methods to address common data management issues and facilitate data integrity.
3. Introduce institutional resources supporting effective data management methods.
4. Build proficiency in applying these methods.
5. Build strategic skills that enable attendees to solve new data management problems.
Data Management Lab: Session 2 - Documentation InstructionsIUPUI
Spring 2014 Data Management Lab: Session 2 Documentation Instructions (more details at http://ulib.iupui.edu/digitalscholarship/dataservices/datamgmtlab)
What you will learn:
1. Build awareness of research data management issues associated with digital data.
2. Introduce methods to address common data management issues and facilitate data integrity.
3. Introduce institutional resources supporting effective data management methods.
4. Build proficiency in applying these methods.
5. Build strategic skills that enable attendees to solve new data management problems.
Spring 2014 Data Management Lab: Session 1 Slides (more details at http://ulib.iupui.edu/digitalscholarship/dataservices/datamgmtlab)
What you will learn:
1. Build awareness of research data management issues associated with digital data.
2. Introduce methods to address common data management issues and facilitate data integrity.
3. Introduce institutional resources supporting effective data management methods.
4. Build proficiency in applying these methods.
5. Build strategic skills that enable attendees to solve new data management problems.
Techniques to optimize the pagerank algorithm usually fall in two categories. One is to try reducing the work per iteration, and the other is to try reducing the number of iterations. These goals are often at odds with one another. Skipping computation on vertices which have already converged has the potential to save iteration time. Skipping in-identical vertices, with the same in-links, helps reduce duplicate computations and thus could help reduce iteration time. Road networks often have chains which can be short-circuited before pagerank computation to improve performance. Final ranks of chain nodes can be easily calculated. This could reduce both the iteration time, and the number of iterations. If a graph has no dangling nodes, pagerank of each strongly connected component can be computed in topological order. This could help reduce the iteration time, no. of iterations, and also enable multi-iteration concurrency in pagerank computation. The combination of all of the above methods is the STICD algorithm. [sticd] For dynamic graphs, unchanged components whose ranks are unaffected can be skipped altogether.
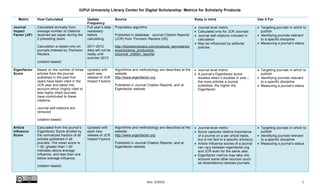
1. IUPUI University Library Center for Digital Scholarship: Metrics for Scholarly Products
Created by Kellie Kaneshiro & Heather Coates, rev. 5/2015 1
Metric How Calculated Update
Frequency
Source Keep in mind Use it For
Journal
Impact
Factor (JIF)
Calculated annually from
average number of citations
received per paper during the
2 preceding years
Calculation is based only on
journals indexed by Thomson
Reuters
(citation-based)
Full year’s data
necessary
before
calculating
2011-2012
data will not be
ready until
summer 2013
Proprietary algorithm
Published in database: Journal Citation Reports
(JCR) from Thomson Reuters (ISI)
http://thomsonreuters.com/products_services/sci
ence/science_products/a-
z/journal_citation_reports/
• Journal level metric
• Calculated only for JCR Journals
• Journal self-citations included in
calculation
• May be influenced by editorial
policies
• Targeting journals in which to
publish
• Identifying journals relevant
to a specific discipline
• Measuring a journal’s status
Eigenfactor
Score
Based on the number of times
articles from the journal
published in the past five
years have been cited in the
JCR year and takes into
account which (highly cited or
less highly cited) journals
have contributed to these
citations
Journal self-citations are
removed
(citation-based)
Updated with
each new
release of JCR
Impact Factors
Algorithms and methodology are described at the
website:
http://www.eigenfactor.org
Published in Journal Citation Reports, and at
Eigenfactor website
• Journal level metric
• A journal’s Eigenfactor score
doubles when it doubles in size –
the more articles a journal
publishes, the higher the
Eigenfactor
• Targeting journals in which to
publish
• Identifying journals relevant
to a specific discipline
• Measuring a journal’s status
Article
Influence
Score
Calculated from the journal’s
Eigenfactor Score divided by
the normalized fraction of all
articles published in all
journals. The mean score is
1.00, greater than 1.00
indicates above average
influence, and less than one
below average influence.
(citation-based)
Updated with
each new
release of JCR
Impact Factors
Algorithms and methodology are described at the
website:
http://www.eigenfactor.org
Published in Journal Citation Reports, and at
Eigenfactor website
• Journal-level metric
• Score captures relative importance
of a journal on a per article basis,
but is not tied to a specific article(s).
• Article Influence scores of a journal
can vary between eigenfactor.org
and JCR even for the same year.
• Eigenfactor metrics may take into
account some other sources (such
as dissertations) besides journals.
• Targeting journals in which to
publish
• Identifying journals relevant
to a specific discipline
• Measuring a journal’s status
2. IUPUI University Library Center for Digital Scholarship: Metrics for Scholarly Products
Created by Kellie Kaneshiro & Heather Coates, rev. 5/2015 2
Metric How Calculated Update
Frequency
Source Keep in mind Use it For
h-Index The largest number h such
that h publications have at
least h citations.
Developed to quantify
cumulative impact of a
scholar’s published works and
may also be used as a
productivity measure.
(citation-based)
Timeframe and
updates
depend on the
source.
Can be manually calculated using citation
databases.
Calculated automatically by Web of Science,
Scopus, Google Scholar – the number may vary
due to Scholar’s broad coverage, smaller
databases tend to be more accurate.
http://en.wikipedia.org/wiki/H-index
• Typically a scholar-level metric; may
also be calculated for journals or
any other defined set of documents
• Bounded by total number of
publications
• Favors scholars with longer careers
• Does not account for author position
or number of co-authors
• Researchers with common
surnames may be better off
calculating the h-index manually
• Measuring impact of an
individual’s publications
• Comparing researchers within
disciplines
i10 Index Number of publications with at
least ten citations
(citation-based)
Scholar Metrics
currently cover
articles
published
2007-2011 and
are based on
citations from
all articles
indexed in
Google Scholar
as of April 1st,
2012.
Sources are unclear and subject to changes, and
there is little transparency on how Google
Scholar calculates this number.
http://scholar.google.com/intl/en/scholar/metrics.
html
Scholar-level metric • Measuring impact for an
individual’s publications
• Comparing researchers within
disciplines
Article-level
metrics
(PLoS)
Not a single metric, but a
suite of metrics:
• Article usage (views &
downloads)
• Citations
• Social networks
• Blogs & media coverage
• PLoS community input
Real-time • Article usage: PLoS, PubMed Central
• Citations: PubMed Central, Scopus, CrossRef,
Web of Science
• Social Networks: CiteULike, Connotea, Twitter,
Facebook, Mendeley
• Blogs & Media Coverage: Nature Blogs,
Research Blogging, Trackbacks
• PLoS Community Input: Reader Comments,
Reader Notes, Reader Ratings
http://article-level-metrics.plos.org/alm-info/
No single metric, so it can be more
complex to present in context.
• Demonstrating immediate
impact of your research
across multiple non-
traditional communication
channels
• Benchmarking performance
of a particular item against
similar items
3. IUPUI University Library Center for Digital Scholarship: Metrics for Scholarly Products
Created by Kellie Kaneshiro & Heather Coates, rev. 5/2015 3
Metric How Calculated Update
Frequency
Source Keep in mind Use it For
Impact
Story
Not a single metric, but a
suite of metrics:
• Article usage (views &
downloads)
• Citations
• Social networks
• Blogs & media coverage
• PLoS community input
Including, but not limited to
• PLoS ALM (PLoS, PubMed Central, CrossRef)
• Facebook
• Slideshare
• Github
• Wikipedia
• CiteULike
• Delicious
• Mendeley
• Dryad
• F1000
http://impactstory.org/
• Gathering IDs may not capture
everything
• Artifacts may be missing some
metrics
• Number of items on a report is
currently limited
• Data displayed is not currently CC0
due to licenses with data sources
• Demonstrating immediate
impact of your research
across multiple non-
traditional communication
channels
• Benchmarking performance
of a particular item against
similar items
Journal
acceptance
rates
Proportion of items accepted
for publication in the past year
N/A Editors (may have to request) • May not be transparent or easily
available
• Demonstrating potential
impact for an unpublished or
relatively recent article
Visibility N/A
Examples: book reviews, links
to an item (from a blog,
website, etc.), reputation of
individuals reviewing/linking
to the item, media coverage,
use for policy decisions or
clinical guidelines, and other
impact upon a community or
population
Varies Sources vary • May be difficult to do a systematic
search and capture for this type of
information
• Difficult to provide context for
comparison
• Demonstrating broader
impact of your research that
does not fit into traditional or
formal metrics
Ownership
count
(libraries)
As indexed in the WorldCat
catalog
http://www.worldcat.org/
Depends on
the contributing
libraries, but a
record is added
every 10
seconds.
OCLC, or Online Computer Library Center, Inc.,
which is “a nonprofit, membership, computer
library service and research organization
dedicated to the public purposes of furthering
access to the world’s information and reducing
information costs.”
• May not be recognized or valued as
an indicator of impact in some fields
• Context may be difficult to provide
• As library budgets have decreased,
libraries are purchasing fewer items.
Instead, they are relying on gaining
access via interlibrary-loan (ILL).
• Demonstrating broad
dissemination
• Demonstrating value to
academic and/or public
audiences
4. IUPUI University Library Center for Digital Scholarship: Metrics for Scholarly Products
Created by Kellie Kaneshiro & Heather Coates, rev. 5/2015 4
Metric How Calculated Update
Frequency
Source Keep in mind Use it For
WorldCat is the largest online public access
catalog in the world. It includes 1.8 billion items
represented by 270 million records. These
records come from 72,000 libraries worldwide in
170 countries and territories.
Indexed in
major
databases
A general indication of the
quality of a scholarly
publication
Ex: for biomedical disciplines,
indexed for PubMed in
MEDLINE by the National
Library of Medicine
Varies
depending on
the database
Typically, commercial publishers • The criteria for indexing varies by
database and may not be
transparent
• Demonstrating value of
publishing in a journal that is
new or not yet established
Web
metrics
(views,
downloads,
shares)
Calculated by the repository
or website, typically excluding
bots
Varies,
typically real-
time
Analytic code within the repository system itself • Similar accuracy issues with all web
statistics, although many
repositories screen out traffic from
bots and web crawlers
• Demonstrating the reach and
impact of the item
• Complementing data from
other sources to provide
overall indication of impact
Editorial
Board
quality
Journal website; reputation
among your colleagues
Varies Colleagues • Can be unreliable or lag behind
actual events
• Complementing quantifiable
metrics
Selected Reading
1. Roemer, R. C. & Borchardt, R. (2012). From bibliometrics to altmetrics: A changing scholarly landscape. College & Research Libraries News, 73(10), 596-600.
http://crln.acrl.org/content/73/10/596.full
2. Piwowar, H. & Priem, J. (2013). The power of altmetrics on a CV. Bulletin of the American Society for Information Science and Technology, 39(4), 10-13.
DOI: 10.1002/bult.2013.1720390405