Downloaded 33 times
![DNV GL © 2013
15
11
15
1717
0%
5%
10%
15%
20%
VLCC Suezmax Aframax Panamax Handysize
300
100
200
0
700
600
500
400
20202019201820162015 201720142013201220112010
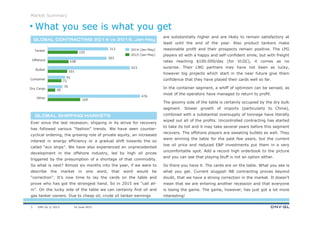
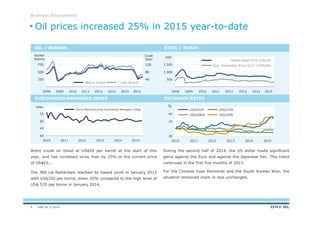
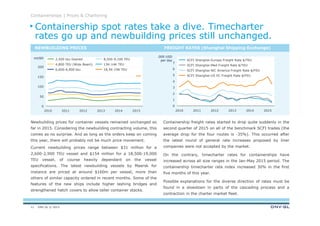
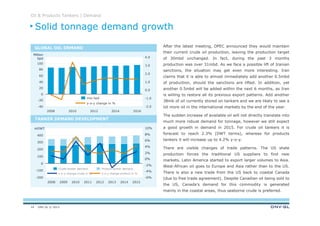
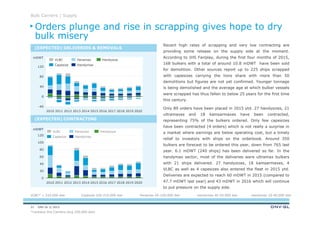
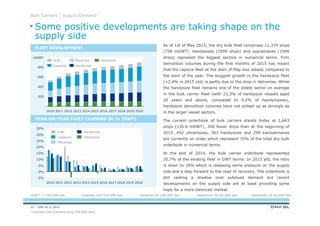
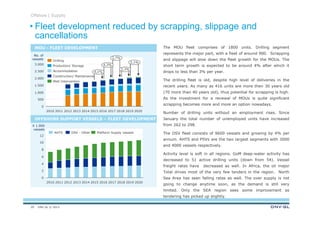
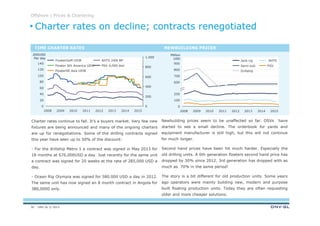
If we look at the demand/supply ratio, it seems like most of the
oil tanker segments are well balanced. On the crude side, the
demand for tonnage is a notch ahead of the expected fleet
growth, providing an extra boost for freight rates. When we look
beyond the current year, we must not underappreciate coming
deliveries, which in 2016 will be much higher than in 2014 and
2015. This will certainly bring a cooling effect to the earnings.
On the product side, the balance is slightly worse although yet
not alarming. The fleet is going to grow 1% faster than demand
for tonnage. As already mentioned before, we are particularly
worried about 245 vessels strong MR orderbook. Many of those
ships were contracted on a speculative basis and thus may
struggle to find employment once being delivered. In addition,
on the longer hauls, LR1 tankers will gradually try to squeeze
their smaller brothers out of business, by providing better
economies of scale.
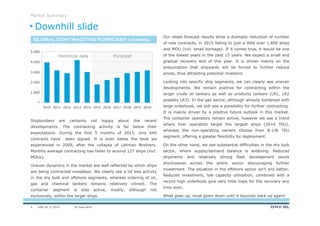
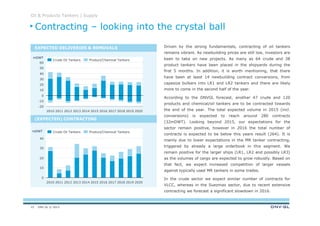
The oil tanker orderbook contains 841 ships corresponding to
75.6 mDWT. It represents 8% and 14% of the existing fleet
respectively. The current fleet consists of 11,026 ships, which
have an accumulated tonnage of 526.9 mDWT.
In 2015, the crude fleet is expected to grow by 1.1% (vs.
demand of 2.3%) whereas the products tanker fleet will grow by
5.6% (vs demand of 4.2%).
mDWT
Oil & Products Tankers | Supply
FLEET DEVELOPMENT
Order book versus fleet [in %]
Product/Chemical TankersCrude Oil Tankers
Fleet in balance
16](https://image.slidesharecdn.com/dnvgltrendreportjune2015-150827073323-lva1-app6891/85/DNV-GL-Trend-Report-June-2015-16-320.jpg)

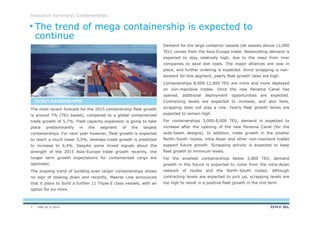
This document provides a market summary and outlook for the global shipping industry in mid-2015. It discusses trends in key shipping segments including containerships, tankers, bulk carriers and offshore vessels. For containerships, demand is expected to remain high for large vessels above 12,000 TEU due to cost savings. Newbuilding contracting is forecast to reach 1.9 million TEU in 2015 with a focus on vessels over 16,000 TEU. Overall containership fleet growth is projected to be around 7% in 2015 and 5.5% in 2016.


![Emsa --final-report-bunkering-lng op-06_2012_b[1]](https://cdn.slidesharecdn.com/ss_thumbnails/emsa-final-report-bunkering-lngop062012b1-131120023037-phpapp01-thumbnail.jpg?width=640&height=640&fit=bounds)


