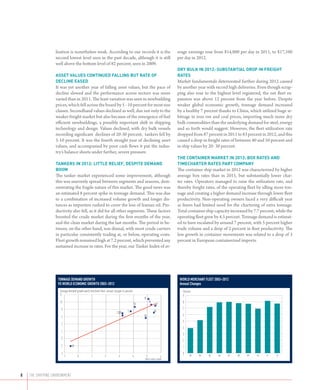
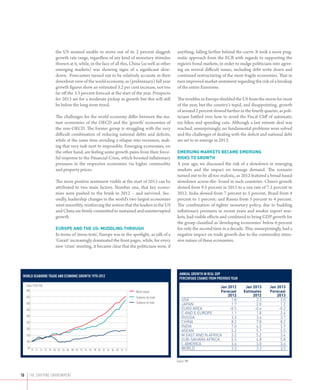
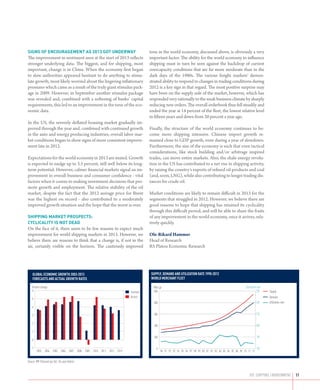
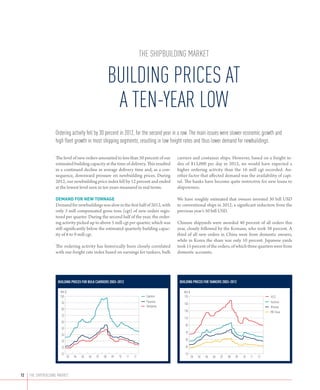
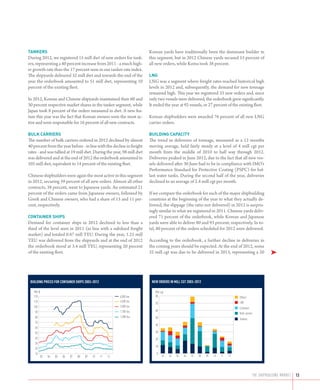
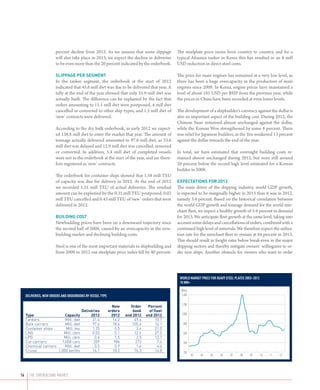
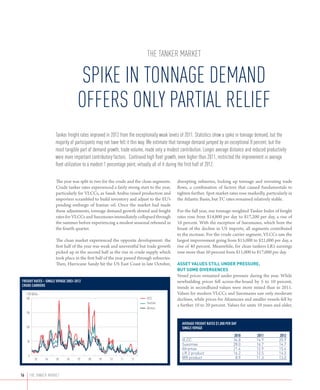
The document provides an overview of the global shipping and offshore markets in 2013. It discusses trends in various shipping segments including tankers, dry bulk carriers, container ships, car carriers, and LNG carriers. The offshore section covers mobile offshore drilling units, offshore support vessels, and offshore construction vessels. Key points include another year of high fleet growth outpacing tonnage demand growth, declining freight rates and asset values across most shipping segments, and signs of recovery in the LNG and offshore markets. Overall, the markets remained challenging in 2013 but showed potential for recovery in 2014-2015 as the global economy improves and fleet growth moderates.
This document provides a market summary and outlook for the global shipping industry in 2015. It discusses trends in key shipping sectors such as containerships, oil and gas tankers, and bulk carriers. Specifically for containerships, it notes that liner companies increased cooperation through new alliances in 2014 and expects further consolidation. It also predicts continued growth of ultra-large containerships over 18,000 TEU as alliances seek economies of scale. Overall container trade is forecast to grow 6.5-7% in 2015 while the container ship fleet is expected to expand 7-7.5%, which could put pressure on freight rates if not balanced with other measures.
A structural model for forecasting the shipping marketIlias Lekkos
The aim οf this study is to develop an econometric model describing the evolution of new-build and second-hand ship prices. While this model was developed originally to address internal needs within the Piraeus Bank Group, we believe that both our modelling methodology and the broader “philosophy” of our approach could be of wider interest.
The ability to identify the factors that affect the shipping market can be used in a number of ways, such as:
Estimate the “fair” value in the new-build and second-hand market and assess current market pricing vs fair-valuation levels.
Allow banks to assess the future evolution of the value of shipping loan collaterals (i.e. the value of the ship underlying the loan).
To be used for risk management purposes by assessing the sensitivity of the collaterals under a series of explanatory factors.
Create long-term forecasts under alternative macroeconomic scenarios.
The port of Los Angeles faces increased competition from expanding ports elsewhere. To maintain its position, the port, businesses, and labor must work together. Recent disruptions showed how vital the port is to the regional economy. The port is investing $1.2 billion to upgrade infrastructure to handle larger ships. It also aims to improve operations and relationships. Cooperation across sectors is needed to ensure the port remains competitive and the major economic driver it currently is for Southern California.
The document discusses port congestion issues driven by increased global trade. It identifies several key pressure points facing ports worldwide, including challenges in Europe from Russian trade growth, limited capacity at western European container ports, and issues with established French ports. Pressure points in Asia include rapidly expanding Chinese container ports, long ship queues in Australian bulk ports, and constrained coal and port networks in India and China. The Middle East, Africa, and North America are also facing port capacity challenges keeping up with trade demands.
CN and CP both reported their earnings for the three months ended June 30, 2012. CN saw a 4% increase in revenues while CP's revenues were up 7%. The Port of Sept-Îles had a strong 2011, with modest volume growth of 3.7% to 26 million tonnes, and expects volumes to increase to 32 million tonnes in 2012. Iron ore shipments through the port were 22.9 million tonnes in 2011 and are forecast to reach nearly 30 million tonnes in 2012. The port is undertaking a $220 million expansion to increase capacity by 50 million tonnes.
This document discusses factors that influence oil tanker rates for transporting crude oil from the Arabian Gulf region. It analyzes historical spot rates for two benchmark routes (TD1 and TD3) from 2003-2007. Through statistical analysis, it identifies key drivers of the TD3 rate, including refining margins in Asia, Arabian Gulf crude production, vessel utilization rates, and the Brent-Dubai oil price spread. Over time, the importance of Arabian Gulf production declined relative to Brent-Dubai spreads in impacting tanker rates. The paper also examines the lead-lag relationship between the TD1 and TD3 benchmarks.
An analysis of the impacts of New Pipeline projects on the Canadian Energy Se...GE 94
This document analyzes the impacts of new oil pipeline projects on the Canadian energy sector using a TIMES energy model for Canada. It discusses Canada's significant oil resources and production, and need to increase export capacity to reach projected production levels. It outlines three key export market opportunities: central and south USA markets via existing pipelines; western North American coasts and Asia via proposed pipelines like Keystone XL and Trans Mountain; and eastern Canada and USA markets. The analysis will use scenarios examining different pipeline capacity expansion options to determine impacts on Canadian oil production and overall energy demand.
Seaports & Port Cities in southern Africa: the economic benefits and landslid...Railways and Harbours
The document discusses the impact of the global economic crisis on sea transport markets and South African ports. It notes that shipping markets experienced a boom in 2008 but then a steep decline from late 2008 onwards. It predicts muted growth in container traffic and dry bulk cargoes in 2009. However, lower freight rates may increase the competitiveness of long-haul trades like those from South Africa. While the short-term outlook is bleak, lower rates could benefit some sectors in South Africa like bulk cargo exporters and port ancillary services in the longer run.
• US tight oil production and the future oil price
• Dubai:MD and CEO of DEWA receives CEO of First Solar
• UAE's Masdar inks deal to build Mauritania solar projects
• No 'significant' change in Saudi oil policy after king's death
• Algeria:To increase its oil output & renewable energy projects production
• Norway: Det norske commences drilling on the Ivar Aasen field
• Bangladesh:KrisEnergy completes 2D seismic program in SS-11
• India: Energy subsidies prove drain on Indian economy
• Oil producers in US not able to drill at $45 a barrel
• Oil price plunge to boost global M&A activity in 2015, says EY
This document discusses the risks of shipping Bakken crude oil by rail. It notes the rapid growth in rail shipments of crude oil from North Dakota due to insufficient pipeline capacity. It highlights the catastrophic 2013 derailment and explosion in Lac-Mégantic, Quebec that killed 47 people. The summary identifies three key factors that contributed to the risks: the high volatility of Bakken crude oil, the inadequacy of standard DOT-111 tank cars for transporting it, and poor rail safety procedures and lack of regulatory oversight. The document explores various strategies for mitigating these risks, such as improving tank car standards, stabilizing crude before shipment, and increasing oversight of the rail industry.
1) The ECHO crude oil storage and terminal facility in Houston, Texas is being constructed by Enterprise Products Partners LP to capitalize on increasing crude oil production and flows to the Gulf Coast region.
2) The ECHO terminal will link major crude oil supply basins like the Eagle Ford, Bakken, and Permian with Gulf Coast refineries, providing up to 6 million barrels of storage capacity.
3) There is concern that bottlenecks could simply be transferred from Cushing, Oklahoma to the Houston area, but the ECHO terminal and connections to multiple pipelines should help alleviate constraints and allow for crude blending and distribution to refineries.
The document summarizes the Ports-to-Plains trade corridor, which includes four federally designated highway routes connecting ports and borders in Texas, New Mexico, Colorado, Wyoming, South Dakota, North Dakota and Montana. It discusses the purpose of the corridor in facilitating trade, energy security, and food security across the region. Specifically, it provides trade data showing that Colorado's top domestic trade partners that could benefit from the corridor are Texas, New Mexico, and Nebraska, and that Colorado's trade with Mexico through ports on the corridor has grown in recent years.
- Priority Freight acquired a Russian logistics company in 2009 to enter the Russian market, focusing on reducing transit times and providing rapid customs clearance.
- Doing business in Russia is more difficult than other countries due to complex bureaucracy, lack of transparency, and extreme weather conditions. However, Russia remains an important strategic market.
- Competition in Russia is tough, divided between large national companies and smaller niche providers. Foreign companies often partner with local firms due to regional specialization and lack of trust in the market.
- Transport services in Russia are generally of lower quality than Europe due to greater distances, local issues, and harsher weather, though comparisons have limitations given Russia's larger size.
Dr. Himadri Banerji presented at the 2nd FSRU Conference in Singapore on risk management in LNG FSRU projects. He discussed key risks including construction delays and cost overruns, operational issues, upstream and downstream market volatility, and political and legal risks. Effective risk allocation and control requires well-defined contracts that allocate risks to parties best able to manage them. Non-recourse project financing is increasingly common through structures that limit risks for terminal operators, such as tolling agreements that transfer supply and market risks. Evolving contract and insurance structures also help manage risks in LNG FSRU projects.
The document provides an economic analysis and market outlook for world shipping in December 2012. It discusses:
1) World economic growth was weaker than expected in 2012, while fleet growth remained high, leading to a decline in average fleet capacity utilization.
2) The tanker market saw strong demand growth in 2012 but this is unlikely to repeat in 2013 as oil demand forecasts have been reduced. Fleet growth should decline but may not be enough to improve utilization.
3) Dry bulk demand grew around 6% in 2012 due to Chinese imports, but ton-mile growth was lower. Slower fleet growth and moderate economic growth in 2013 may balance supply and demand but only small changes in utilization are expected.
This document is a registration statement filed by Dorian LPG Ltd. with the U.S. Securities and Exchange Commission for an initial public offering of its common shares in the United States. Dorian LPG Ltd. is registering an unspecified number of its common shares. The filing includes basic company information, biographical details of officers and directors, descriptions of the company's capital stock, plan of distribution for the offering, financial statements and other standard disclosures required in such filings. The company intends to apply to list its common shares on the New York Stock Exchange.
This document provides a summary of Jinhui Shipping and Transportation Limited's Q4 2013 and full year 2013 results presentation. It highlights the following key points:
1) For 2013, revenue decreased 7% to $218 million while net profit decreased 29% to $25 million compared to 2012.
2) For Q4 2013, revenue increased 2% while the company reported a net loss of $3 million compared to a net profit in Q4 2012.
3) The company owns 38 dry bulk carriers with a total capacity of 2.2 million DWT and an average age of 7 years.
4) Average daily time charter equivalent rates were $14,092 for 2013, down from $15
Siem Offshore Inc. presented in March 2014. The presentation covered the company's financial results for 2013, future vessel construction plans, and the offshore vessel market. Key points included:
- Revenue for 2013 was $364 million with a 34% operating margin, an improvement over 2012.
- The company has 41 vessels currently in operation and 15 more under construction through 2016 with a total contract backlog value of $395 million.
- New orders in 2013 and 2014 include platform supply vessels, offshore subsea construction vessels, and well intervention vessels.
Olympic Shipping investor presentation 27 May 2014TradeWindsnews
Olympic Ship AS is contemplating a NOK 500 million bond issue to partly refinance existing bonds and for general corporate purposes. It is a leading provider of high-end offshore vessels with a fleet value of NOK 8.1 billion and a contract backlog of NOK 4.9 billion. The bond terms include a 5-year tenor, quarterly coupon payments of 3M NIBOR + 4.75-5.00%, and senior unsecured status. The market outlook is positive for Olympic Ship AS's core offshore segments, with projected strong growth in global E&P spending and deepwater production through 2020.
Höegh LNG reported financial results for the first quarter of 2014, with an EBITDA of -$1.0 million and loss before tax of $4.5 million. Two FSRU projects were completed on time and on budget, with the PGN FSRU Lampung delivered in April and the Independence delivered in May. A letter of intent was also signed for a 5-year FSRU contract with Egas of Egypt. Global LNG demand is expected to continue strong growth in Asia and other markets. Höegh LNG aims to further expand its fleet of FSRUs and pursue FLNG opportunities.
Ship Finance International Q1 2014 results presentationTradeWindsnews
Ship Finance International reported net income of $40.7 million for 1Q 2014 with EBITDA of $129.7 million including associated companies. Key highlights included an increased quarterly dividend of $0.41 per share, equivalent to a 9% dividend yield, and the successful delivery of 10 vessels and rigs so far in 2014. The company also has investment opportunities planned across multiple segments for the remainder of 2014 and into 2015.
The global economic outlook is characterized by weak growth and great uncertainty, according to experts interviewed for the Maritime Outlook Report. Historically low interest rates and declining commodity prices indicate weakened international economic strength. Leading nations have nearly exhausted their fiscal and monetary options, and China is transitioning to slower but more sustainable growth. Geopolitically, the security landscape is becoming more challenging as civil wars rage in parts of the Middle East and North Africa. However, the Paris climate agreement offers hope for increased international cooperation. Shipping will play a role in reducing emissions through more efficient operations and new technologies. The decline in offshore activity on the Norwegian Continental Shelf poses challenges for Norway's maritime industry and economy.
In this edition of Seaview we interview some of the leading names in international ro-ro, tanker and dry bulk shipping business and learn first-hand how they are addressing the current competitive market through increased efficiency while adopting environmentally friendly policies, can this be achieved, yes it can! Is LNG the marine fuel of the future, how is ship design changing to accommodate the particular storage challenges that this new “green” fuel brings and has the whole issue of LNG distribution been properly addressed? We take a look how the new generation of seafarers are going to be trained and the new cost saving tools that they will
use. And as always we will focus on safety and the latest initiatives that will ensure safe passage on ro-ro shipping. Lastly is the ConRo concept about to change the face of container shipping, read on and find out more in this edition of Seaview.
This document provides a market summary and outlook for the global shipping industry in mid-2015. It discusses trends in key shipping segments including containerships, tankers, bulk carriers and offshore vessels. For containerships, demand is expected to remain high for large vessels above 12,000 TEU due to cost savings. Newbuilding contracting is forecast to reach 1.9 million TEU in 2015 with a focus on vessels over 16,000 TEU. Overall containership fleet growth is projected to be around 7% in 2015 and 5.5% in 2016.
August Newsletter - Affinity Small Scale LNG.pdfAbrorieABE
This document provides a monthly newsletter on small scale LNG and LNG bunkering from Affinity Energy Infrastructure. It includes profiles of key personnel, a market commentary noting a quiet market due to COVID-19 but some new potential projects in Europe supported by subsidies, and updates on various small scale LNG and bunkering projects and vessels around the world. It also contains tables summarizing the global small scale LNG fleet size bands, ages, locations, and total estimated bunkering capacity.
This document discusses floating storage and regasification units (FSRUs) as an alternative to onshore LNG terminals. FSRUs offer lower upfront costs, faster development timelines, and flexibility in their location compared to onshore terminals. However, FSRUs also face challenges from meteorological conditions that can disrupt operations and availability. The document outlines the opportunities and risks of FSRUs that developers must consider to determine if an FSRU is the best solution for a given LNG import project.
The Greek maritime cluster is thriving, despite the dire fiscal conditions in Greece and the extreme low freight rates in the international markets. The article summarizes some of the key facts and highlights some aspects of the expected future growth.
This document contains a marketing plan for a freight and logistics company looking to take advantage of opportunities in the global maritime industry and Nigeria specifically. It outlines key points on industry trends, including growth of shipping in Asia Pacific and demand for container handling. Specific opportunities identified for the company include partnerships with Chinese and Indian firms, pursuing container shipping, embracing new technologies, and opportunities in oil/gas and renewable energy. The plan also identifies opportunities in Nigeria around acquiring shipping vessels, improving security, developing partnerships and intermodal infrastructure, and penetrating the oil/gas sector.
This document provides an overview and highlights from the 2021 IGU World LNG Report. It summarizes that global LNG trade increased slightly in 2020 despite COVID-19 impacts. Asia Pacific and Asia accounted for over 70% of global LNG imports. LNG spot prices were volatile in 2020. While liquefaction capacity increased by 20 MTPA in the US, several other projects faced delays due to the pandemic. The LNG shipping and regasification industries also continued expanding in 2020.
IHS Markit - Maritime Trade - Making headwayradhikaburman
The document discusses several trends impacting the global maritime industry over the next decade:
1. The crisis facing the South Korean shipbuilding industry due to overcapacity and lack of new orders, which is leading to workforce reductions and consolidation. This will impact global ship supply and pricing.
2. The impact of increasing digital technology on ship operations and seafarers, with debates around automation reducing crew sizes versus maintaining traditional ship roles.
3. Rising trade barriers such as Brexit and protectionist measures, threatening the free flow of global trade that shipping relies upon. Increased political interference could distort shipping markets.
One of my last article about Global LNG Industry which was used as PR material for FSRU Asia Summit 2016, http://www.fsrusummit.com/ The original article can be read in this link https://energyroutes.eu/2016/05/08/global-lng-market-trends-and-future-outlook/
Fifty Years of Global LNG, Trafigura White PaperTrafigura
LNG has experienced remarkable developments in commercialization and export capacity in a span of just 50 years. In this paper produced for the 2014 LNG Asia Pacific Summit in Singapore, Professor Craig Pirrong probes where the industry is headed as oil-based pricing becomes a relic of the past. His analysis and insights describe a potential revolution in LNG pricing and contracting mechanisms that will rely on trading firms and commodity markets to secure supply and manage risk.
The white paper is written by Craig Pirrong, professor of finance and the Energy Markets Director for the Global Energy Management Institute at the Bauer College of Business at the University of Houston. The white paper was written with the funding and support of The Trafigura Group.
(Trafigura, September 2014)
Read more about Trafigura on our website: www.trafigura.com
IONS Seminar 2014 - Session 4 - Industry Trends and Major Issues Confronting ...Navy Webmaster
The document summarizes key points from a presentation on issues facing the international shipping industry, given at the Fourth Indian Ocean Naval Symposium. It notes that the Indian Ocean region is very important for shipping, carrying large percentages of global seaborne trade. It then discusses outlooks and forecasts for different shipping segments, environmental regulations burdening the industry, and ideas to support shipping such as a national ports strategy and maritime school of strategic thought in Australia.
Poyry - How can small-scale LNG help grow the European gas market? - Point of...Pöyry
A large new market for natural gas is under rapid development whilst also reducing emissions. LNG is reaching markets previously inaccessible to pipeline gas; as a fuel for transport and for communities remote from the gas grid. A significant development is the use of LNG in marine transport, which currently uses heavy fuel oils.
The Dockwiser Middle East edition focuses on Dockwise and external developments in the region. The feature, Mecca of World Oil & Gas (12-23), covers the history of Middle Eastern oil spanning 100 years, review of top oil and gas players, world oil and gas landscape, countries leading the offshore pack and offshore drilling hotspots.
Next to the feature, you will explore various sections including DockTalk, where Pushing Limits (24-25) and Arabian Float-over (34-35) articles cover recent installation projects. We also provide you with two different Industry Perspectives from the CEO of Shelf Drilling (30-31) and Dutch Ambassador to the UAE (36-37). In the Creating New Horizons section, seasoned managers from Dockwise and Boskalis provide an insight of doing business in the region as they focus on Growing Offshore Business (26-27) and Understanding Customer Needs (32-33). In the Technology Focus section, we describe the phases of a Float-over installation (28-29) whereby semi-submersible heavy transport vessels are used to transport and install offshore topsides. In addition to the oil and gas focus, we included a leisure article covering travel in beautiful Abu Dhabi (12-14).
Aon's Global marine market trends as at Q3 2015Graeme Cross
The document provides a quarterly market report on trends in the marine insurance industry as of Q3 2015. Key points include:
- Rates have generally decreased across most marine product lines by 5-10% due to increased capacity and improved loss trends.
- Cargo and hull markets remain very competitive with ample capacity. P&I renewals are also expected to be favorable.
- Several insurers and brokers made leadership changes and expanded their marine teams and capabilities in various regions.
- The outlook is that continued overcapacity will benefit clients through lower prices, but also increased competition and new product development in the industry.
The document discusses issues facing the container shipping industry due to falling bunker fuel prices. It notes that research shows slow steaming may no longer save costs as fuel prices have dropped significantly from a year ago. This could lead shipping lines to consider speeding up vessels instead of using as many ships at slower speeds. However, many factors would need to be considered in making this decision and shipowners have generally preferred slow steaming to manage excess capacity. The lower fuel costs may also allow some adjustment of shipping routes and vessel usage.
The document discusses the operations and strategies of Damen Shipyards Group, a major Dutch shipbuilding company. It details how Damen has adapted to competition from lower-cost countries by focusing on specialized, high-tech ships and investing in research and development as well as workforce training. Despite competition, Damen has grown to be one of Europe's largest shipbuilding groups through its standardized designs, economies of scale, and ability to steer toward success.
Dockwise successfully transported the second hull of the Canberra class Amphibious Landing Helicopter Dock for the Royal Australian Navy. The 230 meter long hull was loaded onto Dockwise's vessel Blue Marlin in Spain and transported to Australia for completion. Dockwise also discusses upcoming transportation projects of offshore modules for the Wheatstone LNG project in Australia and two large jack-up drilling rigs for Statoil in Norway, both representing the largest contracts and heaviest transports in Dockwise's history. The article also provides an overview of business activities and events in the Middle East offshore oil and gas industry.
Maersk Drilling reported strong financial results for 2013, with profits increasing from USD 347M in 2012 to USD 528M in 2013. Operational uptime also increased, from 92% in 2012 to 97% in 2013. For 2014, Maersk Drilling expects results to be below 2013 due to planned rig maintenance and start-up costs for new rigs. Maersk Drilling secured several new contracts in 2013 and has high contract coverage for 2014-2016, with a revenue backlog of USD 7.9B. The company continues expanding through its newbuild program but some rig deliveries will be delayed 2-4 months. Maersk Drilling's priorities for 2014 include successful rig deliveries and maintenance
Teekay Corp group presentation September 2013TradeWindsnews
Teekay Corporation is a leading provider of marine services to the global oil and gas industry. It has a fleet of over 170 vessels across its business segments of offshore, liquefied gas, and tankers. The presentation discusses trends supporting continued growth in the offshore and liquefied natural gas markets. It also outlines Teekay's diversified business model and significant forward fixed contracts of over $15 billion. Teekay has been pursuing a strategy of growing its daughter companies like Teekay LNG and Teekay Offshore through organic projects and dropdown acquisitions, which benefit Teekay Corporation through increasing cash distributions.
GasLog investor day presentation September 2013TradeWindsnews
- The presentation provides an overview of GasLog Ltd. and their investor day activities
- It discusses GasLog's business strategy, growth trajectory, and portfolio of LNG shipping vessels
- An external speaker then provides context on the growing LNG market and shipping demand outlook
Siem Offshore is an offshore vessel owner and operator with 38 vessels in operation and 10 under construction. The company provides offshore support vessels and has expanded into subsea vessels and offshore renewable energy. Siem Offshore reported operating revenue of $172 million for the first half of 2013 and has a contract backlog of $806 million for vessels and $180 million for submarine power cable activities. The company has a strong financial position with a book equity ratio of 44% and has secured financing for its newbuilding program through 2014.
SeaBird Exploration provides marine 2D and 3D seismic data to the oil and gas industry. It has a global presence and leading operational excellence. The company focuses on core business segments like 2D acquisition and niche 3D acquisition. It has a diversified fleet and blue-chip client base. SeaBird aims to optimize fleet utilization through a mix of long and short-term contracts while also pursuing multi-client projects to capitalize on opportunities. Historical data shows high vessel utilization and revenues, though repositioning can impact utilization. Market pricing remains strong with high tender activity in 2D and 3D segments.
The document provides an agenda and materials for a Polarcus Limited investor presentation covering highlights, financials, operations, and market updates. Key points include revenues of USD 275.3 million for the first half of 2013, up 28% from the prior year. The balance sheet was strengthened through refinancing at a reduced average interest rate of 7.1%. Operational performance showed technical downtime below 5% and completion of a large multi-client project. The company also discussed ongoing legal matters and shareholder information.
Oceanteam Shipping ASA is an Oslo Stock Exchange listed shipping company that operates a fleet of large construction support vessels and provides engineering services. The company's CEO is Haico Halbesma and CFO is Torbjørn Skulstad. Oceanteam presented at the Pareto Conference in Oslo on September 4, 2013, providing an overview of the company, its finance structure, recent financial performance, and positive market outlook for large deep-water vessels.
BW Offshore is an experienced FPSO (floating production, storage and offloading vessel) operator with 16 FPSOs and 1 FSO currently in operation. It has a global production of 700,000 barrels of oil equivalent per day and a strong safety record with a low lost time injury rate. BW Offshore has a $7.8 billion contract portfolio and significant potential for growth through existing assets and new projects. It aims to create value through contract extensions, redeployments of existing FPSOs, and potential new contracts.
This document provides an overview and summary of Atwood Oceanics for investors attending the 20th Annual Oil & Offshore Conference. It summarizes Atwood's strategy of modernizing and expanding its fleet through newbuild rig deliveries from 2011-2015. This will provide a younger fleet of ultra-deepwater floaters and high-spec jackups. The summary also outlines Atwood's strong safety and operating performance, revenue efficiency, and focus on superior shareholder returns. Key details include $3.9 billion in contracted backlog through 2016 and funding for remaining capital expenditures of $1.4 billion through operating cash flows and credit facilities.
The document reports Globus Maritime's financial and operating results for the second quarter and first half of 2013, showing improvements in adjusted EBITDA and average daily TCE rates compared to the same periods in 2012, along with details on fleet deployment and market conditions. It also provides statements of comprehensive income, financial position, cash flows, and bank debt developments.
Golar reported net income of $59.0 million for Q2 2013, including a non-cash gain of $47.9 million. EBITDA was $8.2 million for the quarter. Underlying dividends received from Golar LNG Partners increased to $16.0 million from $14.4 million in Q1. Two vessels entered layup due to volatile spot market conditions. Golar has secured $1.1 billion in funding for 8 newbuilds and concluded two 10-year FSRU charters. Cash flow from operations and dividends from Partners will help fund the remaining $720 million of the $2.74 billion newbuild program. The LNG shipping market outlook remains supported by
Golar LNG Partners reported second quarter 2013 results with net income of $28.0 million and operating income of $44.4 million. They generated distributable cash flow of $26.4 million for the quarter and declared a quarterly distribution of $0.515 per unit. Recent events included completing drydockings and refinancing two vessels. Near and medium term growth opportunities include potential acquisitions of the FSRU vessels Igloo and Eskimo which have been awarded long term contracts by Golar LNG in Kuwait and Jordan respectively.
The document summarizes Seadrill's second quarter 2013 conference call. Key highlights include:
- Seadrill generated a record $665 million in EBITDA for Q2 2013.
- Economic utilization of floaters increased to 94% from 92% last quarter.
- Net income was $1.75 billion and earnings per share was $3.68.
- The quarterly cash dividend was increased to $0.91 per share.
Lamprell reported interim results for the first half of 2013, showing a return to profitability. Revenue was broadly flat at $521 million compared to the first half of 2012. Profit before tax was $10.1 million, compared to a loss before tax of $50.8 million in the same period last year. The company secured a new $181 million refinancing facility that matures in 2016. Operationally, several key projects were successfully delivered in the first half and the company's order book stands at $1.1 billion with a bid pipeline of $4.6 billion.
- Seadrill Partners reported net income of $22.1 million for Q2 2013 and generated distributable cash flow of $15.8 million.
- They completed the acquisition of tender rig T-15 from Seadrill Limited for $210 million.
- Seadrill Partners has opportunities for further growth through potential dropdowns of additional rigs from Seadrill's fleet of $15.4 billion in contracted backlog.
The document is a corporate presentation by ASL Marine for FY2013. It provides an overview of ASL Marine's business segments which include shipbuilding, shiprepair and conversion, shipchartering, and engineering. For FY2013, key highlights included revenue increasing 19% to $465.4 million driven by higher shipbuilding activity. Gross profit rose 47% to $83.6 million and net profit increased 40% to $45.3 million. The presentation also reviews each business segment's financial performance for FY2013 and 4Q FY2013.
This document discusses Frontline's Q2 2013 results and provides an outlook. Some key points:
- Frontline reported a net loss of $120.3 million for Q2 2013, which included a $81.3 million vessel impairment loss. Excluding impairment, the net loss was $39 million.
- Average VLCC spot rates increased to $8,000 per day in Q2 from $1,250 in Q1, while average Suezmax spot rates fell slightly to $11,500 from $12,500.
- Frontline's fleet consists of 48 vessels, including two Suezmax newbuildings with remaining payments of $87.9 million. The company expects VLCC cash breake
Ship Finance International Q2 2013 results presentationTradeWindsnews
Ship Finance International reported its 2Q 2013 results on August 28, 2013. Net income for the quarter was $25.1 million, with aggregate charter revenue of $153.7 million. The company invested nearly $1 billion in new projects during the quarter, including a $600 million acquisition of a harsh environment jack-up drilling rig under long-term charter. Ship Finance has a $5.8 billion charter backlog and $261 million in total available liquidity as of the end of the quarter.
Höegh LNG presented financial results for the second quarter of 2013. Total income was USD 51.3 million, though EBITDA declined to USD 7.3 million due to higher construction contract expenses. All four new FSRUs under construction remain on time and on budget for delivery between February and June 2014. Höegh LNG was also awarded pre-FEED studies for a North American FLNG project and an Asian offshore FLNG project.
KNOT Offshore Partners LP reported results for the second quarter of 2013 following its initial public offering in April 2013. The company generated net income of $4.0 million, operating income of $7.4 million, and Adjusted EBITDA of $12.7 million for the quarter. It declared a distribution of $0.3173 per unit and acquired the company owning the Carmen Knutsen shuttle tanker for $145 million less existing debt of $89 million in August 2013. Management recommended increasing distributions by 6 cents per quarter starting in the third quarter of 2013, representing a 16% increase.
2. Contents
introduction........................................................................................................ 3
the shipping environment ................................................................................. 7
the shipbuilding market .................................................................................. 12
the tanker market ............................................................................................ 16
the dry bulk market ......................................................................................... 21
the container ship market .............................................................................. 26
the car carrier market.................................................................................... 28
the lng market................................................................................................... 29
small-scale lng................................................................................................. 30
the demolition market...................................................................................... 31
mobile offshore drilling units...................................................................... 32
the offshore support vessel market............................................................ 35
the offshore contruction vessel market..................................................... 38
Offshore Wind .................................................................................................. 40
rs platou markets............................................................................................. 42
rs platou finans................................................................................................ 45
rs platou real estate........................................................................................ 48
statistics............................................................................................................. 50
Contacts.............................................................................................................. 56
Cover photo: Farstad Shipping
3. Shipping & Offshore:
Shaping the world of energy
Shipping Offshore
Commercial shipping companies transport 90 percent of global The recent tragedy at the gas produc-
goods by weight and volume. Considering its importance, if the tion facility in Algeria brought home
world was just ONE country, shipping would most likely have the vulnerability of onshore installa-
been a public utility! tions in North Africa and the Middle
East when it comes to terrorist at-
Instead, private owners and capital dominate international tacks. The Arab Spring has turned into
shipping. It is up to them to solve the logistical challenges that a shaky Winter, as unrest continues to
arise in our constantly changing markets. spread and escalate in this important
energy- exporting region.
For example, there is currently an intense debate in the US
Congress over whether to approve exports of (shale gas) LNG Some oil company executives believe
from the US. The Department of Energy has approved several offshore energy production is easier to
LNG export licenses, but the majority of Democrats, and quite defend from terrorist attacks, than for
a few Republicans, would like to keep this “new” gas inside na- example onshore installations in North
tional borders. Africa and the Middle East.
Meanwhile, independent ship owners have ordered additional There was a succession of major off-
LNG tonnage in anticipation of US exports from 2015/16. The shore discoveries during 2012 and we
world needs all the energy it can get from politically low-risk continue to believe in increased ac-
countries, so it is important that Washington does not ham- tivity for offshore rigs in general and
string oil and gas exploration and production in the US. The ultra-deep water rigs in particular. The peter m. anker, Managing Partner & CEO
country’s stunning transformation from the world’s biggest im- growth in demand for subsea construc-
porter of petroleum products to its (almost) biggest exporter, tion vessels will continue to accelerate in the years to come. The
feeding the emerging economies in Latin America and Africa, fleet is not only growing by numbers, but also by complexity
is a case in point. of the vessels. We are entering into the development phase of
many deep water projects that demands larger subsea structures
The prospect of serious long-haul LNG volumes coming out of and more complex installation operations.
Canada also looks very promising. It raises the question, could
Canada be the new Qatar of the Americas? Conclusion
While the world has been focused on various macroeconomic cri-
The first quarter of 2013 is characterized by a mixture of signifi- ses during the last few years, the energy markets have undergone
cant uncertainty and opportunity for shipowners and investors. dramatic changes in supply and trading patterns ‘under the radar’.
The markets are in a bottom cycle, with second hand and new
building prices at cyclically low levels. At the same time, the We believe these changes will become much clearer once the
world economy is showing some potential for a strong recovery world economy picks up steam, and could offer positive sur-
soon, and new fuel-efficient designs are an added incentive for prises for both the shipping and offshore markets.
calling the shipyards. Taking this into consideration, we may
well see a nascent recovery in most shipping markets in 2014 Yours Sincerely,
and 2015. Peter M. Anker,
Managing Partner & CEO, RS Platou ASA
introduction 3
4. OSLO
ABERDEEN
LONDON
NEW YORK
GENEVA
HOUSTON
RIO DE JANEIRO
ACCRA
4
5. THE WORLD ACCORDING TO RS PLATOU
the world according to RS Platou
MOSCOW
SHANGHAI
DUBAI
SINGAPORE
PIRAEUS
SYDNEY
CAPE TOWN MELBOURNE
PERTH
SHIPBROKING OFFSHORE INVESTMENT BANKING PROJECT FINANCE
5
7. the shipping environment
World shipping 2012;
Down, but not out
2012 turned out to be just as difficult for the shipping markets as we feared it would be. The performance of the world economy was even
weaker than reflected in downbeat expectations at the start of the year, while fleet expansion remained above any reasonably sustainable
long-term growth trend for the fourth consecutive year. Despite another stellar performance from the LNG market and a modest tightening
of the tanker market, capacity utilization for the world’s merchant fleet fell by an estimated 1 percentage point to 84 percent, the lowest
level since the full force Financial Crisis hit in 2009.
Nevertheless, the past year was not without bright spots, despite the fascinating complexities of tonnage demand. Most notably,
the very challenging conditions for many segments. Most obvi- there were significant shifts in transportation distances for both
ously, the fact that both the tanker and dry bulk freight markets tankers (longer) as well as dry bulk (moderately shorter), while
saw periodic rallies through the year is a clear indication that the markedly longer distances seen in the LNG market in 2011
the level of over-capacity is relatively moderate, compared to were sustained in 2012. Furthermore, fleet productivity fell in
what was seen in the 1970s and ‘80s. This is partly due to ton- response to higher bunker prices and increased average vessel
nage demand having enjoyed a surprisingly strong year despite size. Lastly, it was a big year for inventory swings with both tank
an overall weak world economy, as the increased weight of the and dry bulk seeing bigger than normal inventory related trade
commodity intensive non-OECD economies offset weaknesses movement in response to geopolitical factors (tank) and rela-
in the OECD. tive commodity prices (dry bulk).
Another important development was the continued sharp de- Another year of above-trend fleet growth,
cline in the fleet orderbook which declined from 20 percent of but delivery pipeline is emptying
the fleet a year ago to 14 percent at the end of 2012, as new or- The world’s merchant fleet continued its pattern of robust
ders fell to a decade low. Whatever the reasons for this – more growth, adding another 7.8 percent, only slightly less than the
prudent owners, insufficient cash flow, continued challenging record 8.2 percent seen in 2011. This marked the eighth con-
financial conditions – the fact that fleet capacity is responding secutive year where growth exceeded 7 percent. The contribu-
rationally to market conditions raises hope that the industry tors to growth were widely spread among key segments, with
will avoid a repeat of the protracted structural downturn seen dry bulk in front at 12.6 percent and LNG carriers in the back at
in the past. a modest 1.4 percent, which made that segment the place to be
for the second straight year.
Tonnage demand slowed less than the
world economy Overall fleet utilization dropped by
2012 was yet another year dominated by crisis headlines on the 1 percentage point to 84 percent
economic front, as the Euro Crisis not only rolled on but gath- A sizable 4 percent drop in dry bulk fleet utilization, the larg-
ered in strength through the first half of the year. Despite world est segment of the merchant fleet, dragged down overall fleet
GDP growth coming in at a lackluster 3.2 percent, tonnage de- capacity utilization. The container fleet also contributed to
mand registered a healthy rise of 7.1 percent, down from 7.7 this decline, while improvements for the LNG, car carrier and
percent in 2011. The year gave us important demonstrations of tanker segment moderated the drop.The level of 84 percent uti- ➤
THE SHIPPING ENVIRONMENT 7
8. lization is nonetheless weak. According to our records it is the erage earnings rose from $14,800 per day in 2011, to $17,100
second lowest level seen in the past decade, although it is still per day in 2012.
well above the bottom level of 82 percent, seen in 2009.
Dry bulk in 2012: Substantial drop in freight
Asset values continued falling but rate of rates
decline eased Market fundamentals deteriorated further during 2012 caused
It was yet another year of falling asset values, but the pace of by another year with record high deliveries. Even though scrap-
decline slowed and the performance across sectors was more ping also rose to the highest level registered, the net fleet ex-
varied than in 2011. The least variation was seen in newbuilding pansion was above 12 percent from the year before. Despite
prices, which fell across the board by 5 - 10 percent for most size weaker global economic growth, tonnage demand increased
classes. Secondhand values declined as well, due not only to the by a healthy 7 percent thanks to China, which utilized huge ar-
weaker freight market but also because of the emergence of fuel bitrage in iron ore and coal prices, importing much more dry
efficient newbuildings, a possibly important shift in shipping bulk commodities than the underlying demand for steel, energy
technology and design. Values declined, with dry bulk vessels and so forth would suggest. However, the fleet utilization rate
recording significant declines of 20-30 percent, tankers fell by dropped from 87 percent in 2011 to 83 percent in 2012, and this
5-10 percent. It was the fourth straight year of declining asset caused a drop in freight rates of between 40 and 50 percent and
values, and accompanied by poor cash flows it put the indus- in ship values by 20- 30 percent.
try’s balance sheets under further, severe pressure.
The container market in 2012: Box rates and
Tankers in 2012: Little relief, despite demand timecharter rates part company
boom The container ship market in 2012 was characterized by higher
The tanker market experienced some improvement, although average box rates than in 2011, but substantially lower char-
this was unevenly spread between segments and seasons, dem- ter rates. Operators managed to raise the utilization rate, and
onstrating the fragile nature of this market. The good news was thereby freight rates, of the operating fleet by idling more ton-
an estimated 8 percent spike in tonnage demand. This was due nage and creating a higher demand increase through lower fleet
to a combination of increased volume growth and longer dis- productivity. Non-operating owners faced a very difficult year
tances as importers rushed to cover the loss of Iranian oil. Pro- as liners had limited need for the chartering of extra tonnage.
ductivity also fell, as it did for all other segments. These factors Total container ship capacity increased by 7.7 percent, while the
boosted the crude market during the first months of the year, operating fleet grew by 4.5 percent. Tonnage demand is estimat-
and the clean market during the last months. The period in be- ed to have escalated by around 7 percent, with 5 percent higher
tween, on the other hand, was dismal, with most crude carriers trade volume and a drop of 2 percent in fleet productivity. The
in particular consistently trading at, or below, operating costs. low growth in container movements was related to a drop of 3
Fleet growth remained high at 7.2 percent, which prevented any percent in European containerized imports.
sustained increase in rates. For the year, our Tanker Index of av-
tonnage demand growth World merchant fleet 2003–2012
vs world economic growth 2003–2012 Annual Changes
Tonnage demand growth world merchant fleet, annual changes in percent Percent
12 9
10
10 04 8
03 07
8 7
11 06
12/08
6 05 6
5
4
4
2
3
0
2
-2 09 1
-4 0
-1 0 1 2 3 4 5 6 03 04 05 06 07 08 09 10 11 12
World output growth
8 THE SHIPPING ENVIRONMENT
9. LNG in 2012: Longer and stronger World economy and world shipping
The LNG shipping market tightened further during 2012 de- 2012 was not a good year for the world economy with, growth
spite the fact that demand growth slipped into single digits for slipping to little more than 3 percent, the lowest level for a de-
the first time in seven years. The 6 percent growth in tonnage cade, barring the Financial Crisis. Under these circumstances,
demand was mainly due to longer average distances, as the it came as no surprise that the year also witnessed a slowdown
inter-basin trade from the Atlantic to the Pacific continued to in tonnage demand growth. That said, growth of 7.1 percent
expand. Trade volume, in fact, declined by 1 percent. Lower was better than might have been expected, as it represented
fleet productivity also contributed to the demand increase. a more moderate slowdown than that experienced by GDP.
Productivity fell by an estimated 2 - 3 percent owing to high While there were some special situations, as always, we view
bunker prices and increased average vessel size. The LNG fleet this relatively strong performance in trade growth as a con-
grew only 4 percent and thus lifted the fleet utilization rate to 95 firmation of the changing, and more shipping intensive,
percent, which resulted in an average spot rate of $125,000 per composition of the world economy. The commodity inten-
day, up from $93,000 per day in 2011. sive non-OECD economies are increasing in size in relation
to the mature, service-oriented OECD economies. Based on
Car carriers: Uneven improvement the IMF’s current forecasts the former group is on course to
The car carrier market has seen another year of fluctuations in overtake the latter in absolute size, in 2013. This long-term
tonnage demand. 2012 started off well with export volumes trend will underpin overall shipping demand in the years
rising from the recovery of the Japanese automobile industry, to come and gives reasons for optimism regarding recovery.
strong Korean exports and growing US auto sales. However, the The increasing weight of the non-OECD economies was ably
Euro crisis took its toll on European car sales and along with demonstrated this year by the extent to which mere inventory
strikes in Korea, contributed to a fall in export volumes dur- swings in iron ore and coal in China moved the entire dry bulk
ing the second half of the year. Due to reasonably modest fleet market.
growth, the average market balance improved somewhat from
2011, climbing to an estimated 84 percent fleet utilization rate. Status and prospects for the world economy
Prospects for tonnage demand going forward depend heavily 2012 began with forecasters in a downbeat and highly uncer-
on the economic development in key sales markets, as well as tain mood, after 2011 turned into yet another false dawn for the
the possibility of relocation of car production from Japan to world economy. Most notably it became clear that politicians
overseas markets as a result of the strong Yen. were still behind the curve in the Eurozone crisis. In addition, ➤
THE SHIPPING ENVIRONMENT 9
10. the US seemed unable to move out of its 2 percent sluggish anything, falling farther behind the curve. It took a more prag-
growth rate range, regardless of any kind of monetary stimulus matic approach from the ECB with regards to supporting the
thrown at it, while, in the face of all this, China (as well as other region’s bond markets, in order to nudge politicians into agree-
emerging markets) was showing signs of a significant slow- ing on several difficult issues, including debt write down and
down. Forecasters turned out to be relatively accurate in their continued restructuring of the most fragile economies. That in
downbeat view of the world economy, as (preliminary) full year turn improved market sentiment regarding the risk of a breakup
growth figures show an estimated 3.2 per cent increase, not too of the entire Eurozone.
far off the 3.3 percent forecast at the start of the year. Prospects
for 2013 are for a moderate pickup in growth but this will still The troubles in Europe shielded the US from the storm for most
be below the long-term trend. of the year, but the country’s tepid, and disappointing, growth
of around 2 percent slowed further in the fourth quarter, as poli-
The challenges for the world economy differ between the ma- ticians battled over how to avoid the Fiscal Cliff of automatic
ture economies of the OECD and the ‘growth’ economies of tax hikes and spending cuts. Although a last minute deal was
the non-OECD. The former group is struggling with the very reached, unsurprisingly, no fundamental problems were solved
difficult combination of reducing national debts and deficits, and the challenges of dealing with the deficit and national debt
while at the same time avoiding a relapse into recession, mak- are set to re-emerge in 2013.
ing that very task next to impossible. Emerging economies, on
the other hand, are feeling some growth pains from their force- Emerging markets became emerging
ful response to the Financial Crisis, which boosted inflationary risks to growth
pressures in the respective economies via higher commodity A year ago, we discussed the risk of a slowdown in emerging
and property prices. markets and the impact on tonnage demand. The scenario
turned out to be all too realistic, as 2012 featured a broad based
The more positive sentiment visible at the start of 2013 can be slowdown across-the- board in such countries: China’s growth
attributed to two main factors. Number one, that key econo- slowed from 9.5 percent in 2011 to a run rate of 7.5 percent in
mies were pushed to the brink in 2012 – and survived. Sec- 2012. India slowed from 7 percent to 5 percent; Brazil from 4
ondly, leadership changes in the world’s two largest economies percent to 1 percent; and Russia from 5 percent to 4 percent.
went smoothly, reinforcing the notion that the leaders in the US The combination of tighter monetary policy, due to budding
and China are firmly committed to sustained and uninterrupted inflationary pressures in recent years and weaker export mar-
growth. kets, had visible effects and combined to bring GDP growth for
the group classified as ‘developing economies’ below 6 percent
Europe and the US: Muddling through for only the second time in a decade. This, unsurprisingly, had a
In terms of ‘stress tests’, Europe was in the spotlight, as talk of a negative impact on trade growth due to the commodity inten-
‘Grexit’ increasingly dominated the front pages, while, for every sive nature of these economies.
new ‘crisis’ meeting, it became clear that the politicians were, if
ANNUAL GROWTH IN REAL GDP
world seaborne trade and economic growth 1970-2012
Percentage change from previous year
Index 1970=100 Jan 2012 Jan 2013 Jan 2013
500 World output Forecast Estimates Forecast
450 2012 2012 2013
Seaborne dry trade
USA 1.8 2.3 2.0
400 Seaborne oil trade JAPAN 1.7 2.0 1.2
350 EURO AREA -0.5 -0.4 -0.2
C AND E EUROPE 1.1 1.8 2.4
300 RUSSIA 3.3 3.6 3.7
250 CHINA 8.2 7.8 8.2
INDIA 7.0 4.5 5.9
200
ASEAN 5.2 5.7 5.5
150 M EAST AND N AFRICA 3.2 5.2 3.4
SUB-SAHARA AFRICA 5.5 4.8 5.8
100
L AMERICA 3.6 3.0 3.6
50 70 72 74 76 78 80 82 84 86 88 90 92 94 96 98 00 02 04 06 08 10 12 WORLD 3.3 3.2 3.5
Source: IMF
10 THE SHIPPING ENVIRONMENT
11. Signs of encouragement as 2013 got underway tone in the world economy, discussed above, is obviously a very
The improvement in sentiment seen at the start of 2013 reflects important factor. The ability for the world economy to influence
stronger underlying data. The biggest, and for shipping, most shipping must in turn be seen against the backdrop of current
important, change is in China. When the economy first began overcapacity conditions that are far more moderate than in the
to slow authorities appeared hesitant to do anything to stimu- dark days of the 1980s. The various freight markets’ demon-
late growth, most likely worried about the lingering inflationary strated ability to respond to changes in trading conditions during
pressures which came as a result of the truly giant stimulus pack- 2012 is a key sign in that regard. The most positive surprise may
age in 2009. However, in September another stimulus package have been on the supply side of the market, however, which has
was revealed and, combined with a softening of banks’ capital responded very rationally to the weak business climate by sharply
requirements, this led to an improvement in the tone of the eco- reducing new orders. The overall orderbook thus fell steadily and
nomic data. ended the year at 14 percent of the fleet, the lowest relative level
in fifteen years and down from 20 percent a year ago.
In the US, the severely deflated housing market gradually im-
proved through the year and, combined with continued growth Finally, the structure of the world economy continues to be-
in the auto and energy producing industries, overall labor mar- come more shipping intensive. Chinese import growth re-
ket conditions began to show signs of more consistent improve- mained close to GDP growth, even during a year of slowdown.
ment late in 2012. Furthermore, the size of the economy is such that even tactical
considerations, like stock building and/or arbitrage inspired
Expectations for the world economy in 2013 are muted. Growth trades, can move entire markets. Also, the shale energy revolu-
is expected to nudge up to 3.5 percent, still well below its long- tion in the US has contributed to a net rise in shipping activity,
term potential. However, calmer financial markets signal an im- by raising the country’s exports of refined oil products and coal
provement in overall business and consumer confidence - vital (and, soon, LNG), while also contributing to longer trading dis-
factors when it comes to making investment decisions that pro- tances for crude oil.
mote growth and employment. The relative stability of the oil
market, despite the fact that the 2012 average price for Brent Market conditions are likely to remain difficult in 2013 for the
was the highest on record - also contributed to a moderately segments that struggled in 2012. However, we believe there are
improved growth situation and the hope that the worst is over. good reasons to hope that shipping has retained its cyclicality
through this difficult period, and will be able to share the fruits
Shipping market prospects: of any improvement in the world economy, once it arrives, rela-
Cyclicality is not dead tively quickly.
On the face of it, there seem to be few reasons to expect much
improvement for world shipping markets in 2013. However, we Ole-Rikard Hammer
believe there are reasons to think that a change is, if not in the Head of Research
air, certainly visible on the horizon. The cautiously improved RS Platou Economic Research
GLOBAL ECONOMIC GROWTH 2003-2013 supply, demand and utilization rate 1990-2012
Forecasts and actual growth rates World merchant fleet
Percent change Mill cgt Utilization rate
6 Forecast 500 130 Supply
Actual Demand
5
400 120 Utilization rate
4
3 300 110
2
200 100
1
100 90
0
-1 0 80
2003 2004 2005 2006 2007 2008 2009 2010 2011 2012 2013 90 91 92 93 94 95 96 97 98 99 00 01 02 03 04 05 06 07 08 09 10 11 12
Source: IMF (Forecast per Oct. the year before)
THE SHIPPING ENVIRONMENT 11
12. the shipbuilding market
Building prices at
a ten-year low
Ordering activity fell by 30 percent in 2012, for the second year in a row. The main issues were slower economic growth and
high fleet growth in most shipping segments, resulting in low freight rates and thus lower demand for newbuildings.
The level of new orders amounted to less than 50 percent of our carriers and container ships. However, based on a freight in-
estimated building capacity at the time of delivery. This resulted dex of $13,000 per day in 2012, we would have expected a
in a continued decline in average delivery time and, as a con- higher ordering activity than the 16 mill cgt recorded. An-
sequence, downward pressure on newbuilding prices. During other factor that affected demand was the availability of capi-
2012, our newbuilding price index fell by 12 percent and ended tal. The banks have become quite restrictive for new loans to
at the lowest level seen in ten years measured in real terms. shipowners.
Demand for new tonnage We have roughly estimated that owners invested 30 bill USD
Demand for newbuildings was slow in the first half of 2012, with in conventional ships in 2012, a significant reduction from the
only 3 mill compensated gross tons (cgt) of new orders regis- previous year’s 50 bill USD.
tered per quarter. During the second half of the year, the order-
ing activity picked up to above 5 mill cgt per quarter, which was Chinese shipyards were awarded 40 percent of all orders this
still significantly below the estimated quarterly building capac- year, closely followed by the Koreans, who took 38 percent. A
ity of 8 to 9 mill cgt. third of all new orders in China were from domestic owners,
while in Korea the share was only 10 percent. Japanese yards
The ordering activity has historically been closely correlated took 15 percent of the orders, of which three quarters were from
with our freight rate index based on earnings for tankers, bulk domestic accounts.
building prices for bulk carriers 2003–2012 building prices for tankers 2003–2012
Mill $ Mill $
100 Capesize 170 VLCC
90 Panamax Suezmax
150
Handymax Aframax
80
130 MR Clean
70
110
60
90
50
70
40
30 50
20 30
10 10
03 04 05 06 07 08 09 10 11 12 03 04 05 06 07 08 09 10 11 12
12 THE SHIPBUILDING MARKET
13. TankerS Korean yards have traditionally been the dominant builder in
During 2012, we registered 15 mill dwt of new orders for tank- this segment, but in 2012 Chinese yards secured 53 percent of
ers, representing a 40 percent increase from 2011 - a much high- all new orders, while Korea took 38 percent.
er growth rate than the 17 percent seen in our tanker rate index.
The shipyards delivered 32 mill dwt and towards the end of the lng
year the orderbook amounted to 51 mill dwt, representing 10 LNG was a segment where freight rates reached historical high
percent of the existing fleet. levels in 2012 and, subsequently, the demand for new tonnage
remained high. This year we registered 33 new orders and, since
In 2012, Korean and Chinese shipyards maintained their 60 and only two vessels were delivered, the orderbook grew significantly.
30 percent respective market shares in the tanker segment, while It ended the year at 92 vessels, or 27 percent of the existing fleet.
Japan took 8 percent of the orders measured in dwt. A new fea-
ture this year was the fact that Korean owners were the most ac- Korean shipbuilders were awarded 76 percent of all new LNG
tive and were responsible for 16 percent of all new contracts. carrier orders.
bulk CarrierS building CapaCiTy
The number of bulk carriers ordered in 2012 declined by almost The trend in deliveries of tonnage, measured as a 12 months
40 percent from the year before - in line with the decline in freight moving average, held fairly steady at a level of 4 mill cgt per
rates - and was tallied at 19 mill dwt. During the year, 98 mill dwt month from the middle of 2010 to half way through 2012.
was delivered and at the end of 2012 the orderbook amounted to Deliveries peaked in June 2012, due to the fact that all new ves-
105 mill dwt, equivalent to 14 percent of the existing fleet. sels delivered after 30 June had to be in compliance with IMO’s
Performance Standard for Protective Coating (PSPC) for bal-
Chinese shipbuilders were again the most active in this segment last water tanks. During the second half of the year, deliveries
in 2012, securing 59 percent of all new orders. Almost all other declined to an average of 2.4 mill cgt per month.
contracts, 38 percent, went to Japanese yards. An estimated 21
percent of the orders came from Japanese owners, followed by If we compare the orderbook for each of the major shipbuilding
Greek and Chinese owners, who had a share of 13 and 11 per- countries at the beginning of the year to what they actually de-
cent, respectively. livered, the slippage (the ratio not delivered) in 2012 is surpris-
ingly similar to what we registered in 2011. Chinese yards deliv-
COnTainer ShipS ered 71 percent of the orderbook, while Korean and Japanese
Demand for container ships in 2012 declined to less than a yards were able to deliver 80 and 93 percent, respectively. In to-
third of the level seen in 2011 (in line with a subdued freight tal, 80 percent of the orders scheduled for 2012 were delivered.
market) and totaled 0.47 mill TEU. During the year, 1.25 mill
TEU was delivered from the shipyards and at the end of 2012 According to the orderbook, a further decline in deliveries in
the orderbook stood at 3.4 mill TEU, representing 20 percent the coming years should be expected. At the end of 2012, some
of the existing fleet. 32 mill cgt was due to be delivered in 2013, representing a 20 ➤
bUilding Prices for container shiPs 2003–2012 neW orders in mill cgt 2003–2012
Mill $ Mill cgt
120 6,000 teu 80 Others
110 4,500 teu LNG
70
100 3,000 teu
Container
90 1,700 teu 60
Bulk carriers
80 1,000 teu 50 Tankers
70
40
60
50 30
40 20
30
10
20
10 0
03 04 05 06 07 08 09 10 11 12 03 04 05 06 07 08 09 10 11 12
the shipbuilding market 13
14. percent decline from 2012. As we assume that some slippage The steelplate price varies from country to country, and for a
will also take place in 2013, we expect the decline in deliveries typical Aframax tanker in Korea this has resulted in an 8 mill
to be even more than the 20 percent indicated by the orderbook. USD reduction in direct steel costs.
Slippage per segment The price for main engines has remained at a very low level, as
In the tanker segment, the orderbook at the start of 2012 there has been a huge overcapacity in the production of main
indicated that 45.6 mill dwt was due to be delivered that year. A engines since 2008. In Korea, engine prices have maintained a
tally at the end of the year showed that only 31.9 mill dwt was level of about 185 USD per BHP from the previous year, while
actually built. The difference can be explained by the fact that the prices in China have been recorded at even lower levels.
orders amounting to 11.1 mill dwt were postponed, 4 mill dwt
cancelled or converted to other ship types, and 1.5 mill dwt of The development of a shipbuilder’s currency against the dollar is
‘new’ contracts were delivered. also an important aspect of the building cost. During 2012, the
Chinese Yuan remained almost unchanged against the dollar,
According to the dry bulk orderbook, in early 2012 we expect- while the Korean Won strengthened by some 8 percent. There
ed 138.8 mill dwt to enter the market that year. The amount of was relief for Japanese builders, as the Yen weakened 13 percent
tonn ge actually delivered amounted to 97.6 mill dwt, as 33.6
a against the dollar towards the end of the year.
mill dwt was delayed and 12.9 mill dwt was cancelled, removed
or converted. In addition, 5.4 mill dwt of completed vessels In total, we have estimated that overnight building costs re-
were not in the orderbook at the start of the year, and are there- mained almost unchanged during 2012, but were still around
fore registered as ‘new’ contracts. 20 percent below the record high level estimated for a Korean
builder in 2008.
The orderbook for container ships showed that 1.58 mill TEU
of capacity was due for delivery in 2012. At the end of 2012 Expectations for 2013
we recorded 1.25 mill TEU of actual deliveries. The residual The main driver of the shipping industry, world GDP growth,
amount can be explained by the 0.35 mill TEU postponed, 0.02 is expected to be marginally higher in 2013 than it was in 2012,
mill TEU cancelled and 0.43 mill TEU of ‘new’ orders that were namely 3.4 percent. Based on the historical correlation between
delivered in 2012. the world GDP growth and tonnage demand for the world mer-
chant fleet, we expect a healthy growth of 5-6 percent in demand
Building cost for 2013. We anticipate fleet growth at the same level, taking into
Newbuilding prices have been on a downward trajectory since account some delays and cancellations of orders, combined with a
the second half of 2008, caused by an overcapacity in the new- continued high level of removals. We therefore expect the utiliza-
building market and declining building costs. tion rate for the merchant fleet to remain at 84 percent in 2013.
This should result in freight rates below break-even in the major
Steel is one of the most important materials in shipbuilding and shipping sectors and thereby mitigate owners’ willingness to or-
from 2008 to 2012 our steelplate price index fell by 40 percent. der new ships. Another obstacle for owners who want to order
world market price for heavy steel plates 2003–2012
10 mm+
$/ton
DELIVERIES, NEW ORDERS AND ORDERBOOKS BY VESSEL TYPE 1,400
1,200
New Order Percent
Deliveries orders book of fleet
Type Capacity 2012 2012 end 2012 end 2012 1,000
Tankers Mill. dwt 31.4 14.2 49.4 10.7
Bulk carriers Mill. dwt 97.6 18.6 105.4 16.1 800
Container ships Mill. teu 1.25 0.5 3.4 21.0
LNG Mill. cbm 0.03 5.1 12.6 27.0 600
LPG Mill. cbm 0.6 1.5 2.5 12.7
Car carriers 1,000 cars 209 986 273 7.4 400
Chemical carriers Mill. dwt 0.5 0.9 1.6 4.4
Cruise 1,000 berths 16.1 18.3 74.3 14.8 200
03 04 05 06 07 08 09 10 11 12
14 THE SHIPBUILDING MARKET
15. new tonnage is securing finance, as banks have become more roughly 35 mill cgt, within a couple of years as some shipbuild-
reluctant to finance projects without any charter commitments. ers will cease to exist and others will do their utmost to reduce
capacity in order to survive.
With low demand from the major segments, a higher focus may
be seen on smaller, industrial segments. We also see an increas- In conclusion, we therefore expect a continued downward pres-
ing interest in new eco-designed ships. However, all in all we sure on newbuilding prices in 2013. However, as the price level
expect total demand to remain subdued. According to our esti- at the end of 2012 is getting close to the variable cost level, we
mates, demand may reach 20 - 25 mill cgt in 2013. do not expect a significant drop in the already low prices, unless
there is a meaningful change in input prices or exchange rates.
Building capacity is expected to decline, as shipbuilders are
struggling in a low price environment. At the present price lev- Jørn Bakkelund
el, we have estimated that building capacity may be reduced to RS Platou Economic Research
the shipbuilding market 15
16. the tanker market
Spike in tonnage demand
offers only partial relief
Tanker freight rates improved in 2012 from the exceptionally weak levels of 2011. Statistics show a spike in tonnage demand, but the
majority of participants may not have felt it this way. We estimate that tonnage demand jumped by an exceptional 8 percent, but the
most tangible part of demand growth, trade volume, made only a modest contribution. Longer average distance and reduced productivity
were more important contributory factors. Continued high fleet growth, even higher than 2011, restricted the improvement in average
fleet utilization to a modest 1 percentage point, virtually all of it during the first half of 2012.
The year was split in two for the crude and the clean segments. disrupting refineries, locking up tonnage and rerouting trade
Crude tanker rates experienced a fairly strong start to the year, flows, a combination of factors that caused fundamentals to
particularly for VLCCs, as Saudi Arabia raised production and tighten further. Spot market rates rose markedly, particularly in
importers scrambled to build inventory and adjust to the EU’s the Atlantic Basin, but TC rates remained relatively stable.
pending embargo of Iranian oil. Once the market had made
these adjustments, tonnage demand growth slowed and freight For the full year, our tonnage-weighted Tanker Index of freight
rates for VLCCs and Suezmaxes immediately collapsed through rates rose from $14,800 per day to $17,200 per day, a rise of
the summer before experiencing a modest seasonal rebound in 16 percent. With the exception of Suezmaxes, which bore the
the fourth quarter. brunt of the decline in US imports, all segments contributed
to the increase. For the crude carrier segment, VLCCs saw the
The clean market experienced the opposite development: the largest improvement going from $15,000 to $21,000 per day, a
first half of the year was weak and uneventful but trade growth rise of 40 percent. Meanwhile, for clean tankers LR1 earnings
picked up in the second half as the rise in crude supply which rose more than 50 percent from $11,000 to $17,000 per day.
took place in the first half of the year passed through refineries.
Then, Hurricane Sandy hit the US East Coast in late October, Asset values still under pressure,
but some divergences
Vessel prices remained under pressure during the year. While
freight rates – single voyage 2003–2012 newbuilding prices fell across-the-board by 5 to 10 percent,
Crude carriers
trends in secondhand values were more mixed than in 2011.
1,000 $/day Values for modern VLCCs and Suezmaxes saw only moderate
200 VLCC declines, while prices for Aframaxes and smaller vessels fell by
Suezmax
a further 10 to 20 percent. Values for units 10 years and older,
Aframax
150
average freight rates $1,000 per day
100 Single voyage
2010 2011 2012
50 VLCC 34.8 14.9 20.9
Suezmax 28.0 16.7 14.7
Aframax 21.4 12.9 15.4
LR 2 product 16.2 12.5 14.3
0
03 04 05 06 07 08 09 10 11 12 MR product 8.9 11.3 13.0
16 THE tanker MARKET
17. which had been converging on scrap value, experienced some EU’s announcement in January that it would undertake an em-
improvement. bargo of Iranian oil effective from 1 July 2012 triggered a rush
to build inventories, notably in China. Oil prices jumped as the
A strong but uneven year for tonnage market refocused on the supply risk in an environment of low
demand growth spare production capacity. ➤
Tonnage demand rose markedly during the first months of the
year, but was unable to sustain this rate of growth, as the main
driver had been oil inventory building rather than consumption. Tanker market index 2003–2012
Annual averages (weighted by dwt)
Longer trading distances made a major contribution to tonnage 1,000 $/day
demand growth, increasing by an estimated 3 percent, com- 70
pared to trade growth of 1 percent. Average trading distances
60
lengthened to China and, particularly, to the US. The latter was
surprising, given the focus on reduced overall imports. How 50
ever, all of the reduction came from light, sweet oil imports, 40
mainly from West Africa, while long- haul imports from the
30
Middle East increased market share and allowed average dis-
tances to the US to rise by 9 percent ( January to September). 20
The shift still had important freight market consequences, how- 10
ever, as VLCCs benefitted at the expense of Suezmaxes.
0
03 04 05 06 07 08 09 10 11 12
Asian imports had yet another strong year, as China, Japan, In-
dia and Korea all increased imports. All countries, at least pe-
riodically, reduced imports from Iran and replaced these with tanker FLEET 2003–2012
increased imports from West Africa and Latin America. As a Average annual changes
result, average trading distances increased to this region, as well. Percent
8
Europe, on the other hand, reduced its average distances. In 7
contrast to the US, import volume increased, mainly due to
6
lower North Sea production, but the impact on ton-miles was
5
more than negated by the return of short-haul Libyan crude.
The Iranian embargo also allowed for increased shorter haul im- 4
ports from West Africa and Russia. 3
2
Reduced fleet productivity contributed to
1
demand growth
There were important developments in the opaque area of fleet 0
03 04 05 06 07 08 09 10 11 12
productivity. Most obviously, average fleet speed continued to de-
cline, falling by an estimated 0.5 knots, to 12 knots. Higher bunker
prices, particularly early in the year, caused a significant drop in freight rates – single voyage 2003–2012
optimal vessel speed. Changes in average vessel size and ballast Clean carriers
time also contributed. To surmise, we estimate that fleet produc- 1,000 $/day
tivity was reduced by an estimated 3 to 4 percent, which increased 90 85/110,000 dwt
tonnage demand by the same amount. For more details on this 80 70/85,000 dwt
and the complexities of fleet productivity, please see the enclosed 70 45,000 dwt
box article ‘Is the tanker market driven by fundamentals?’ 60
50
Oil market remained stubbornly tight 40
World oil production rose by 2.9 percent in 2012, the largest 30
increase since 2004. This easily overtook the increase in world
20
oil demand, which rose by only 1.1 percent, thanks to the weak
10
world economy. However, the increase in production failed to
0
dent prices, which remained stubbornly high for most of the 03 04 05 06 07 08 09 10 11 12
year. Brent averaged 113 USD per barrel, a record high. The
THE tanker MARKET 17
18. The increase in production was driven by Libya, but also by the In 2013 we predict relatively similar developments to what we
US. For the tanker market, the latter restricted the increase in forecast a year ago, but with the important caveat that it will be
seaborne trade to a moderate 1 percent, a smaller figure than more difficult to repeat the many positive surprises of 2012. We
might normally have been expected from the observed rise in expect tonnage demand growth to slow significantly, as OPEC’s
oil production. biggest producer, Saudi Arabia, already began to scale back pro-
duction in late 2012.
Fleet capacity growth: High, going on higher, but
orderbook drop continues Fleet growth will, finally, begin to slow, but probably not
Fleet growth developed in line with expectations and was, if any- rapidly enough to improve capacity utilization significantly
thing, somewhat faster than anticipated. Although newbuilding already this year. Deliveries should be lower than in 2012
deliveries fell to 31 mill dwt, down from the record 40 mill dwt and we also expect an increase in scrapping. However, both
in 2011, average fleet growth accelerated from 5.8 percent to 7.2 of these assumptions may prove tenuous. Deliveries will be
percent. This was due to the relatively low level of scrapping, less affected by slippage, both from 2012 and 2013. Meanwhile,
than 15 mill dwt. With single hull tankers having been removed scrapping has proved difficult to get off the ground, because
from the active fleet, the average age of the fleet has declined to of the relatively young fleet. We expect the volume to increase,
about eight years and there is thus a shortage of natural scrapping as more vessels are due for special survey from 2012 onwards.
candidates. A drop in scrap prices, combined with a moderate in- However, any positive sentiment with regards to an impend-
crease in asset values for the oldest vessels, as the freight market ing freight market recovery will also affect owners of older
improved, made scrapping decisions more difficult for owners. tonnage and possibly delay their scrapping decisions. We ex-
pect fleet growth to slow from 7 percent to less than 4 percent,
The real news was another year of exceptionally low ordering, 14 the lowest rate in four years.
mill dwt, far below the rate of deliveries, which caused the order-
book to decline further. The fact that yet another drop in new- China, Iran and the US capable of market surprises
building prices failed to attract more interest only serves as an in- Positive surprises are again more likely to come from the de-
dication of the tough financing conditions for shipping at present. mand side of the market. Chinese oil imports may increase
more than expected as the economy appears to be picking up
Given these developments, the tanker orderbook tumbled from steam, and, particularly, if plans for significant increases in re-
75 mill dwt to 49 mill dwt through the course of the year - the finery capacity go ahead. Likewise, any resolution to the Iranian
lowest level, relative to the size of the fleet, in twelve years. conflict would most likely increase the volume of seaborne oil
trade, at least temporarily.
Market outlook: Challenging 2013, but finally
some light at the end of the tunnel? On the negative side, if US production of light, tight crude con-
A year ago we said the market in 2012 would be ‘flat, but not tinues to beat expectations, seaborne imports will come under
the without potential for surprises.’ We outlined the potential further pressure. Global tanker demand will suffer unless the
for a restocking of oil inventories as a possible surprise scenario. displaced oil can find other markets with at least equal trans-
That indeed turned out to be the case, except to a much stronger portation distances or unless Middle East exporters to the US
degree than expected. can continue to increase their market share. ➤
deliveries and removals of tankers 2003–2012
Excluding chemical carriers world oil production and trade 2003–2012
Mill dwt MBD
50 55 Non-OPEC
Removals
45 production
Deliveries
40 World oil
45 trade
35
OPEC
30 production
25 35
20
15
25
10
5
0 15
03 04 05 06 07 08 09 10 11 12 03 04 05 06 07 08 09 10 11 12
18 THE tanker MARKET
19. IS THE TANKER MARKET DRIVEN BY FUNDAMENTALS?
Analysts are not only struggling with the prospects for the tanker results in a market-dependent decline in productivity, which is
market, they are also working hard to explain the past. The tanker a part of the overcapacity to be measured. Normally, an increase
fleet is now 42 percent larger than in 2005, while seaborne trade, in in bunker prices also leads to lower speed, but we regard this as a
terms of volume, is up only 6 percent. In 2005, we estimated the utili- structural drop in productivity. In other words, an increase in bun-
zation rate for the tanker fleet to be close to the 90 percent we regard ker prices at a constant dollar rate will lead to slower speed and the
as full capacity utilization. On this basis, we should apparently have need for more tankers to carry out the same transportation work.
had a huge overcapacity of 20-25 percent this year, with permanent Speed is the most complicated element to handle when estimating
lay-up rates as a consequence. Even if 2012 definitely was a difficult overcapacity. Interested readers can find more about speed optimi-
year for tanker owners, it was not that bad. We now estimate the zation in RS Platou Monthly, March 2012.
overcapacity in 2012 to have been 6-7 percent, which we describe as • Another (structural) productivity element is the load factor,
moderate, not in the neighborhood of what we experienced in the defined as the cargo size divided by the deadweight ton of a vessel.
1970s and 1980s (see chart). The current overcapacity could be de- There has been a consistent trend over many years towards larger
scribed as a typical cyclical one, not the type of structural overcapac- Aframaxes, Suezmaxes and VLCCs, while the cargo sizes have
ity tanker owners fought against some decades ago. been more or less unchanged. This means that we need more dead-
weight tons to take the same cargo as before. We have estimated
This gives us reason to ask if the tanker market is now decoupled that this element has reduced the productivity of the fleet by 0.6
from fundamentals? We believe not. The simple comparison be- percent per year, over the last 10 years.
tween the change in the fleet and the change in trade volumes does • The ballast factor describes the share of days in ballast compared
not tell the whole story. There are obviously a number of additional with the total days at sea. Significant and rapid changes in the
factors. Let us try to explain: worldwide trade pattern normally lead to more repositioning of
the fleet, more ballast days and consequently lower (structural)
• Transport distances According to our estimates, average dis- productivity. In the last few years, the stop and go of Libyan
tances increased by 8 percent from 2005 to 2012, resulting in a exports, the sharp drop in exports from Iran and the drastic cuts
14 percent increase in ton-miles in the same period. in US oil import are typical drivers of more ballasting and reduced
• Floating storage employment Over the period from 2005 to productivity.
2012, there have been several years with significant use of tank-
ers for storage purposes, in addition to their traditional trading Our analysis points to a decline of 13 percent in (structural) produc-
employment. tivity and a tanker demand growth of 32 percent from 2005 to 2012,
• Fleet productivity factors These factors are the most challenging compared to the tiny 6 percent growth in seaborne oil trade volumes.
to identify and estimate. Normal productivity can be defined Thus we ended up with a utilization rate in 2012 of 83.5 percent - or
as the number of ton-miles produced per deadweight ton, per an overcapacity of 6.5 percent - a level quite in line with freight mar-
year, at a 90 percent utilization rate. Since our goal is to measure ket conditions in 2012.
the utilization rate of the fleet, we have to differentiate between
market-dependent changes in productivity and structural Erik M. Andersen
changes. For example: In a weakening market, operators want Special Adviser
to reduce vessel speed because optimum speed is falling. This RS Platou Economic Research
TANKER MARKET BALANCE 2005-2012 Tanker overcapacity 1973-2012
Mill dwt (lines) Utilization rate (bars) Overcapacity in percent of total fleet
450 100 Supply 40
Total demand 36
(Based on
ton-miles, 32
400 90 productivity and 28
floating storage)
24
Simple demand
(Based on trade 20
350 80
volumes) 16
Utilization rate 12
(Based on total 8
300 70 demand)
4
Utilization rate
(Based on 0
250 60 “simple” demand) -4
05 06 07 08 09 10 11 12 73 74 75 76 77 78 79 80 81 82 83 84 85 86 87 88 89 90 91 92 93 94 95 96 97 98 99 0 1 2 3 4 5 6 7 8 9 10 11 12
THE tanker MARKET 19
20. Crude and Clean markeTS likely TO COnTinue TO tanker fleet, five years vs eight for crude, argues against a surge
TraCk eaCh OTher in scrapping.
Product tanker rates increasingly outperformed crude rates
during the second half of 2012, and have begun 2013 on a OddS fOr a CyCliCal upTurn have imprOved,
stronger note. We see the improvement in clean rates as es- buT STrOnger wOrld eCOnOmy needed
sentially a cyclical phenomenon, resulting from the high level We expect that the much-reduced orderbook will lead to a pro-
of crude production and imports in the first half of the year. nounced slowdown in fleet capacity growth to less than 3 per-
Without a significant recovery in oil demand, trade growth is cent per annum over the next three years. In such a scenario,
thus likely to slow for the clean market as well in 2013. How- fleet utilization should begin to improve from 2014 and poten-
ever, trading patterns are becoming more complex because of tially accelerate in 2015. However, this development depends
tightening product specifications. In addition, the reduction on several assumptions, of which the most important is that the
in refinery capacity in the Atlantic Basin, including Venezuela, world economy embarks on a self-sustaining recovery in line
has made seaborne imports a more important swing factor. with its long-term growth potential. When that happens, but
Tonnage demand is less transparent in this segment and may probably not before, oil demand and trade can be expected to
offer upside surprises. accelerate and a cyclical recovery in the crude and clean mar-
kets will arrive.
Fleet capacity growth for product tankers will likely increase in
2013, however, as the level of newbuilding deliveries is sched- Ole-Rikard Hammer
uled to rebound. The relatively low average age of the clean RS Platou Economic Research
sUPPly, demand and Utilization rate 2003–2012 market valUes of tankers 2003–2012
tanker fleet 5 years old
Mill dwt Utilization rate Mill $
500 150 Supply 180 VLCC
Demand 160 Suezmax
450 140 Aframax
Utilization 140
400 130 rate MR Product
120
350 120
100
300 110
80
250 100 60
200 90 40
150 80 20
100 70 0
03 04 05 06 07 08 09 10 11 12 03 04 05 06 07 08 09 10 11 12
20 the tanker market
21. the dry bulk market
Substantial drop in
freight rates
Market fundamentals deteriorated further during 2012, as a result of another year with record high deliveries. Despite weaker
global economic growth, tonnage demand increased at a healthy rate thanks to China, which utilized huge arbitrage in iron
ore and coal prices, importing far more dry bulk commodities than the underlying demand for steel, energy and so forth would
usually dictate.
FREIGHT RATES AND SHIP VALUES tern for other segments was the reverse; with a relatively weaker
Considering the year as a whole, our weighted dry bulk index second half compared with the first half.
averaged $9,400 per day in 2012, down from $15,200 per day in
2011. The Capesize sector saw a drop in earnings from $16,200 Ship values fell steadily throughout the year even though sales
to $9,700 per day, while Panamaxes obtained $8,100 per day activity, especially for the larger sizes, increased significantly
compared with a day rate of $14,600 the year before. Supra- compared with the year before. We also registered high activity
maxes earned $9,400 per day against $14,400 per day in 2011, in re-sales of newbuildings, mostly from Chinese yards. Values ➤
while Handysize day rates fell from $10,500 in 2011 to $7,600
per day in 2012.
average freight rates $ 1,000/day
Capesize tonnage was negatively affected by a slowdown in Bra- Trip charter
zilian iron ore exports to Asia during the first part of the year. 2010 2011 2012
Almost all growth in Asian iron ore imports was covered by Capesize 32.8 16.2 9.7
Australia in this period, significantly impacting upon the ton- Panamax 25.8 14.6 8.1
mile growth parameter. In the last quarter, however, Brazilian Supramax 22.4 14.4 9.4
iron ore shipments to Asia recovered substantially, which con- Handysize 16.4 10.5 7.6
tributed to a significant upturn in Capesize earnings. The pat-
DRY BULK IMPORTS BY COUNTRY/REGION t/c rates bulk carriers 2003–2012
2003–2012 12 months
Mill tons/year 1,000 $/day
1,400 China 180 Capesize
Japan 160 Panamax
1,200
Oth Asia 140 Supramax
1,000 W.Europe Handysize
120
800 India
100
600 80
60
400
40
200
20
0 0
03 04 05 06 07 08 09 10 11 12 03 04 05 06 07 08 09 10 11 12
THE dry bulk MARKET 21
23. for re-sales dropped 15-20 percent, while 5-10 year old tonnage In the rest of the world, dry bulk import rose by around 3 per-
saw values decrease by 20-30 percent. cent from the year before. India continued its impressive growth
in dry bulk imports, mainly in coal, registering a 12 percent es-
SEABORNE TRADE AND TONNAGE DEMAND calation. Far East Asian countries, excluding China, recorded
On a global basis, steel makers raised their output by only only 2 percent higher total imports. European dry bulk imports
1 percent from 2011 to 2012. Asia, the Middle East and North fell by 1 percent, as a result of 8 percent lower iron ore imports.
America recorded moderate increases, while other regions reg- The impact of this was partly negated by 4 percent higher coal
istered lower production. The largest setback was experienced imports.
in the European region, with 3.5 percent lower production.
In terms of the key exporters of iron ore, Australia raised exports
Preliminary data suggests that seaborne transportation of dry by 13 percent, while Brazil reduced its activity by 1 percent. In
bulk commodities rose above 5 percent from the year before. coal transportation, Australian shipments escalated 13 percent,
Real tonnage demand is estimated to have increased around while Indonesia raised its volume by 5 percent. In grain and soy-
7 percent. In addition to somewhat below 5 percent growth bean trade, Brazilian export volumes jumped 16 percent, while
in ton miles, the rise in Chinese coastal trade contributed to US exports fell by 11 percent.
some additional demand. Fleet productivity appears to have
dropped around 2 percent. Among commodities, a 5 percent SAILING DISTANCES
jump was registered in the iron ore trade, while coal shipments On average, we registered slightly shorter hauls in iron ore loads,
increased by 7 percent. Trade in grain and soybean escalated caused by reduced Brazilian market share in the Asian iron ore
3 percent, while shipments of other commodities climbed market. In coal transportation, the average sailing distance was
2 percent. marginally lower. This can be attributed to higher growth in
intra-Pacific coal shipments, compared with trade between the
China increased its dry bulk imports by 12 percent, of which Atlantic and the Pacific regions.
iron ore imports escalated by more than 8 percent, coal by
28 percent and other cargoes by a total of 6 percent. In the More long hauls were registered in the grain and soybean trade.
group of other commodities, the most pronounced jump was This was a result of increased South American exports in rela-
recorded in grain, nickel ore and soybeans. The growth in Chi- tion to the activity of other key exporters.
nese dry bulk imports was surprisingly strong taking into ac-
count only modest increases in domestic steel and energy de- PORT CONGESTION
mand. Significantly lower world market prices of iron ore and Slower growth in the dry bulk trade slightly reduced waiting
coal - compared to higher domestic prices in China - provided times in ports compared with 2011. Chinese, South American
strong incentives for Chinese industries to cover a higher share and Indian congestion was lower than the year before, while
of their raw material demand through overseas import. both Australia and Indonesia experienced longer average port ➤
supply, demand and utilization rate 2003–2012 market Values of Bulk Carriers 2003–2012
Dry bulk fleet 5 years old
Mill dwt Utilization rate Mill $
700 180 Supply 180 Capesize
650 170 Demand 160 Panamax
600 160 Utilization Supramax
140
550 150 rate
500 140 120
450 130 100
400 120 80
350 110
60
300 100
250 90 40
200 80 20
150 70 0
03 04 05 06 07 08 09 10 11 12 03 04 05 06 07 08 09 10 11 12
THE dry bulk MARKET 23