![Representation of data on map by proportional circles
Subhasish Sutradhar Class Note
Proportional Circle
Introduction: Circles are 2 dimensional diagrams consisting of a series of circles
proportional in size to the quantities they represent. Genetically, circular diagrams are
of two types:
i. Simple Circle Diagrams: When the data with only one component
available and each circle represents a single value.
ii. Compound Circle Diagram/ Wheel Diagram/ Pie Diagram: When the
data comprises more than one component within a circle and is
proportionately divided into angular segments to show its constituent parts.
Here, we will discuss about simple circle diagram.
Objectives: To represent the C.D block wise population distribution of Birbhum district
graphically.
Principle: The construction of circle diagrams is based on the principle that the area
of a circle for a represent able item is directly proportional to the quantity of the item
it represents. Therefore, the formula can be written as follows-
𝜋𝑟2
= Q
[ 𝜋𝑟2
= Area of the circle, Q= Quantity of the item it represents]
∴ 𝑟= √
𝑄
𝜋
Construction and Its Methods:
▪ Exercise: Draw proportional circle from the given total population of 19 C.D
blocks of Birbhum districts.
▪ Solution: For each C.D block radius o the circle ( 𝑟) based on total population has
been calculated with the help of following formula-
𝑟 = √
𝑃𝑇
𝜋
.
[ 𝑃𝑇 = 𝑇𝑜𝑡𝑎𝑙 𝑃𝑜𝑝𝑢𝑙𝑎𝑡𝑖𝑜𝑛]
▪ Dataset: Data has been computed and analysed under following sub-heads-](data:image/gif;base64,R0lGODlhAQABAIAAAAAAAP///yH5BAEAAAAALAAAAAABAAEAAAIBRAA7)
Recommended
More Related Content
What's hot
What's hot (20)
Similar to Representation of data on map by proportional circles
Similar to Representation of data on map by proportional circles (8)
Recently uploaded
Recently uploaded (20)
Representation of data on map by proportional circles
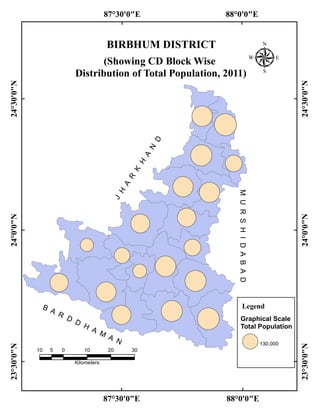
- 1. 88°0'0"E 88°0'0"E 87°30'0"E 87°30'0"E24°30'0"N 24°30'0"N 24°0'0"N 24°0'0"N 23°30'0"N 23°30'0"N 10 0 10 20 305 Kilometers BIRBHUM DISTRICT µ B A R D D H A M A N MURSHIDABAD J H A R K H A N D (Showing CD Block Wise Distribution of Total Population, 2011) Legend Graphical Scale Total Population 130,000
- 2. Representation of data on map by proportional circles Subhasish Sutradhar Class Note Proportional Circle Introduction: Circles are 2 dimensional diagrams consisting of a series of circles proportional in size to the quantities they represent. Genetically, circular diagrams are of two types: i. Simple Circle Diagrams: When the data with only one component available and each circle represents a single value. ii. Compound Circle Diagram/ Wheel Diagram/ Pie Diagram: When the data comprises more than one component within a circle and is proportionately divided into angular segments to show its constituent parts. Here, we will discuss about simple circle diagram. Objectives: To represent the C.D block wise population distribution of Birbhum district graphically. Principle: The construction of circle diagrams is based on the principle that the area of a circle for a represent able item is directly proportional to the quantity of the item it represents. Therefore, the formula can be written as follows- 𝜋𝑟2 = Q [ 𝜋𝑟2 = Area of the circle, Q= Quantity of the item it represents] ∴ 𝑟= √ 𝑄 𝜋 Construction and Its Methods: ▪ Exercise: Draw proportional circle from the given total population of 19 C.D blocks of Birbhum districts. ▪ Solution: For each C.D block radius o the circle ( 𝑟) based on total population has been calculated with the help of following formula- 𝑟 = √ 𝑃𝑇 𝜋 . [ 𝑃𝑇 = 𝑇𝑜𝑡𝑎𝑙 𝑃𝑜𝑝𝑢𝑙𝑎𝑡𝑖𝑜𝑛] ▪ Dataset: Data has been computed and analysed under following sub-heads-
- 3. Representation of data on map by proportional circles Subhasish Sutradhar Class Note SL. No. C.D Block Total Population ( 𝑃𝑇) 𝜋 𝑟 = √ 𝑃𝑇 𝜋 . Scale 𝑟 1 cm≡300 Unit 1 Murarai-I 190802 3.141592654 246.4430216 0.82147674 2 Murarai-II 222033 265.848263 0.88616088 3 Nalhati-I 204818 255.3342794 0.85111426 4 Nalhati-II 127785 201.6810075 0.67227003 5 Rampurhat-I 188435 244.9096229 0.81636541 6 Rampurhat-II 187823 244.5115902 0.81503863 7 Mayureswar-I 159782 225.5220393 0.75174013 8 Mayureswar-II 127661 201.5831302 0.67194377 9 Mohammad Bazar 164570 228.8760756 0.76292025 10 Rajnagar 77979 157.5483628 0.52516121 11 Suri-I 111377 188.2880777 0.62762693 12 Suri-II 87405 166.7989077 0.55599636 13 Sainthia 195349 249.3622224 0.83120741 14 Labpur 201901 253.509535 0.84503178 15 Nanoor 218654 263.8176072 0.87939202 16 Bolpur Sriniketan 202553 253.9185349 0.84639512 17 Illambazar 168709 231.7363644 0.77245455 18 Dubrajpur 181437 240.3189356 0.80106312 19 Khoyrasole 153248 220.8627479 0.73620916 For graphical scale 1 100000 178.4124116 0.59470804 2 150000 218.5096861 0.72836562 3 200000 252.3132522 0.84104417 [Source: Directorate of Census West Bengal, India, 2011] Interpretation: Proportional circles in the map of birbhum district depict total population of CD blocks. From the map it can be interpreted that distribution of population in CD blocks of Birbhum districts are quite uneven. Murarai-II, Nanoor, Nalhati-I, Labpur, Bolpur Sriniketan, Sainthia, Murarai-I, Rampurhat-I, Rampurhat- II, Dubrajpur etc. C.D blocks are carrying huge population pressure. On the other hand Rajnagar, Suri-II, Suri-I etc. C.D blocks have less population pressure than other C.D blocks.