Day 6 interpreting graphs
•Download as DOC, PDF•
0 likes•80 views

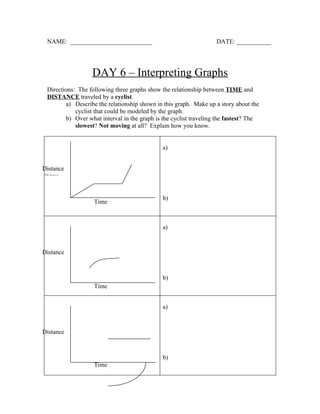
The document is a worksheet about interpreting graphs. It contains instructions to analyze three graphs showing the relationship between time and distance traveled by a cyclist. It asks students to describe the relationships shown in the graphs and identify when the cyclist is traveling fastest, slowest, and not moving at all based on the graphs. It also contains a story about a runner, Mr. T, in a 10 mile race and asks students to sketch a graph that matches the details in the story. Finally, it includes a graph showing distance over time for a car and bus and asks students to label the axes, describe their choices, and write a short story consistent with the information in that graph.
Report
Share
Report
Share

Recommended
Math test grade ix
This math test covers similarity in plane figures and using it to solve problems. It contains 3 questions: 1) Find the length of side QR if rectangle ABCD is similar to PQRS and one side is 6 cm. 2) Find the lengths of sides ML, PQ, and PR if triangles KLM and PQR are similar. 3) Find the lengths of sides AB, AD, AE and the area of trapezoid NOPQ if the two trapezoids are similar.
Hiroyuki oda
The document appears to be a playlist for a radio show or mix, consisting of 16 tracks of electronic dance music spanning various genres like trance, progressive house, and techno. The tracks are from various artists and include both instrumental tracks and tracks featuring vocals.
Trab 3° ano
Esta atividade de matemática em dupla consiste em duas tarefas: 1) Pesquisar e comentar sobre uma obra do artista Escher devendo ser entregue até 20/04, 2) Fotografar uma figura 3D na cidade e construir um modelo de maquete com materiais recicláveis identificando formas geométricas, incluindo a foto na apresentação.
Fav agua_ar
Este documento é uma avaliação de Ciências da Natureza sobre água e ar para alunos do 5o ano. A avaliação contém perguntas sobre dissolução, tratamento de água, poluição de rios, composição do ar e propriedades de gases. Os alunos devem responder perguntas de escolha múltipla, correspondência, completar frases e descrever processos e conceitos.
Areas verdes actividad 3 ultima version
Este documento describe la importancia de preservar el Desierto de los Leones como un área verde que alberga fauna y flora. Explica que las áreas verdes como bosques y selvas son vitales porque purifican el agua, recargan mantos acuíferos, son hogar de la vida silvestre, absorben el dióxido de carbono y ayudan a mitigar desastres naturales. Finalmente, invita al lector a involucrarse en la reforestación y cuidado de estas áreas.
Imbd question 3
This 2 hour and 36 minute British psychological thriller from 2012 tells the true story of a 9-year-old boy who witnessed his mother's horrific murder but was unable to communicate what he saw until worked with by psychiatrists years later. Directed by Andrew Carolan and starring Kirsty McKenna, Nathan Boothroyd, and Daniel Rayson, the film is based on the screenplay by Daniel Rayson and Nathan Boothroyd and was produced on a £3.2 million budget in England by DNA Productions.
Livros com Pernas
A Rede Social é uma plataforma de articulação entre autarquias e entidades sem fins lucrativos para promover o desenvolvimento social. É organizada pelo Conselho Local de Ação Social de Torres Vedras e Comissões Sociais Inter Freguesias. O projeto Livros com Pernas pretende fornecer livros escolares gratuitos a alunos e famílias em todas as freguesias do concelho.
Question 6
Filming a thriller taught the author about filming and editing technology, specifically gaining a better understanding of manipulating Final Cut in editing. Through filming, the author also learned about proper camera techniques and handling cameras correctly.
Reglamento 2008 modificado
Este documento establece las regulaciones para proveer el rol de Maestro Comunitario en las escuelas primarias. Se dará prioridad a los maestros efectivos de la escuela que aspiren al rol. Si no hay aspirantes efectivos, se considerará a maestros interinos o suplentes. El director de la escuela propondrá a los maestros que reúnan mejor las calificaciones requeridas, teniendo en cuenta su conocimiento de la comunidad, interés en ayudar a los estudiantes, habilidades interpersonales y disponibilidad de tiempo. La inspección
Livros com Pernas
A Rede Social é uma plataforma de articulação entre autarquias e entidades sem fins lucrativos para promover o desenvolvimento social. É organizada pelo Conselho Local de Ação Social de Torres Vedras e Comissões Sociais Inter Freguesias. O projeto Livros com Pernas pretende fornecer livros escolares gratuitos a alunos e famílias em todas as freguesias do concelho.
Reglamento 2008 modificado
Este documento establece las regulaciones para proveer el rol de Maestro Comunitario en las escuelas primarias. Se dará prioridad a los maestros efectivos de la escuela que aspiren al rol. Si no hay aspirantes efectivos, se considerará a maestros interinos o suplentes. El director de la escuela propondrá a los maestros que reúnan mejor las calificaciones requeridas, teniendo en cuenta su conocimiento de la comunidad, interés en ayudar a los estudiantes, habilidades interpersonales y disponibilidad de tiempo. La inspección
La postura del docente y la planificación
El docente debe asumir un rol activo y participativo al frente de un grupo de estudiantes. Su postura y planificación son fundamentales para transmitir la información de manera ordenada y con sentido, utilizando técnicas efectivas. La postura del docente y los recursos utilizados influyen en si la clase es dinámica u aburrida. El docente debe planificar sus temas y contenidos con cuidado para ser un buen modelo y garantizar el aprendizaje, mostrando dedicación, amor y buena preparación. Su planificación y comunicación con los
12.3.29 akron beacon journal job shadow event
The document discusses a bill passed by the Ohio legislature that allows businesses to make a "cure offer" when sued for unfair practices, potentially weakening consumer protections. Democrats opposed the bill, arguing it favors large corporations over individual consumers. The bill is expected to be signed by Governor Kasich. It would give companies a chance to settle lawsuits early and avoid triple damages, but consumers who decline offers could still recover costs and fees if awarded more than the cure amount. Critics say the bill makes Ohio's consumer protection law one of the weakest.
Task 3
Best Friends 2012 is a 91-minute British thriller/drama film from 2012. It tells the story of Natasha and Charlie, lifelong best friends, whose relationship is tested when Natasha discovers that Charlie is now dating Max, the man Natasha loves. As jealousy takes hold, the film explores what one girl will do to her best friend of five years over a boy. It was written and directed by Priyanca Barot, Charlotte Crockett, and Georgia Thompson, and stars Priyanca Barot, Charlotte Crockett, and Chris Abbott.
Bioética
Este documento trata sobre varios temas éticos como la bioética, el suicidio, el aborto y la eutanasia. Describe el suicidio como un acto en el que una persona se provoca intencionalmente la muerte, y menciona algunas formas comunes como cortarse las venas o ahorcarse. Explica que el aborto inducido es la interrupción activa del embarazo, mientras que el aborto espontáneo ocurre sin intención. Finalmente, diferencia la eutanasia directa de la indirecta, siendo la primera
tus 10 comportamientos digitales
El documento presenta 10 principios para el uso responsable y respetuoso de las tecnologías de la información y comunicación (TIC). Estos principios incluyen respetar la dignidad y privacidad de los demás, proteger la propia identidad y confidencialidad, ejercer la libertad de manera responsable, y utilizar las TIC de forma que apoye el aprendizaje y mejoramiento personal sin afectar la calidad de vida.
jValidator
jValidator is the first Data Quality Firewall open source. It\'s a middleware for the validation and processing of data streams.
Contoh soalan bahasa malaysia (SJK)
Ringkasan dari soalan-soalan Bahasa Malaysia:
1. Soalan mengenai pokok yang tumbang akibat angin kencang.
2. Soalan mengenai sebab biskut menjadi lemau kerana bekasnya tidak ditutup rapat.
3. Soalan berdasarkan gambar tentang baju Yusof yang menjadi renyuk kerana tidak bergosok.
Haarp+ terremoto
Este documento afirma que el programa HAARP de Estados Unidos puede utilizarse como un arma para provocar desastres naturales como terremotos, sequías, inundaciones y huracanes. Alega que HAARP será utilizado en 2010 para causar terremotos en la Ciudad de México con el fin de desestabilizar a México económicamente y facilitar la integración de América del Norte. Advierte a la población mexicana que no acepte vacunarse después del terremoto planeado.
Acitvo patrimonio
El documento presenta preguntas y respuestas sobre conceptos contables básicos como dinero, contabilidad, balance general, activos, pasivos y patrimonio. Sebastian Perez, estudiante del Colegio San Jose de La Salle en el grado 8B en el año 2012, define estas nociones fundamentales de la contabilidad en su trabajo escolar.
El maltrato infantil como objeto de entretenimiento televisivo
Este documento discute los concursos de belleza para niños menores de 12 años y las preocupaciones sobre su impacto en el bienestar de los niños. Señala que estos concursos están ganando popularidad y son promovidos en programas de televisión, pero someten a los niños a una alimentación inadecuada, pérdida de la infancia y competencia excesiva para entretener a la audiencia. También menciona el caso de JonBenét Ramsey, una reina de belleza infantil encontrada muerta, y cómo el programa "Princesitas" viola los
Task 3
Best of Friends is a 2012 British thriller/drama directed by Priyanca Barot, Charlotte Crockett and Georgia Thompson. It follows Natasha and Charlie, who have been best friends for 5 years, but their friendship is tested when Natasha discovers that Charlie is now dating Max, who Natasha had feelings for. The film stars Priyanca Barot, Charlotte Crockett, and Chris Abbott and had a limited budget of £15,000. It was filmed in Cambridge, England and released in the UK on March 30, 2012.
2015SupervisorResume
Joshua W. Zagorski is a math teacher at Cinnaminson Township Public Schools in New Jersey. He has over 10 years of experience teaching mathematics at the middle and high school levels. He holds a Master's degree in Education from La Salle University and a Bachelor's degree in Sociology from Moravian College. Zagorski has received several honors for his teaching, including being named Teacher of the Year at Cinnaminson Middle School. He actively integrates technology into his classroom and has led initiatives to supplement math instruction.
1.8 lab
This document contains instructions for an experiment to measure the time it takes for a varying number of students to complete a task of standing, clapping, and sitting. Students will take turns performing the task until all have participated, and the time to complete each round will be recorded. The number of students is the independent variable and time is the dependent variable. Data for groups of 3 to 24 students will be plotted on a graph and the best fit line drawn to analyze the correlation between more students and longer completion times.
Budget project
This document provides instructions for creating a realistic monthly budget. It explains that a budget accounts for income versus expenses, with the goal of expenses being less than income. Common expenses are listed like housing, utilities, transportation, food, and savings, which should be at least 5% of income. Students will be assigned an occupation with a set income and must choose housing, a car, and estimate other expenses to track in a monthly budget worksheet. If expenses exceed income or savings is less than 5%, spending habits must be adjusted.
Scale drawing table
This document provides instructions for creating a scale drawing of a piece of furniture. It notes that measurements should be provided in either boxes or inches, not both. As an example, a grey shelf that is 3 feet by 1 foot in real life would be drawn as either 3 boxes by 1 box or 0.75 inches by 0.25 inches on the scale drawing, since the scale factor is that 1 foot equals 1/4 inch or one box.
More Related Content
Viewers also liked
Question 6
Filming a thriller taught the author about filming and editing technology, specifically gaining a better understanding of manipulating Final Cut in editing. Through filming, the author also learned about proper camera techniques and handling cameras correctly.
Reglamento 2008 modificado
Este documento establece las regulaciones para proveer el rol de Maestro Comunitario en las escuelas primarias. Se dará prioridad a los maestros efectivos de la escuela que aspiren al rol. Si no hay aspirantes efectivos, se considerará a maestros interinos o suplentes. El director de la escuela propondrá a los maestros que reúnan mejor las calificaciones requeridas, teniendo en cuenta su conocimiento de la comunidad, interés en ayudar a los estudiantes, habilidades interpersonales y disponibilidad de tiempo. La inspección
Livros com Pernas
A Rede Social é uma plataforma de articulação entre autarquias e entidades sem fins lucrativos para promover o desenvolvimento social. É organizada pelo Conselho Local de Ação Social de Torres Vedras e Comissões Sociais Inter Freguesias. O projeto Livros com Pernas pretende fornecer livros escolares gratuitos a alunos e famílias em todas as freguesias do concelho.
Reglamento 2008 modificado
Este documento establece las regulaciones para proveer el rol de Maestro Comunitario en las escuelas primarias. Se dará prioridad a los maestros efectivos de la escuela que aspiren al rol. Si no hay aspirantes efectivos, se considerará a maestros interinos o suplentes. El director de la escuela propondrá a los maestros que reúnan mejor las calificaciones requeridas, teniendo en cuenta su conocimiento de la comunidad, interés en ayudar a los estudiantes, habilidades interpersonales y disponibilidad de tiempo. La inspección
La postura del docente y la planificación
El docente debe asumir un rol activo y participativo al frente de un grupo de estudiantes. Su postura y planificación son fundamentales para transmitir la información de manera ordenada y con sentido, utilizando técnicas efectivas. La postura del docente y los recursos utilizados influyen en si la clase es dinámica u aburrida. El docente debe planificar sus temas y contenidos con cuidado para ser un buen modelo y garantizar el aprendizaje, mostrando dedicación, amor y buena preparación. Su planificación y comunicación con los
12.3.29 akron beacon journal job shadow event
The document discusses a bill passed by the Ohio legislature that allows businesses to make a "cure offer" when sued for unfair practices, potentially weakening consumer protections. Democrats opposed the bill, arguing it favors large corporations over individual consumers. The bill is expected to be signed by Governor Kasich. It would give companies a chance to settle lawsuits early and avoid triple damages, but consumers who decline offers could still recover costs and fees if awarded more than the cure amount. Critics say the bill makes Ohio's consumer protection law one of the weakest.
Task 3
Best Friends 2012 is a 91-minute British thriller/drama film from 2012. It tells the story of Natasha and Charlie, lifelong best friends, whose relationship is tested when Natasha discovers that Charlie is now dating Max, the man Natasha loves. As jealousy takes hold, the film explores what one girl will do to her best friend of five years over a boy. It was written and directed by Priyanca Barot, Charlotte Crockett, and Georgia Thompson, and stars Priyanca Barot, Charlotte Crockett, and Chris Abbott.
Bioética
Este documento trata sobre varios temas éticos como la bioética, el suicidio, el aborto y la eutanasia. Describe el suicidio como un acto en el que una persona se provoca intencionalmente la muerte, y menciona algunas formas comunes como cortarse las venas o ahorcarse. Explica que el aborto inducido es la interrupción activa del embarazo, mientras que el aborto espontáneo ocurre sin intención. Finalmente, diferencia la eutanasia directa de la indirecta, siendo la primera
tus 10 comportamientos digitales
El documento presenta 10 principios para el uso responsable y respetuoso de las tecnologías de la información y comunicación (TIC). Estos principios incluyen respetar la dignidad y privacidad de los demás, proteger la propia identidad y confidencialidad, ejercer la libertad de manera responsable, y utilizar las TIC de forma que apoye el aprendizaje y mejoramiento personal sin afectar la calidad de vida.
jValidator
jValidator is the first Data Quality Firewall open source. It\'s a middleware for the validation and processing of data streams.
Contoh soalan bahasa malaysia (SJK)
Ringkasan dari soalan-soalan Bahasa Malaysia:
1. Soalan mengenai pokok yang tumbang akibat angin kencang.
2. Soalan mengenai sebab biskut menjadi lemau kerana bekasnya tidak ditutup rapat.
3. Soalan berdasarkan gambar tentang baju Yusof yang menjadi renyuk kerana tidak bergosok.
Haarp+ terremoto
Este documento afirma que el programa HAARP de Estados Unidos puede utilizarse como un arma para provocar desastres naturales como terremotos, sequías, inundaciones y huracanes. Alega que HAARP será utilizado en 2010 para causar terremotos en la Ciudad de México con el fin de desestabilizar a México económicamente y facilitar la integración de América del Norte. Advierte a la población mexicana que no acepte vacunarse después del terremoto planeado.
Acitvo patrimonio
El documento presenta preguntas y respuestas sobre conceptos contables básicos como dinero, contabilidad, balance general, activos, pasivos y patrimonio. Sebastian Perez, estudiante del Colegio San Jose de La Salle en el grado 8B en el año 2012, define estas nociones fundamentales de la contabilidad en su trabajo escolar.
El maltrato infantil como objeto de entretenimiento televisivo
Este documento discute los concursos de belleza para niños menores de 12 años y las preocupaciones sobre su impacto en el bienestar de los niños. Señala que estos concursos están ganando popularidad y son promovidos en programas de televisión, pero someten a los niños a una alimentación inadecuada, pérdida de la infancia y competencia excesiva para entretener a la audiencia. También menciona el caso de JonBenét Ramsey, una reina de belleza infantil encontrada muerta, y cómo el programa "Princesitas" viola los
Task 3
Best of Friends is a 2012 British thriller/drama directed by Priyanca Barot, Charlotte Crockett and Georgia Thompson. It follows Natasha and Charlie, who have been best friends for 5 years, but their friendship is tested when Natasha discovers that Charlie is now dating Max, who Natasha had feelings for. The film stars Priyanca Barot, Charlotte Crockett, and Chris Abbott and had a limited budget of £15,000. It was filmed in Cambridge, England and released in the UK on March 30, 2012.
Viewers also liked (18)
El maltrato infantil como objeto de entretenimiento televisivo
El maltrato infantil como objeto de entretenimiento televisivo
More from Cinnaminson Public Schools
2015SupervisorResume
Joshua W. Zagorski is a math teacher at Cinnaminson Township Public Schools in New Jersey. He has over 10 years of experience teaching mathematics at the middle and high school levels. He holds a Master's degree in Education from La Salle University and a Bachelor's degree in Sociology from Moravian College. Zagorski has received several honors for his teaching, including being named Teacher of the Year at Cinnaminson Middle School. He actively integrates technology into his classroom and has led initiatives to supplement math instruction.
1.8 lab
This document contains instructions for an experiment to measure the time it takes for a varying number of students to complete a task of standing, clapping, and sitting. Students will take turns performing the task until all have participated, and the time to complete each round will be recorded. The number of students is the independent variable and time is the dependent variable. Data for groups of 3 to 24 students will be plotted on a graph and the best fit line drawn to analyze the correlation between more students and longer completion times.
Budget project
This document provides instructions for creating a realistic monthly budget. It explains that a budget accounts for income versus expenses, with the goal of expenses being less than income. Common expenses are listed like housing, utilities, transportation, food, and savings, which should be at least 5% of income. Students will be assigned an occupation with a set income and must choose housing, a car, and estimate other expenses to track in a monthly budget worksheet. If expenses exceed income or savings is less than 5%, spending habits must be adjusted.
Scale drawing table
This document provides instructions for creating a scale drawing of a piece of furniture. It notes that measurements should be provided in either boxes or inches, not both. As an example, a grey shelf that is 3 feet by 1 foot in real life would be drawn as either 3 boxes by 1 box or 0.75 inches by 0.25 inches on the scale drawing, since the scale factor is that 1 foot equals 1/4 inch or one box.
Linear equation graphic
A linear equation is represented by y = mx + b, where m is the coefficient that determines the steepness of the graph line, b is the y-intercept or the point at which the line crosses the y-axis, and x and y are coordinate pairs that each represent a single point on the line.
Slope
This document discusses the slope formula for a line, which is the ratio of the rise over the run between any two points on the line. Specifically, it notes that the slope (m) equals the rise over the run, where the rise is the change in the y-values and the run is the change in the x-values between the two points.
Scale drawing project
This document provides instructions for a scale drawing project of a classroom floor plan. Students are asked to measure a classroom, determine an appropriate scale to fit the room on a piece of graph paper, and draw the outline of the room along with major furniture items using the scale. Students must include a scale bar, title, and colors to make the floor plan realistic. The project aims to provide floor plans of classrooms to facilitate school renovations.
Scale drawing do nows
Jenn had to create a scale drawing of her classroom for a school project. She measured her classroom and found it was 24 feet by 30 feet. To fit the drawing on graph paper, Jenn decided to use a scale of 1 foot equals 1/4 inch.
Lifeline project grade sheet (2)
This grade sheet is for a lifeline project and assigns points to students for correctly graphing life events before and after their birth on a timeline, using accurate numerical representations and year intervals, as well as adding illustrations or labels for graphed events. It outlines the specific criteria students will be judged on, including correctly placing their birth at zero, graphing at least three pre-birth and six post-birth events, and creating a neat and creative final project.
Lifelineproject
This document provides directions for creating a personal lifeline. Students must include their birth and at least 3 events that occurred before they were born, with each event listing the date as a fraction of years before or after the student's birth (assigned as 0). Events should have the month and year, the student's age at the event, and a brief description. Sample events include parents meeting, siblings being born, first teeth, words, bike riding, moves, vacations, or historical events. The lifeline may include one break and some photos.
Polygons and quadrilaterals
The document discusses polygons and quadrilaterals. It defines regular and irregular polygons, as well as convex and concave polygons. It then defines different types of quadrilaterals including trapezoids, rectangles, squares, rhombuses, and parallelograms. It provides three examples of finding the value of x and angle measures in different geometric shapes.
L4 angles in polygons
The document provides examples and explanations of geometry concepts including finding the perimeter of a regular octagon where one side is 12 cm, the triangle sum rule stating the interior angles of a triangle sum to 180 degrees, the definition of a diagonal as a line segment connecting two non-adjacent vertices of a polygon, and examples of finding the number of diagonals in nonagons and dodecagons.
Congruent angles go
Vertical angles are angles that are opposite each other when two lines intersect. Corresponding angles are angles that are in the same relative position to the point of intersection but on opposite sides of the intersecting lines. Alternate exterior angles are nonadjacent angles outside of the intersecting lines formed by a transversal crossing two parallel lines. Alternate interior angles are nonadjacent angles inside of the intersecting lines formed by a transversal crossing two parallel lines.
Lesson 3 line and angle relationships
This document discusses different types of lines and their relationships. It defines parallel lines as two lines that lie in the same plane and do not intersect, intersecting lines as lines that cross paths at one point, and skew lines as lines that do not lie in the same plane and neither intersect nor are parallel. The document also notes that two points are needed to form a line and that two straight lines cannot intersect at more than one point.
Angle relationships
1) The document defines and provides examples of different types of angles including adjacent angles, complementary angles, supplementary angles, vertical angles, and angles formed when parallel lines are cut by a transversal.
2) It then provides practice problems involving calculating missing angles using properties such as angles summing to 90, 180 degrees, and the interior angles of triangles summing to 180 degrees.
3) The final problems involve identifying congruent, supplementary, and corresponding angles related to two parallel lines cut by a transversal.
Angle relationships
1) The document defines and provides examples of different types of angles including adjacent angles, complementary angles, supplementary angles, vertical angles, and angles formed when parallel lines are cut by a transversal.
2) It then provides practice problems involving calculating missing angles using properties such as angles summing to 90 or 180 degrees. Problems include solving for missing angles in triangles where the three interior angles sum to 180 degrees.
3) The last problems involve identifying properties of angles formed when two lines are parallel and cut by a transversal, such as naming congruent or supplementary angles.
Building blocks of geometry
The document defines basic geometry terms including point, line, plane, ray, line segment, and angle. A point is represented by a dot at a location without size. A line extends in two opposite directions and is named by two points. A plane extends forever like a tabletop. A ray has one endpoint and extends forever in one direction, while a line segment connects two endpoints on a line.
Sample questions 2013
The document contains 4 math word problems and their solutions:
1) Choosing 2 students from a group of 4 can be done in 6 combinations.
2) 15 - 3(2+1) = 15 - 3(3) = 15 - 9 = 6
3) A room measuring 8 feet 6 inches by 12 feet with 6-inch tiles needs 408 tiles.
4) A sequence with first terms 3, 5, 7, 9 has a rule of adding 2 to get the next term; a different sequence following the same rule of adding 2 would have first terms 5, 7, 9, 11, and the 100th term would be 198.
7th ask prep jeopardy
The document contains a practice test for a 7th grade math assessment with 500 multiple choice questions covering topics like fractions, order of operations, geometry, probability, and more. Each question is numbered and includes 4 answer options with the correct answer indicated. The test reviews essential 7th grade math concepts and skills in a standardized multiple choice format.
8th ask prep jeopardy
This document contains 100 math word problems and multiple choice questions from an 8th grade standardized test practice. It provides the question, possible answer choices, and the correct answer for each problem. The questions cover a range of math topics including arithmetic, algebra, geometry, statistics, probability, and measurement.
More from Cinnaminson Public Schools (20)
Recently uploaded
20240607 QFM018 Elixir Reading List May 2024
Everything I found interesting about the Elixir programming ecosystem in May 2024
Best 20 SEO Techniques To Improve Website Visibility In SERP
Boost your website's visibility with proven SEO techniques! Our latest blog dives into essential strategies to enhance your online presence, increase traffic, and rank higher on search engines. From keyword optimization to quality content creation, learn how to make your site stand out in the crowded digital landscape. Discover actionable tips and expert insights to elevate your SEO game.
Observability Concepts EVERY Developer Should Know -- DeveloperWeek Europe.pdf
Monitoring and observability aren’t traditionally found in software curriculums and many of us cobble this knowledge together from whatever vendor or ecosystem we were first introduced to and whatever is a part of your current company’s observability stack.
While the dev and ops silo continues to crumble….many organizations still relegate monitoring & observability as the purview of ops, infra and SRE teams. This is a mistake - achieving a highly observable system requires collaboration up and down the stack.
I, a former op, would like to extend an invitation to all application developers to join the observability party will share these foundational concepts to build on:
GraphSummit Singapore | Neo4j Product Vision & Roadmap - Q2 2024
Maruthi Prithivirajan, Head of ASEAN & IN Solution Architecture, Neo4j
Get an inside look at the latest Neo4j innovations that enable relationship-driven intelligence at scale. Learn more about the newest cloud integrations and product enhancements that make Neo4j an essential choice for developers building apps with interconnected data and generative AI.
Artificial Intelligence for XMLDevelopment
In the rapidly evolving landscape of technologies, XML continues to play a vital role in structuring, storing, and transporting data across diverse systems. The recent advancements in artificial intelligence (AI) present new methodologies for enhancing XML development workflows, introducing efficiency, automation, and intelligent capabilities. This presentation will outline the scope and perspective of utilizing AI in XML development. The potential benefits and the possible pitfalls will be highlighted, providing a balanced view of the subject.
We will explore the capabilities of AI in understanding XML markup languages and autonomously creating structured XML content. Additionally, we will examine the capacity of AI to enrich plain text with appropriate XML markup. Practical examples and methodological guidelines will be provided to elucidate how AI can be effectively prompted to interpret and generate accurate XML markup.
Further emphasis will be placed on the role of AI in developing XSLT, or schemas such as XSD and Schematron. We will address the techniques and strategies adopted to create prompts for generating code, explaining code, or refactoring the code, and the results achieved.
The discussion will extend to how AI can be used to transform XML content. In particular, the focus will be on the use of AI XPath extension functions in XSLT, Schematron, Schematron Quick Fixes, or for XML content refactoring.
The presentation aims to deliver a comprehensive overview of AI usage in XML development, providing attendees with the necessary knowledge to make informed decisions. Whether you’re at the early stages of adopting AI or considering integrating it in advanced XML development, this presentation will cover all levels of expertise.
By highlighting the potential advantages and challenges of integrating AI with XML development tools and languages, the presentation seeks to inspire thoughtful conversation around the future of XML development. We’ll not only delve into the technical aspects of AI-powered XML development but also discuss practical implications and possible future directions.
UiPath Test Automation using UiPath Test Suite series, part 6
Welcome to UiPath Test Automation using UiPath Test Suite series part 6. In this session, we will cover Test Automation with generative AI and Open AI.
UiPath Test Automation with generative AI and Open AI webinar offers an in-depth exploration of leveraging cutting-edge technologies for test automation within the UiPath platform. Attendees will delve into the integration of generative AI, a test automation solution, with Open AI advanced natural language processing capabilities.
Throughout the session, participants will discover how this synergy empowers testers to automate repetitive tasks, enhance testing accuracy, and expedite the software testing life cycle. Topics covered include the seamless integration process, practical use cases, and the benefits of harnessing AI-driven automation for UiPath testing initiatives. By attending this webinar, testers, and automation professionals can gain valuable insights into harnessing the power of AI to optimize their test automation workflows within the UiPath ecosystem, ultimately driving efficiency and quality in software development processes.
What will you get from this session?
1. Insights into integrating generative AI.
2. Understanding how this integration enhances test automation within the UiPath platform
3. Practical demonstrations
4. Exploration of real-world use cases illustrating the benefits of AI-driven test automation for UiPath
Topics covered:
What is generative AI
Test Automation with generative AI and Open AI.
UiPath integration with generative AI
Speaker:
Deepak Rai, Automation Practice Lead, Boundaryless Group and UiPath MVP
“Building and Scaling AI Applications with the Nx AI Manager,” a Presentation...
“Building and Scaling AI Applications with the Nx AI Manager,” a Presentation...Edge AI and Vision Alliance
For the full video of this presentation, please visit: https://www.edge-ai-vision.com/2024/06/building-and-scaling-ai-applications-with-the-nx-ai-manager-a-presentation-from-network-optix/
Robin van Emden, Senior Director of Data Science at Network Optix, presents the “Building and Scaling AI Applications with the Nx AI Manager,” tutorial at the May 2024 Embedded Vision Summit.
In this presentation, van Emden covers the basics of scaling edge AI solutions using the Nx tool kit. He emphasizes the process of developing AI models and deploying them globally. He also showcases the conversion of AI models and the creation of effective edge AI pipelines, with a focus on pre-processing, model conversion, selecting the appropriate inference engine for the target hardware and post-processing.
van Emden shows how Nx can simplify the developer’s life and facilitate a rapid transition from concept to production-ready applications.He provides valuable insights into developing scalable and efficient edge AI solutions, with a strong focus on practical implementation.Uni Systems Copilot event_05062024_C.Vlachos.pdf
Unlocking Productivity: Leveraging the Potential of Copilot in Microsoft 365, a presentation by Christoforos Vlachos, Senior Solutions Manager – Modern Workplace, Uni Systems
AI 101: An Introduction to the Basics and Impact of Artificial Intelligence
Imagine a world where machines not only perform tasks but also learn, adapt, and make decisions. This is the promise of Artificial Intelligence (AI), a technology that's not just enhancing our lives but revolutionizing entire industries.
UiPath Test Automation using UiPath Test Suite series, part 5
Welcome to UiPath Test Automation using UiPath Test Suite series part 5. In this session, we will cover CI/CD with devops.
Topics covered:
CI/CD with in UiPath
End-to-end overview of CI/CD pipeline with Azure devops
Speaker:
Lyndsey Byblow, Test Suite Sales Engineer @ UiPath, Inc.
How to Get CNIC Information System with Paksim Ga.pptx
Pakdata Cf is a groundbreaking system designed to streamline and facilitate access to CNIC information. This innovative platform leverages advanced technology to provide users with efficient and secure access to their CNIC details.
20240605 QFM017 Machine Intelligence Reading List May 2024
Everything I found interesting about machines behaving intelligently during May 2024
HCL Notes and Domino License Cost Reduction in the World of DLAU
Webinar Recording: https://www.panagenda.com/webinars/hcl-notes-and-domino-license-cost-reduction-in-the-world-of-dlau/
The introduction of DLAU and the CCB & CCX licensing model caused quite a stir in the HCL community. As a Notes and Domino customer, you may have faced challenges with unexpected user counts and license costs. You probably have questions on how this new licensing approach works and how to benefit from it. Most importantly, you likely have budget constraints and want to save money where possible. Don’t worry, we can help with all of this!
We’ll show you how to fix common misconfigurations that cause higher-than-expected user counts, and how to identify accounts which you can deactivate to save money. There are also frequent patterns that can cause unnecessary cost, like using a person document instead of a mail-in for shared mailboxes. We’ll provide examples and solutions for those as well. And naturally we’ll explain the new licensing model.
Join HCL Ambassador Marc Thomas in this webinar with a special guest appearance from Franz Walder. It will give you the tools and know-how to stay on top of what is going on with Domino licensing. You will be able lower your cost through an optimized configuration and keep it low going forward.
These topics will be covered
- Reducing license cost by finding and fixing misconfigurations and superfluous accounts
- How do CCB and CCX licenses really work?
- Understanding the DLAU tool and how to best utilize it
- Tips for common problem areas, like team mailboxes, functional/test users, etc
- Practical examples and best practices to implement right away
Full-RAG: A modern architecture for hyper-personalization
Mike Del Balso, CEO & Co-Founder at Tecton, presents "Full RAG," a novel approach to AI recommendation systems, aiming to push beyond the limitations of traditional models through a deep integration of contextual insights and real-time data, leveraging the Retrieval-Augmented Generation architecture. This talk will outline Full RAG's potential to significantly enhance personalization, address engineering challenges such as data management and model training, and introduce data enrichment with reranking as a key solution. Attendees will gain crucial insights into the importance of hyperpersonalization in AI, the capabilities of Full RAG for advanced personalization, and strategies for managing complex data integrations for deploying cutting-edge AI solutions.
HCL Notes und Domino Lizenzkostenreduzierung in der Welt von DLAU
Webinar Recording: https://www.panagenda.com/webinars/hcl-notes-und-domino-lizenzkostenreduzierung-in-der-welt-von-dlau/
DLAU und die Lizenzen nach dem CCB- und CCX-Modell sind für viele in der HCL-Community seit letztem Jahr ein heißes Thema. Als Notes- oder Domino-Kunde haben Sie vielleicht mit unerwartet hohen Benutzerzahlen und Lizenzgebühren zu kämpfen. Sie fragen sich vielleicht, wie diese neue Art der Lizenzierung funktioniert und welchen Nutzen sie Ihnen bringt. Vor allem wollen Sie sicherlich Ihr Budget einhalten und Kosten sparen, wo immer möglich. Das verstehen wir und wir möchten Ihnen dabei helfen!
Wir erklären Ihnen, wie Sie häufige Konfigurationsprobleme lösen können, die dazu führen können, dass mehr Benutzer gezählt werden als nötig, und wie Sie überflüssige oder ungenutzte Konten identifizieren und entfernen können, um Geld zu sparen. Es gibt auch einige Ansätze, die zu unnötigen Ausgaben führen können, z. B. wenn ein Personendokument anstelle eines Mail-Ins für geteilte Mailboxen verwendet wird. Wir zeigen Ihnen solche Fälle und deren Lösungen. Und natürlich erklären wir Ihnen das neue Lizenzmodell.
Nehmen Sie an diesem Webinar teil, bei dem HCL-Ambassador Marc Thomas und Gastredner Franz Walder Ihnen diese neue Welt näherbringen. Es vermittelt Ihnen die Tools und das Know-how, um den Überblick zu bewahren. Sie werden in der Lage sein, Ihre Kosten durch eine optimierte Domino-Konfiguration zu reduzieren und auch in Zukunft gering zu halten.
Diese Themen werden behandelt
- Reduzierung der Lizenzkosten durch Auffinden und Beheben von Fehlkonfigurationen und überflüssigen Konten
- Wie funktionieren CCB- und CCX-Lizenzen wirklich?
- Verstehen des DLAU-Tools und wie man es am besten nutzt
- Tipps für häufige Problembereiche, wie z. B. Team-Postfächer, Funktions-/Testbenutzer usw.
- Praxisbeispiele und Best Practices zum sofortigen Umsetzen
Unlock the Future of Search with MongoDB Atlas_ Vector Search Unleashed.pdf
Discover how MongoDB Atlas and vector search technology can revolutionize your application's search capabilities. This comprehensive presentation covers:
* What is Vector Search?
* Importance and benefits of vector search
* Practical use cases across various industries
* Step-by-step implementation guide
* Live demos with code snippets
* Enhancing LLM capabilities with vector search
* Best practices and optimization strategies
Perfect for developers, AI enthusiasts, and tech leaders. Learn how to leverage MongoDB Atlas to deliver highly relevant, context-aware search results, transforming your data retrieval process. Stay ahead in tech innovation and maximize the potential of your applications.
#MongoDB #VectorSearch #AI #SemanticSearch #TechInnovation #DataScience #LLM #MachineLearning #SearchTechnology
National Security Agency - NSA mobile device best practices
Threats to mobile devices are more prevalent and increasing in scope and complexity. Users of mobile devices desire to take full advantage of the features
available on those devices, but many of the features provide convenience and capability but sacrifice security. This best practices guide outlines steps the users can take to better protect personal devices and information.
Microsoft - Power Platform_G.Aspiotis.pdf
Revolutionizing Application Development
with AI-powered low-code, presentation by George Aspiotis, Sr. Partner Development Manager, Microsoft
20240609 QFM020 Irresponsible AI Reading List May 2024
Everything I found interesting about the irresponsible use of machine intelligence in May 2024
Recently uploaded (20)
Best 20 SEO Techniques To Improve Website Visibility In SERP
Best 20 SEO Techniques To Improve Website Visibility In SERP
Observability Concepts EVERY Developer Should Know -- DeveloperWeek Europe.pdf
Observability Concepts EVERY Developer Should Know -- DeveloperWeek Europe.pdf
GraphSummit Singapore | Neo4j Product Vision & Roadmap - Q2 2024
GraphSummit Singapore | Neo4j Product Vision & Roadmap - Q2 2024
UiPath Test Automation using UiPath Test Suite series, part 6
UiPath Test Automation using UiPath Test Suite series, part 6
“Building and Scaling AI Applications with the Nx AI Manager,” a Presentation...
“Building and Scaling AI Applications with the Nx AI Manager,” a Presentation...
AI 101: An Introduction to the Basics and Impact of Artificial Intelligence
AI 101: An Introduction to the Basics and Impact of Artificial Intelligence
UiPath Test Automation using UiPath Test Suite series, part 5
UiPath Test Automation using UiPath Test Suite series, part 5
How to Get CNIC Information System with Paksim Ga.pptx
How to Get CNIC Information System with Paksim Ga.pptx
20240605 QFM017 Machine Intelligence Reading List May 2024
20240605 QFM017 Machine Intelligence Reading List May 2024
HCL Notes and Domino License Cost Reduction in the World of DLAU
HCL Notes and Domino License Cost Reduction in the World of DLAU
Full-RAG: A modern architecture for hyper-personalization
Full-RAG: A modern architecture for hyper-personalization
HCL Notes und Domino Lizenzkostenreduzierung in der Welt von DLAU
HCL Notes und Domino Lizenzkostenreduzierung in der Welt von DLAU
Unlock the Future of Search with MongoDB Atlas_ Vector Search Unleashed.pdf
Unlock the Future of Search with MongoDB Atlas_ Vector Search Unleashed.pdf
National Security Agency - NSA mobile device best practices
National Security Agency - NSA mobile device best practices
20240609 QFM020 Irresponsible AI Reading List May 2024
20240609 QFM020 Irresponsible AI Reading List May 2024
Day 6 interpreting graphs
- 1. NAME: __________________________ DATE: ___________ DAY 6 – Interpreting Graphs Directions: The following three graphs show the relationship between TIME and DISTANCE traveled by a cyclist. a) Describe the relationship shown in this graph. Make up a story about the cyclist that could be modeled by the graph. b) Over what interval in the graph is the cyclist traveling the fastest? The slowest? Not moving at all? Explain how you know. a) Distance Distance ce b) Time a) Distance b) Time a) Distance b) Time
- 2. 2) Directions: Read the story about Mr. T. Go back, read the story a second time and sketch a graph that matches Mr. T’s race. Mr. T ran a 10 mile race last weekend. He paced himself, running at a good but steady pace for the first 5 miles. He increased his pace during the next 4 miles. For the last mile, he was tiring but kept moving and managed to come in second place! Now that you’re an expert, study the graph below!……….. car bus a. Label the x and y-axis. Describe why you chose each label. b. Write a short story about the car and bus that matches the information given in the graph.