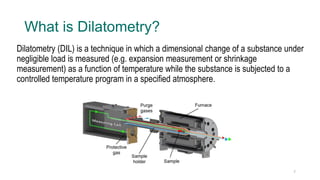
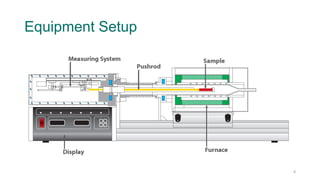
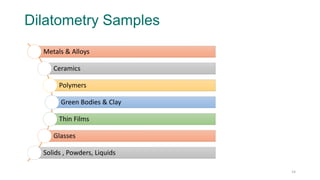
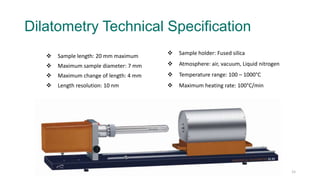
The Basics of Dilatometer
Theory and Data Analysis
1
Contents
1
• What is dilatometry
2
• Thermal Expansion
• Experimental Setup
3
• Dilatometry Samples
4
• Applications
5
• Methodology
6
• Data Analysis
2
3
Thermal Expansion & Thermal
Expansion Coefficient
Thermal Expansion - Background
Thermal Expansion
Background
 Most materials undergo
dimensional changes during
heating or cooling.
 Generally, the dimensions of
a solid or liquid increase
during heating and decrease
during cooling.
 There are only few
exceptions.
Sintering, Shrinkage
• During phase transitions or
during a sintering process,
substances can show a
shrinkage.
• During a sintering process,
such shrinkages steps are
irreversible and lead to a
permanent increase in
density and robustness.
4
Thermal Expansion - Background
5
What is Dilatometry?
Dilatometry (DIL) is a technique in which a dimensional change of a substance under
negligible load is measured (e.g. expansion measurement or shrinkage
measurement) as a function of temperature while the substance is subjected to a
controlled temperature program in a specified atmosphere.
7
Equipment Setup
8
9
Dilatometer Overview: -263℃ up to 2800℃
10
Measuring System for DIL
Sample Carrier
11
Accessories for Dilatometry
12
13
Furnace Program for DIL
Dilatometry Samples
Metals & Alloys
Ceramics
Polymers
Green Bodies & Clay
Thin Films
Glasses
Solids , Powders, Liquids
14
Dilatometry Technical Specification
 Sample length: 20 mm maximum
 Maximum sample diameter: 7 mm
 Maximum change of length: 4 mm
 Length resolution: 10 nm
15
 Sample holder: Fused silica
 Atmosphere: air, vacuum, Liquid nitrogen
 Temperature range: 100 – 1000°C
 Maximum heating rate: 100°C/min
Applications
Linear Thermal Expansion
Coefficient of Thermal Expansion
Phase Transition Temperatures
Sintering Temperatures
Glass Transition Temperatures
Dilatometry Softening points
Volume expansion
Density Change
Sintering Kinetics
16
Interpretation of Dilatometer Graph
THERMAL
EXPANSION
DL/LO
TEMPERATURE C
Co-efficient
of
Thermal
Expansion
dl/dT
T1
T2
Axis Labels
Baseline
Expansion and Shrinkage
Slope
Inflection Points
Plateaus
Peaks and Troughs
Transition Temperatures
Comparisons
Data Analysis
18
20
Thermal Expansion Coefficient of LaCrO3
Determination of the Glass Transition
21
Glass Transition of Polymer
Comparison TMA and DSC
22
23
Glass — Thermal Expansion, Glass
Transition, Softening
Presented in the figure are three tests on the same type of glass but from different batches. It can
clearly be seen that the coefficients of thermal expansion are in good agreement within the instrument’s
uncertainty boundaries. The Glass Transition Temperature temperature and the softening point of
sample #3 (blue curve) show slightly lower values, indicating a slightly different composition.
Ceramic Sintering
24
Sintering of Clay
25
Thin Film- Epoxy Film on Glass Substrate
26
Phase Transition-Steel
27
28
Iron – Phase Transition
The sample was measured at a heating rate of 5 K/min in a helium atmosphere. At 906°C (peak temperature in the
physical alpha) a shrinkage step was detected. This is due to a change in the lattice structure (bcc -> fcc). Another
change in the lattice structure (fcc -> bcc) was detected at 1409°C. The deviation between the measured and literature
transition temperatures is due to a small impurity content.
29
Phase Transition-SiO2
30
Phase Transition-SiO2
31
Density Change – Powders & Melts
32
33
Optimization of Casting Process
34
Density
Thermal behavior of an aluminum-based alloy, heating rate: 5 K/min, He atmosphere, alumina sample holder, alumina
container. Displayed are the Volumetric Expansion (black solid line), the curve of the calculated density change (red
solid line) as well as the c-DTA® curve (blue dashed line).
Conclusion
• What is dilatometry and what is it used to measure
• Basic setup of a dilatometer
• Analysis of data from the instrument
35
Thank You..!
36

Dilatometer.pptx

  • 1.
    The Basics ofDilatometer Theory and Data Analysis 1
  • 2.
    Contents 1 • What isdilatometry 2 • Thermal Expansion • Experimental Setup 3 • Dilatometry Samples 4 • Applications 5 • Methodology 6 • Data Analysis 2
  • 3.
    3 Thermal Expansion &Thermal Expansion Coefficient
  • 4.
    Thermal Expansion -Background Thermal Expansion Background  Most materials undergo dimensional changes during heating or cooling.  Generally, the dimensions of a solid or liquid increase during heating and decrease during cooling.  There are only few exceptions. Sintering, Shrinkage • During phase transitions or during a sintering process, substances can show a shrinkage. • During a sintering process, such shrinkages steps are irreversible and lead to a permanent increase in density and robustness. 4
  • 5.
    Thermal Expansion -Background 5
  • 6.
    What is Dilatometry? Dilatometry(DIL) is a technique in which a dimensional change of a substance under negligible load is measured (e.g. expansion measurement or shrinkage measurement) as a function of temperature while the substance is subjected to a controlled temperature program in a specified atmosphere. 7
  • 7.
  • 8.
  • 9.
  • 10.
  • 11.
  • 12.
  • 13.
    Dilatometry Samples Metals &Alloys Ceramics Polymers Green Bodies & Clay Thin Films Glasses Solids , Powders, Liquids 14
  • 14.
    Dilatometry Technical Specification Sample length: 20 mm maximum  Maximum sample diameter: 7 mm  Maximum change of length: 4 mm  Length resolution: 10 nm 15  Sample holder: Fused silica  Atmosphere: air, vacuum, Liquid nitrogen  Temperature range: 100 – 1000°C  Maximum heating rate: 100°C/min
  • 15.
    Applications Linear Thermal Expansion Coefficientof Thermal Expansion Phase Transition Temperatures Sintering Temperatures Glass Transition Temperatures Dilatometry Softening points Volume expansion Density Change Sintering Kinetics 16
  • 16.
    Interpretation of DilatometerGraph THERMAL EXPANSION DL/LO TEMPERATURE C Co-efficient of Thermal Expansion dl/dT T1 T2 Axis Labels Baseline Expansion and Shrinkage Slope Inflection Points Plateaus Peaks and Troughs Transition Temperatures Comparisons Data Analysis 18
  • 17.
  • 18.
    Determination of theGlass Transition 21
  • 19.
    Glass Transition ofPolymer Comparison TMA and DSC 22
  • 20.
    23 Glass — ThermalExpansion, Glass Transition, Softening Presented in the figure are three tests on the same type of glass but from different batches. It can clearly be seen that the coefficients of thermal expansion are in good agreement within the instrument’s uncertainty boundaries. The Glass Transition Temperature temperature and the softening point of sample #3 (blue curve) show slightly lower values, indicating a slightly different composition.
  • 21.
  • 22.
  • 23.
    Thin Film- EpoxyFilm on Glass Substrate 26
  • 24.
  • 25.
    28 Iron – PhaseTransition The sample was measured at a heating rate of 5 K/min in a helium atmosphere. At 906°C (peak temperature in the physical alpha) a shrinkage step was detected. This is due to a change in the lattice structure (bcc -> fcc). Another change in the lattice structure (fcc -> bcc) was detected at 1409°C. The deviation between the measured and literature transition temperatures is due to a small impurity content.
  • 26.
  • 27.
  • 28.
    31 Density Change –Powders & Melts
  • 29.
  • 30.
  • 31.
    34 Density Thermal behavior ofan aluminum-based alloy, heating rate: 5 K/min, He atmosphere, alumina sample holder, alumina container. Displayed are the Volumetric Expansion (black solid line), the curve of the calculated density change (red solid line) as well as the c-DTA® curve (blue dashed line).
  • 32.
    Conclusion • What isdilatometry and what is it used to measure • Basic setup of a dilatometer • Analysis of data from the instrument 35
  • 33.