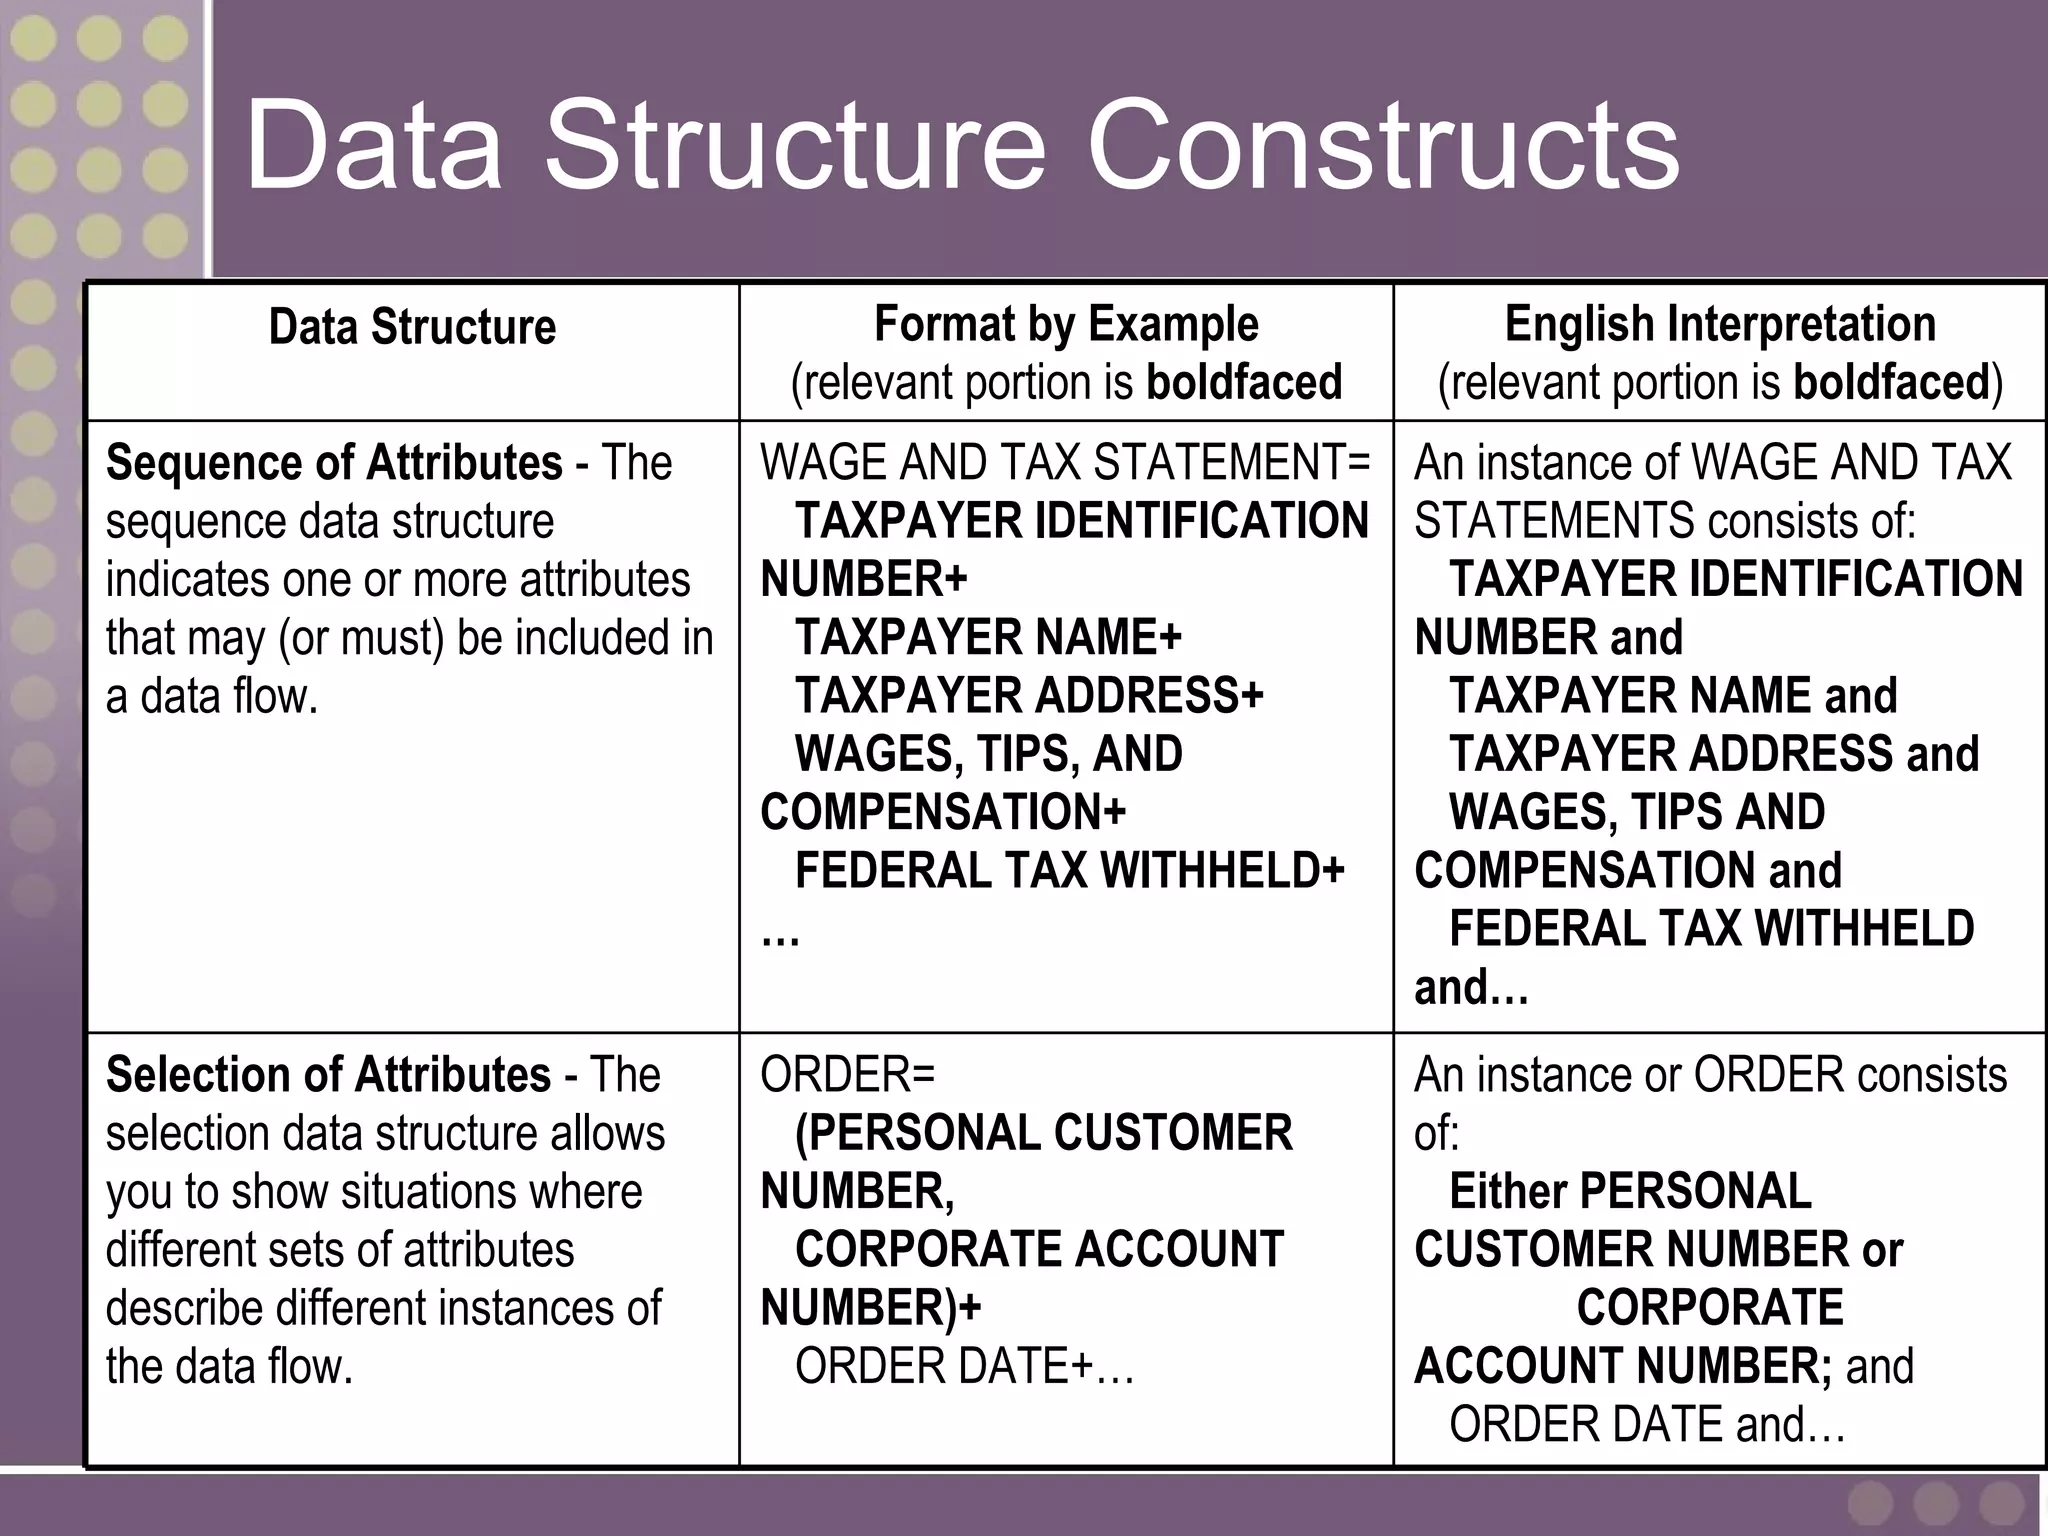
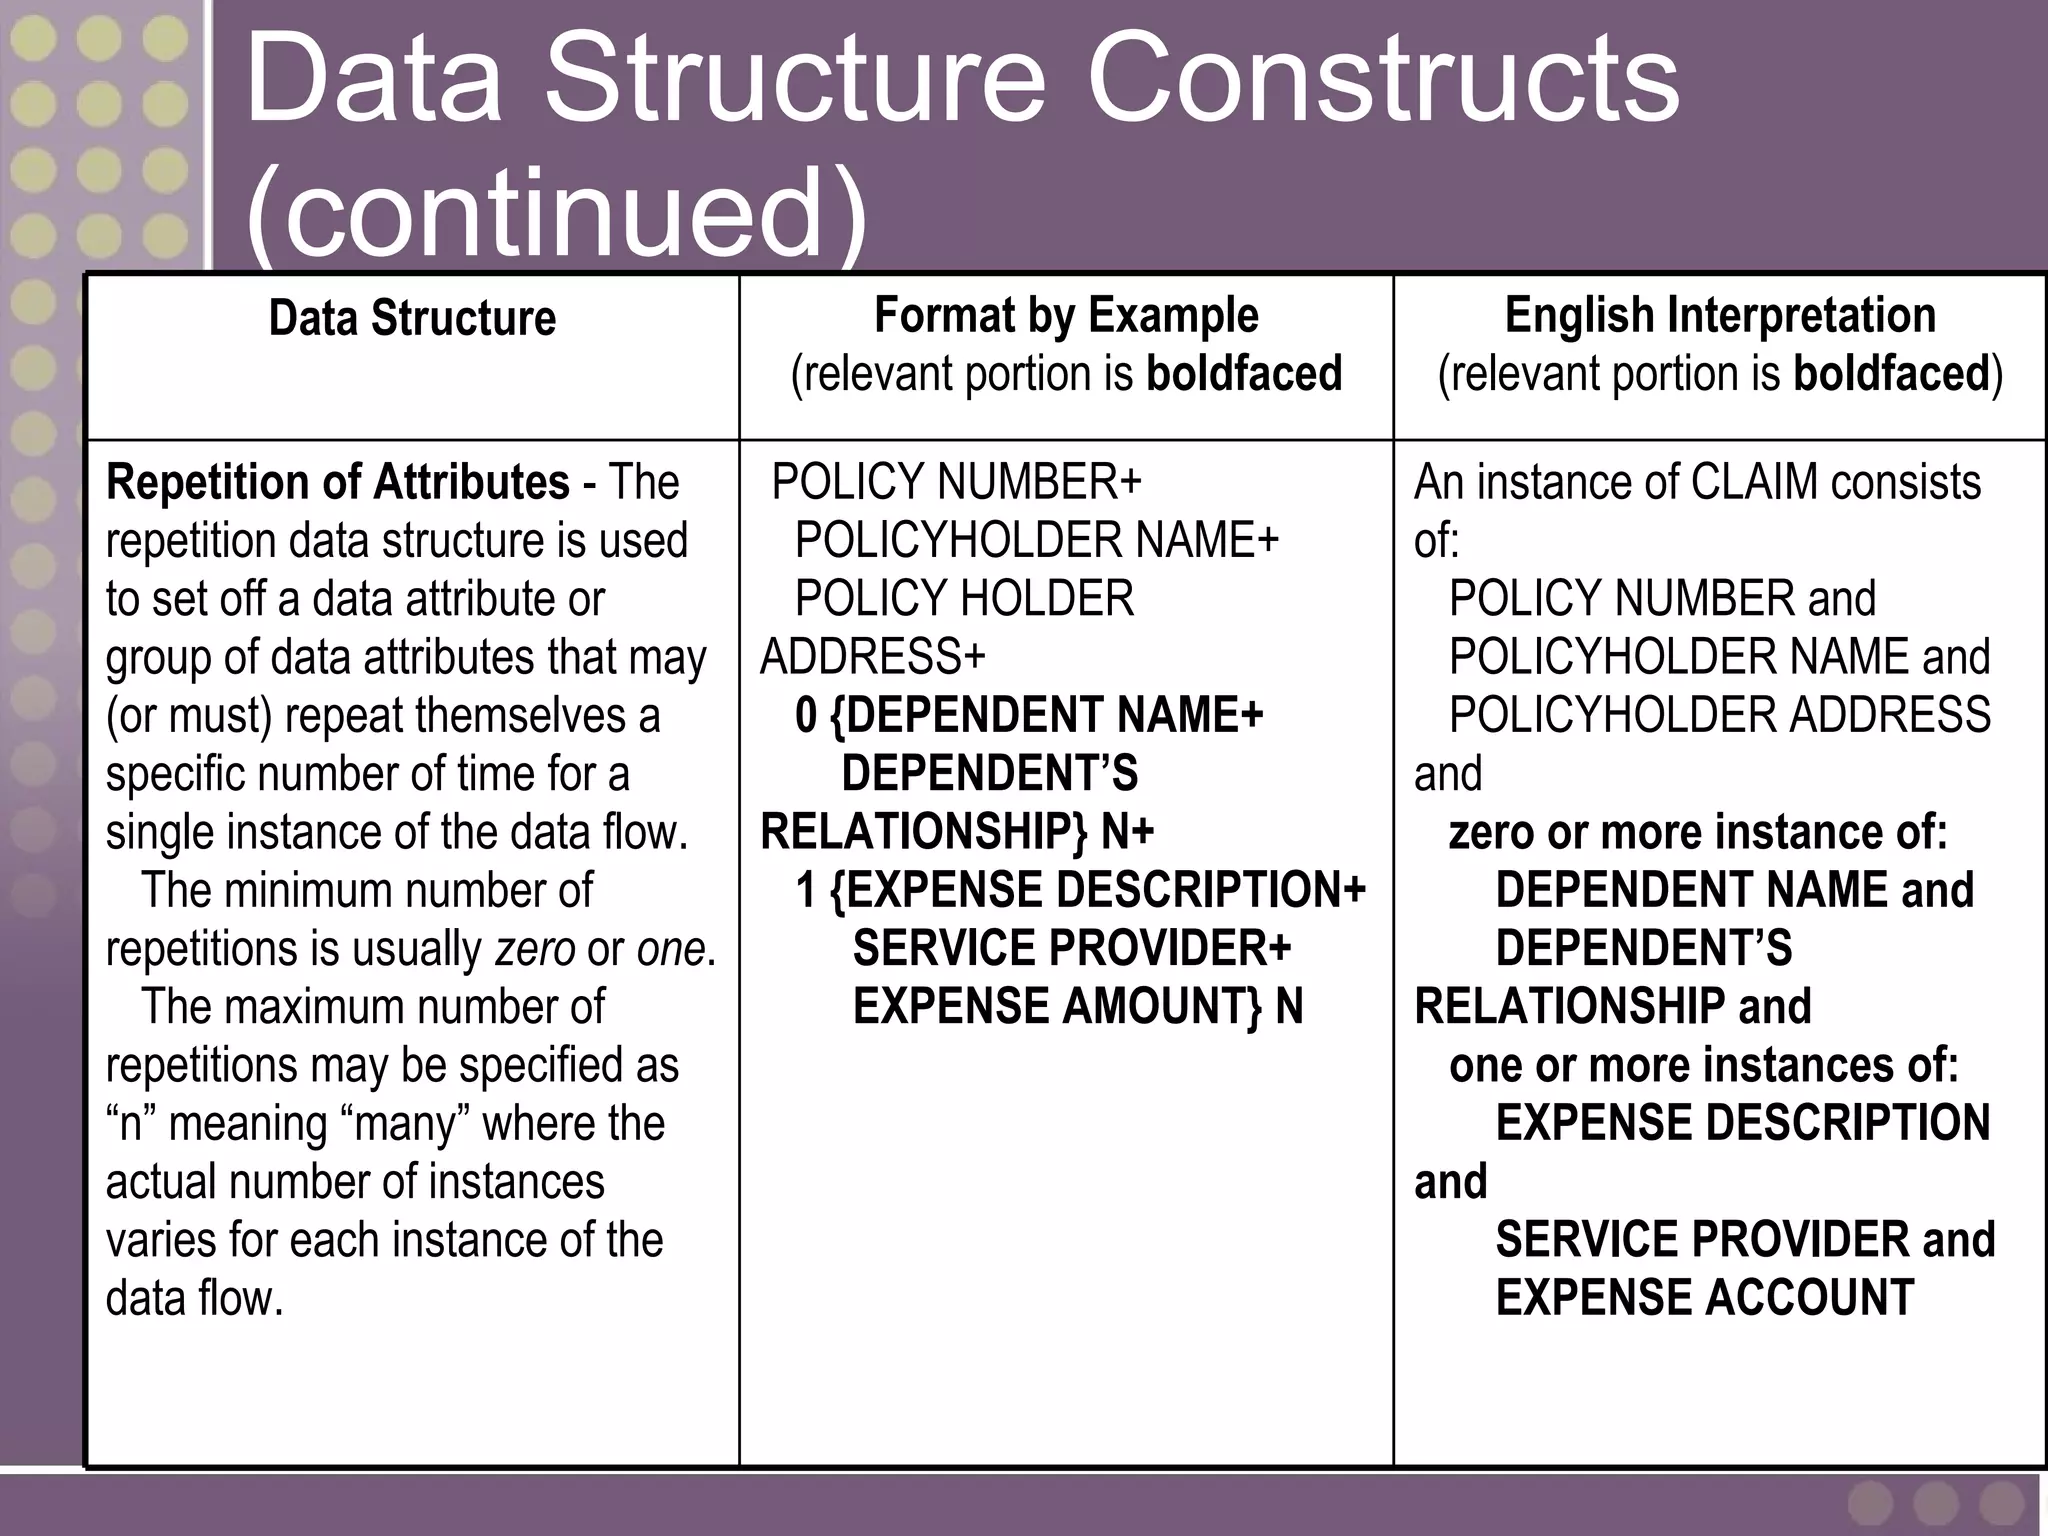
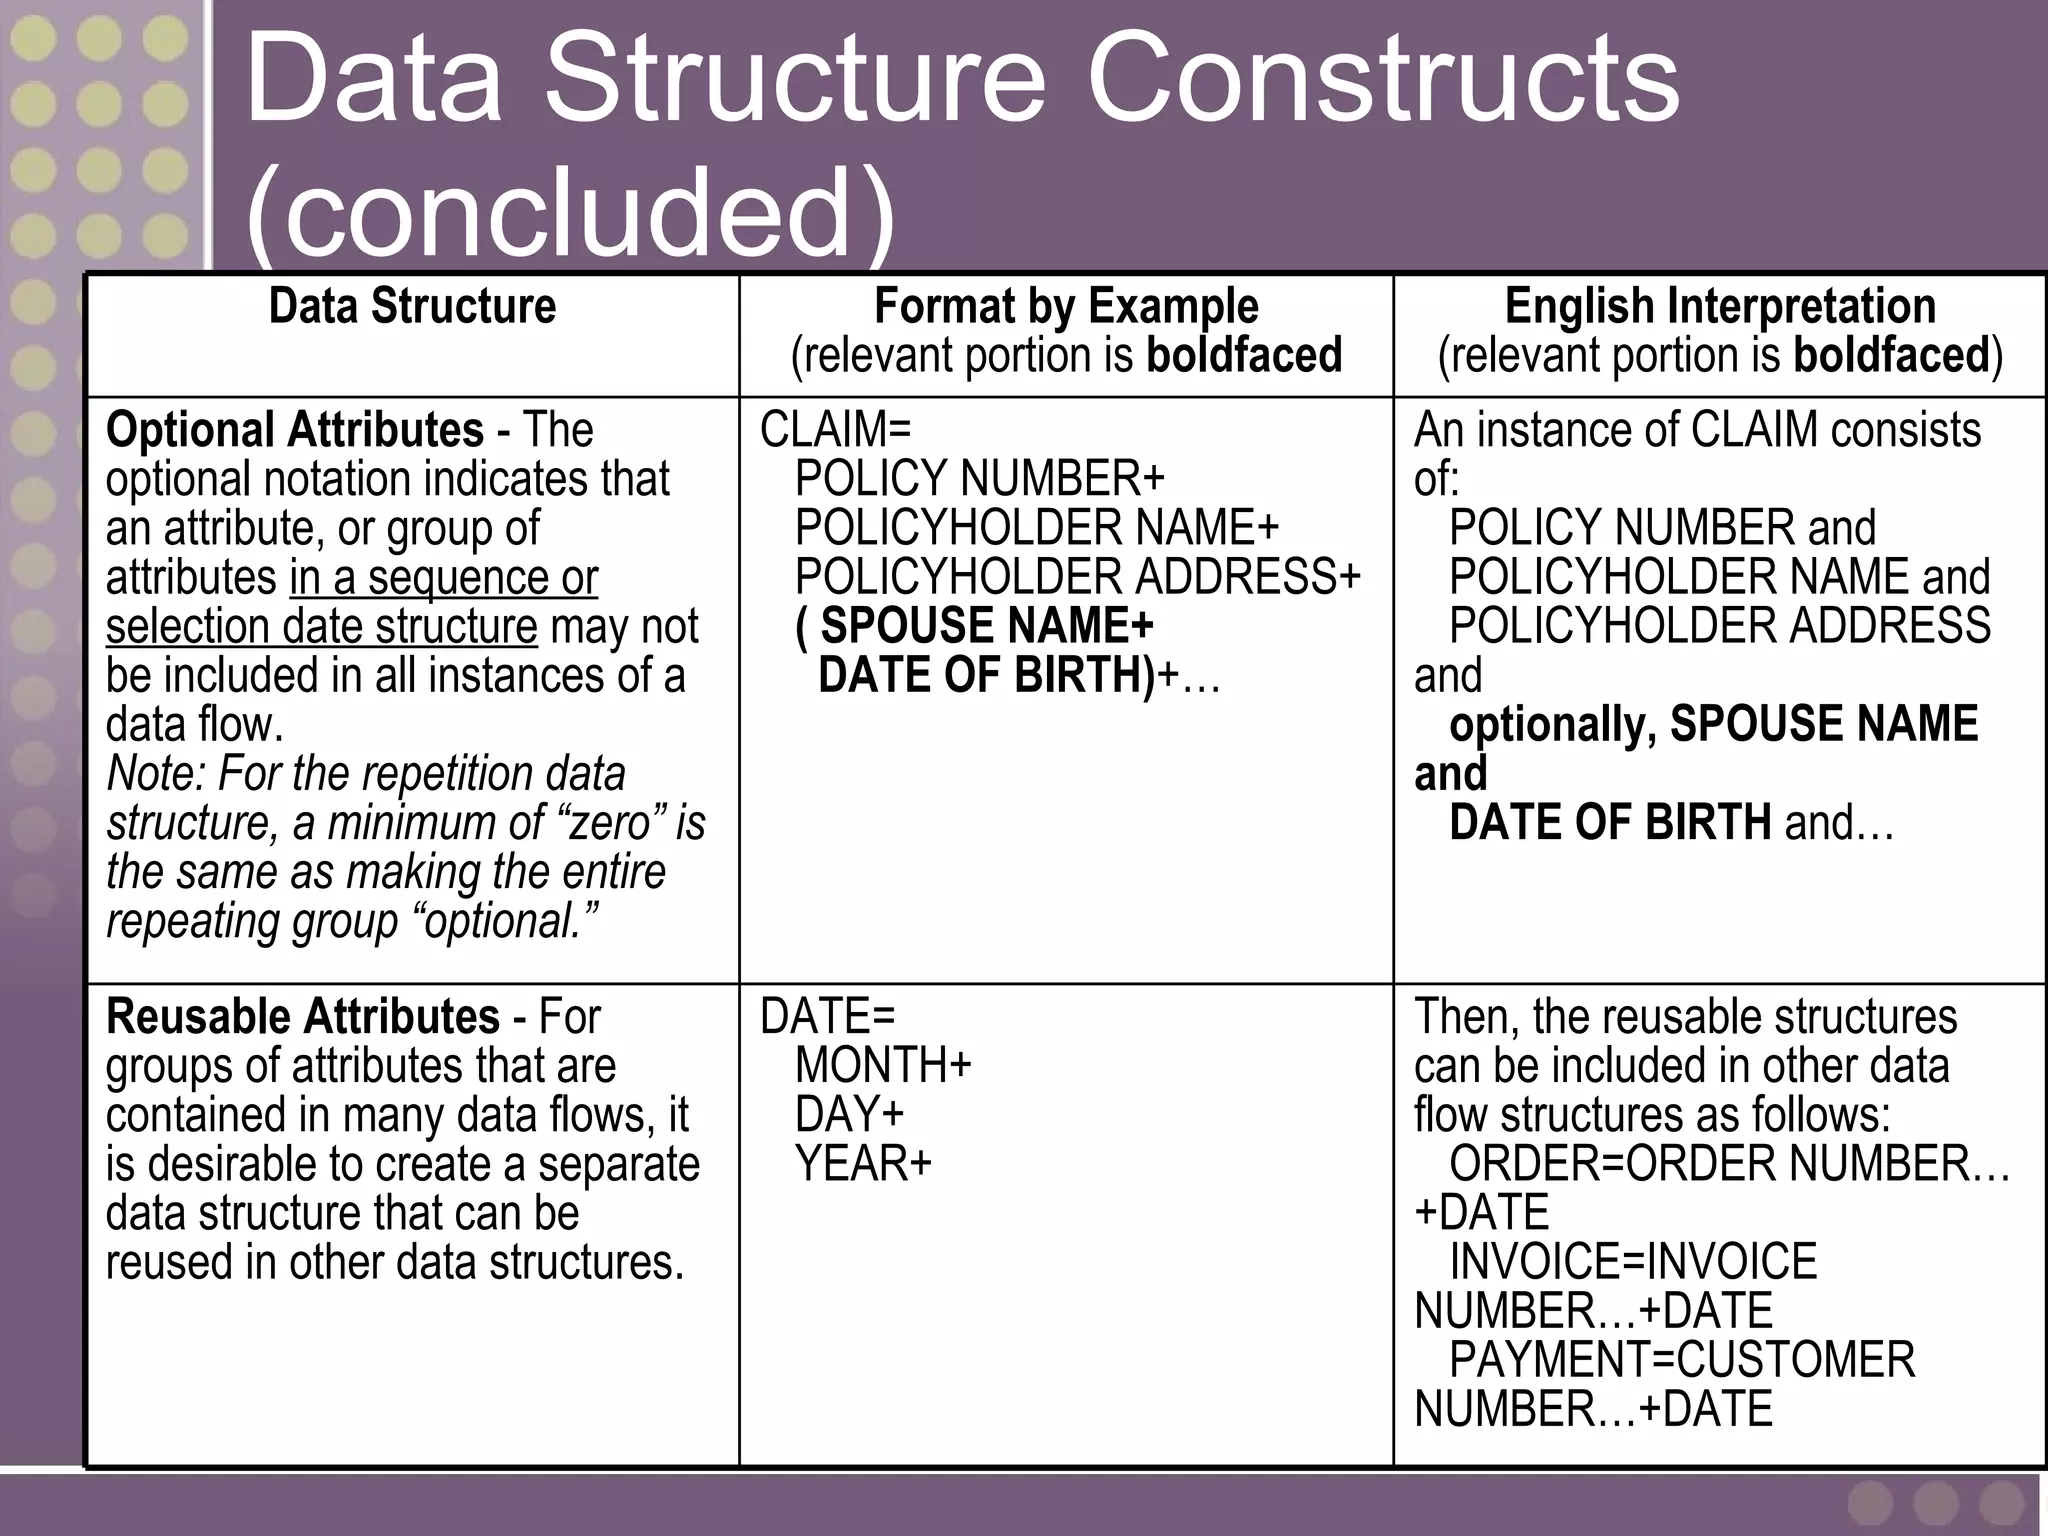
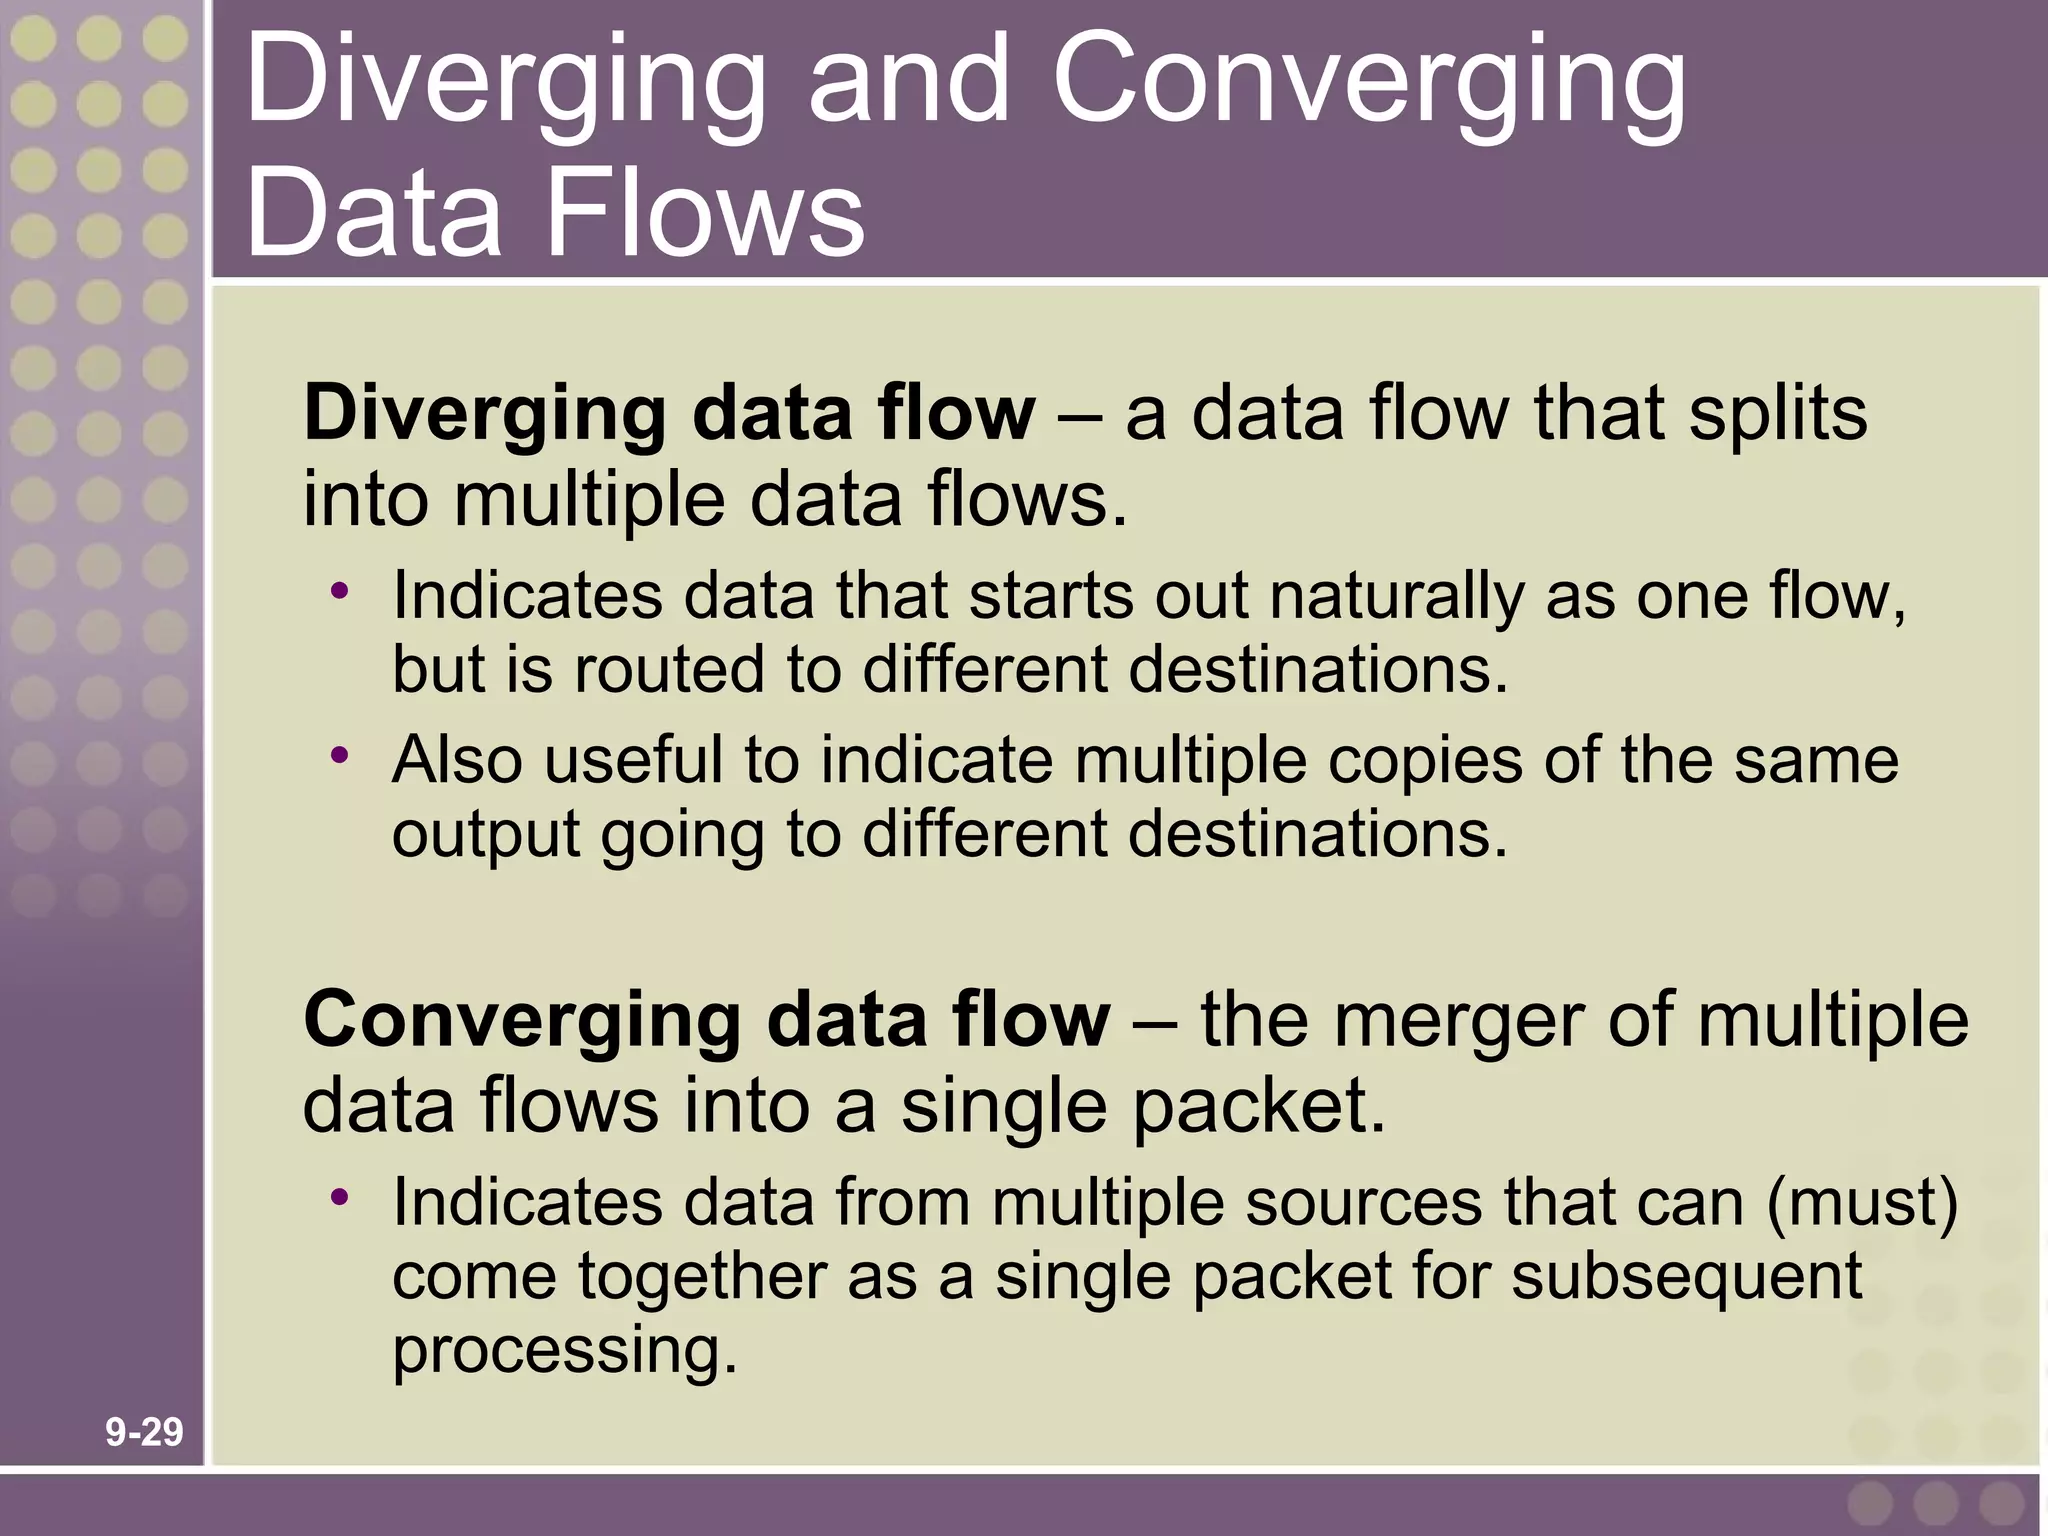
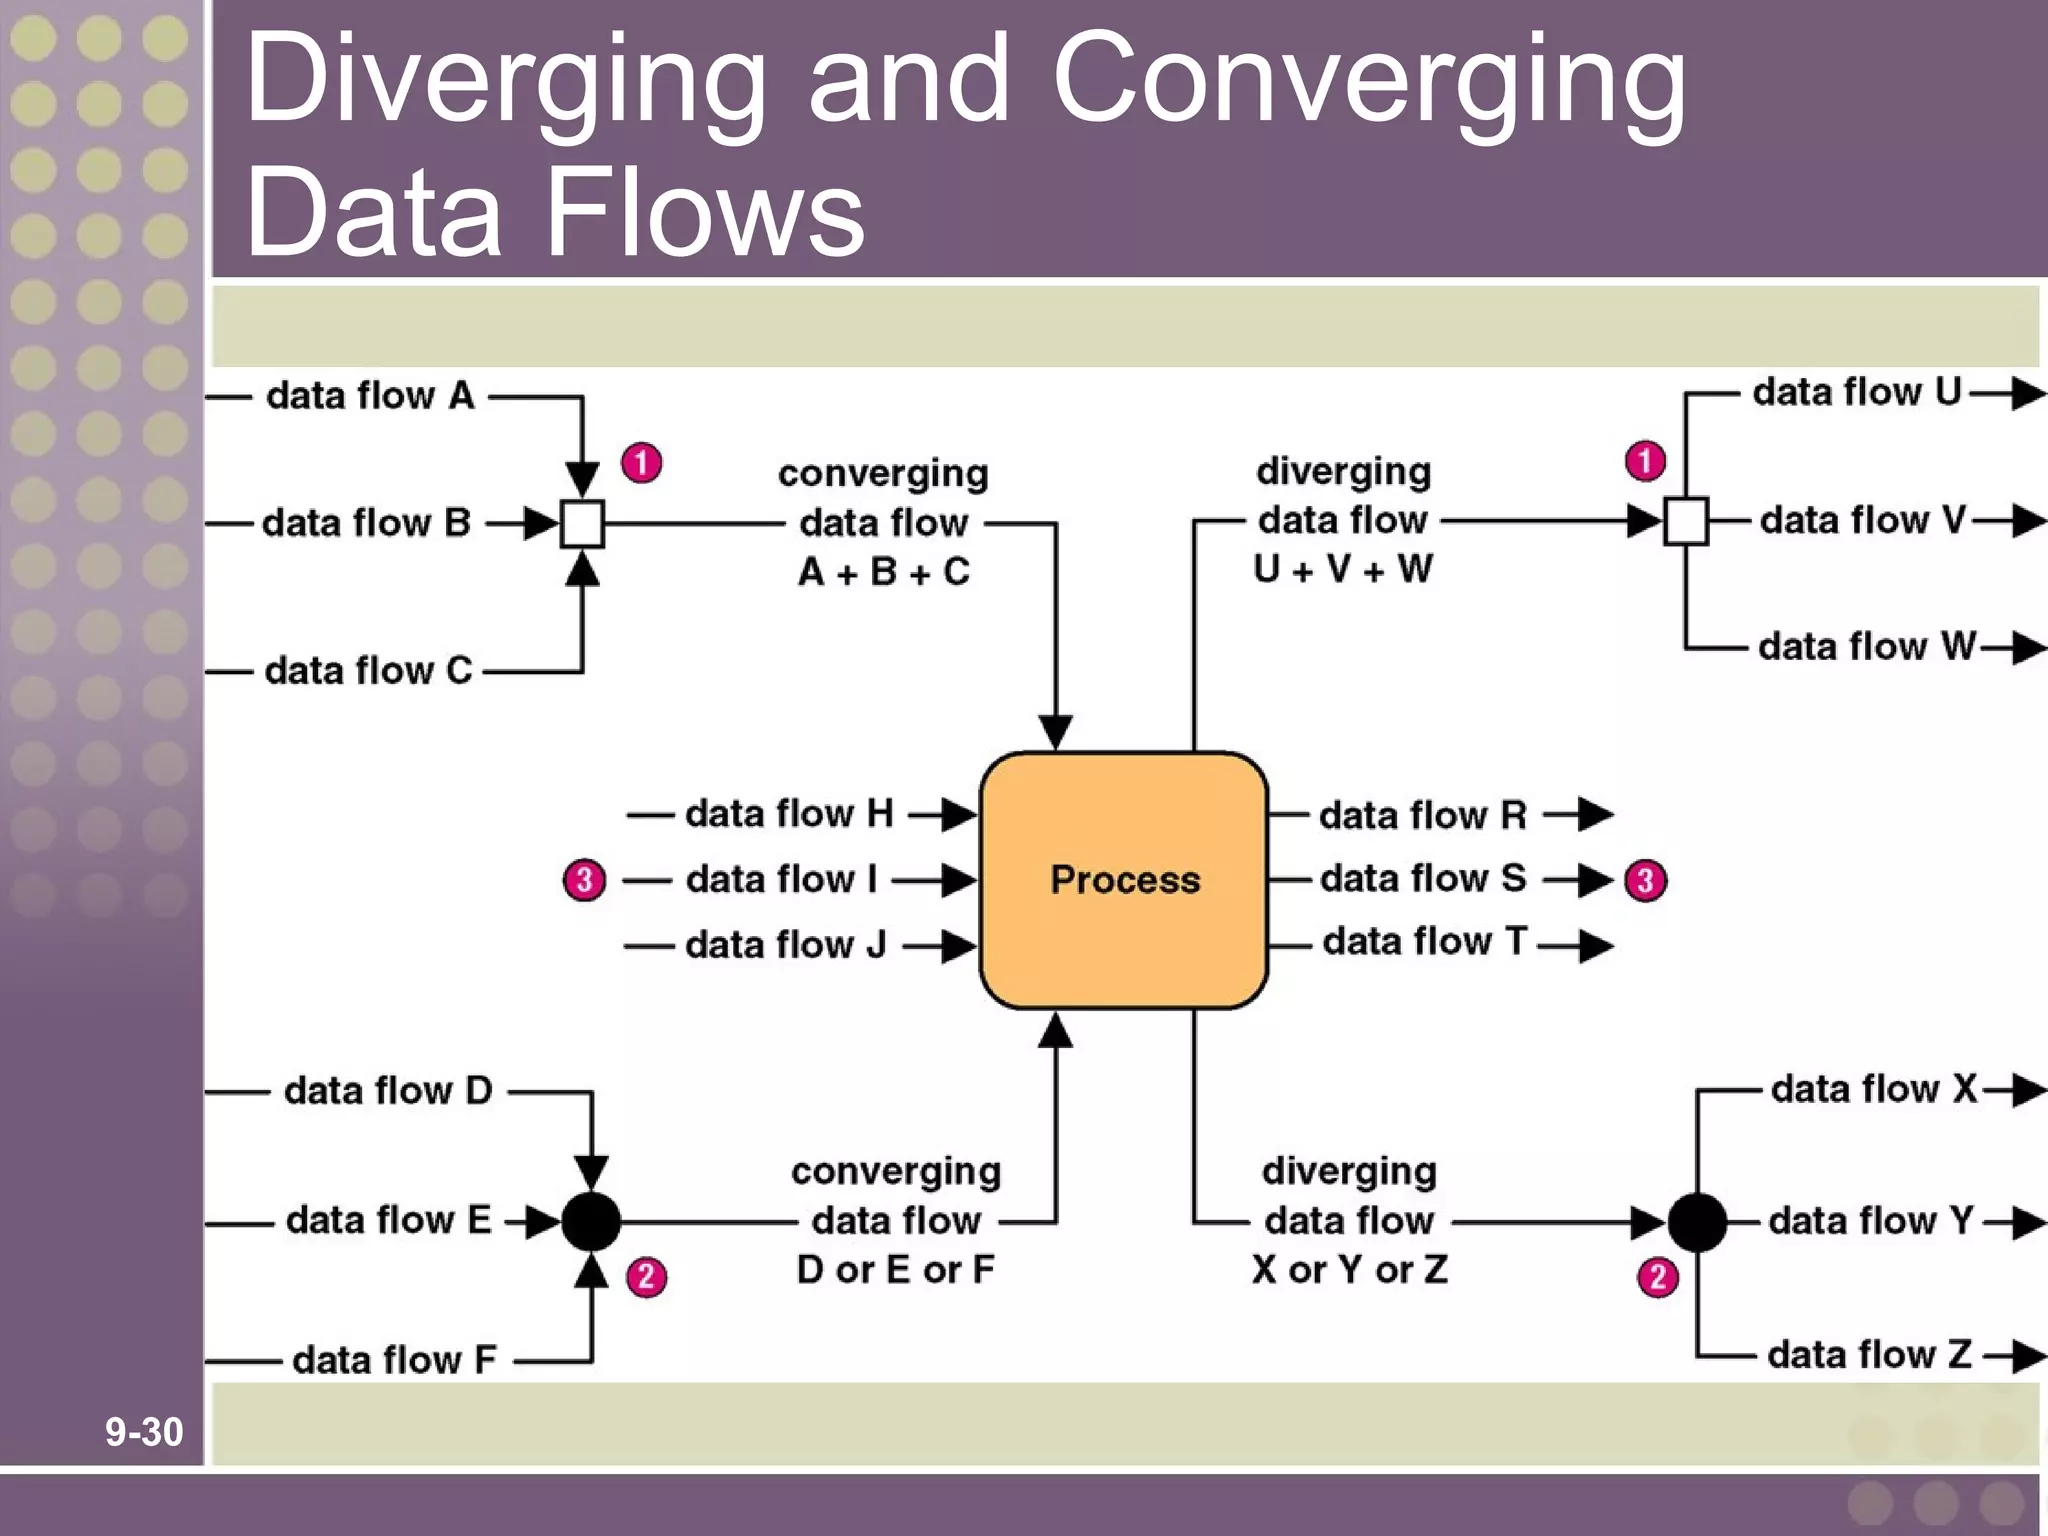
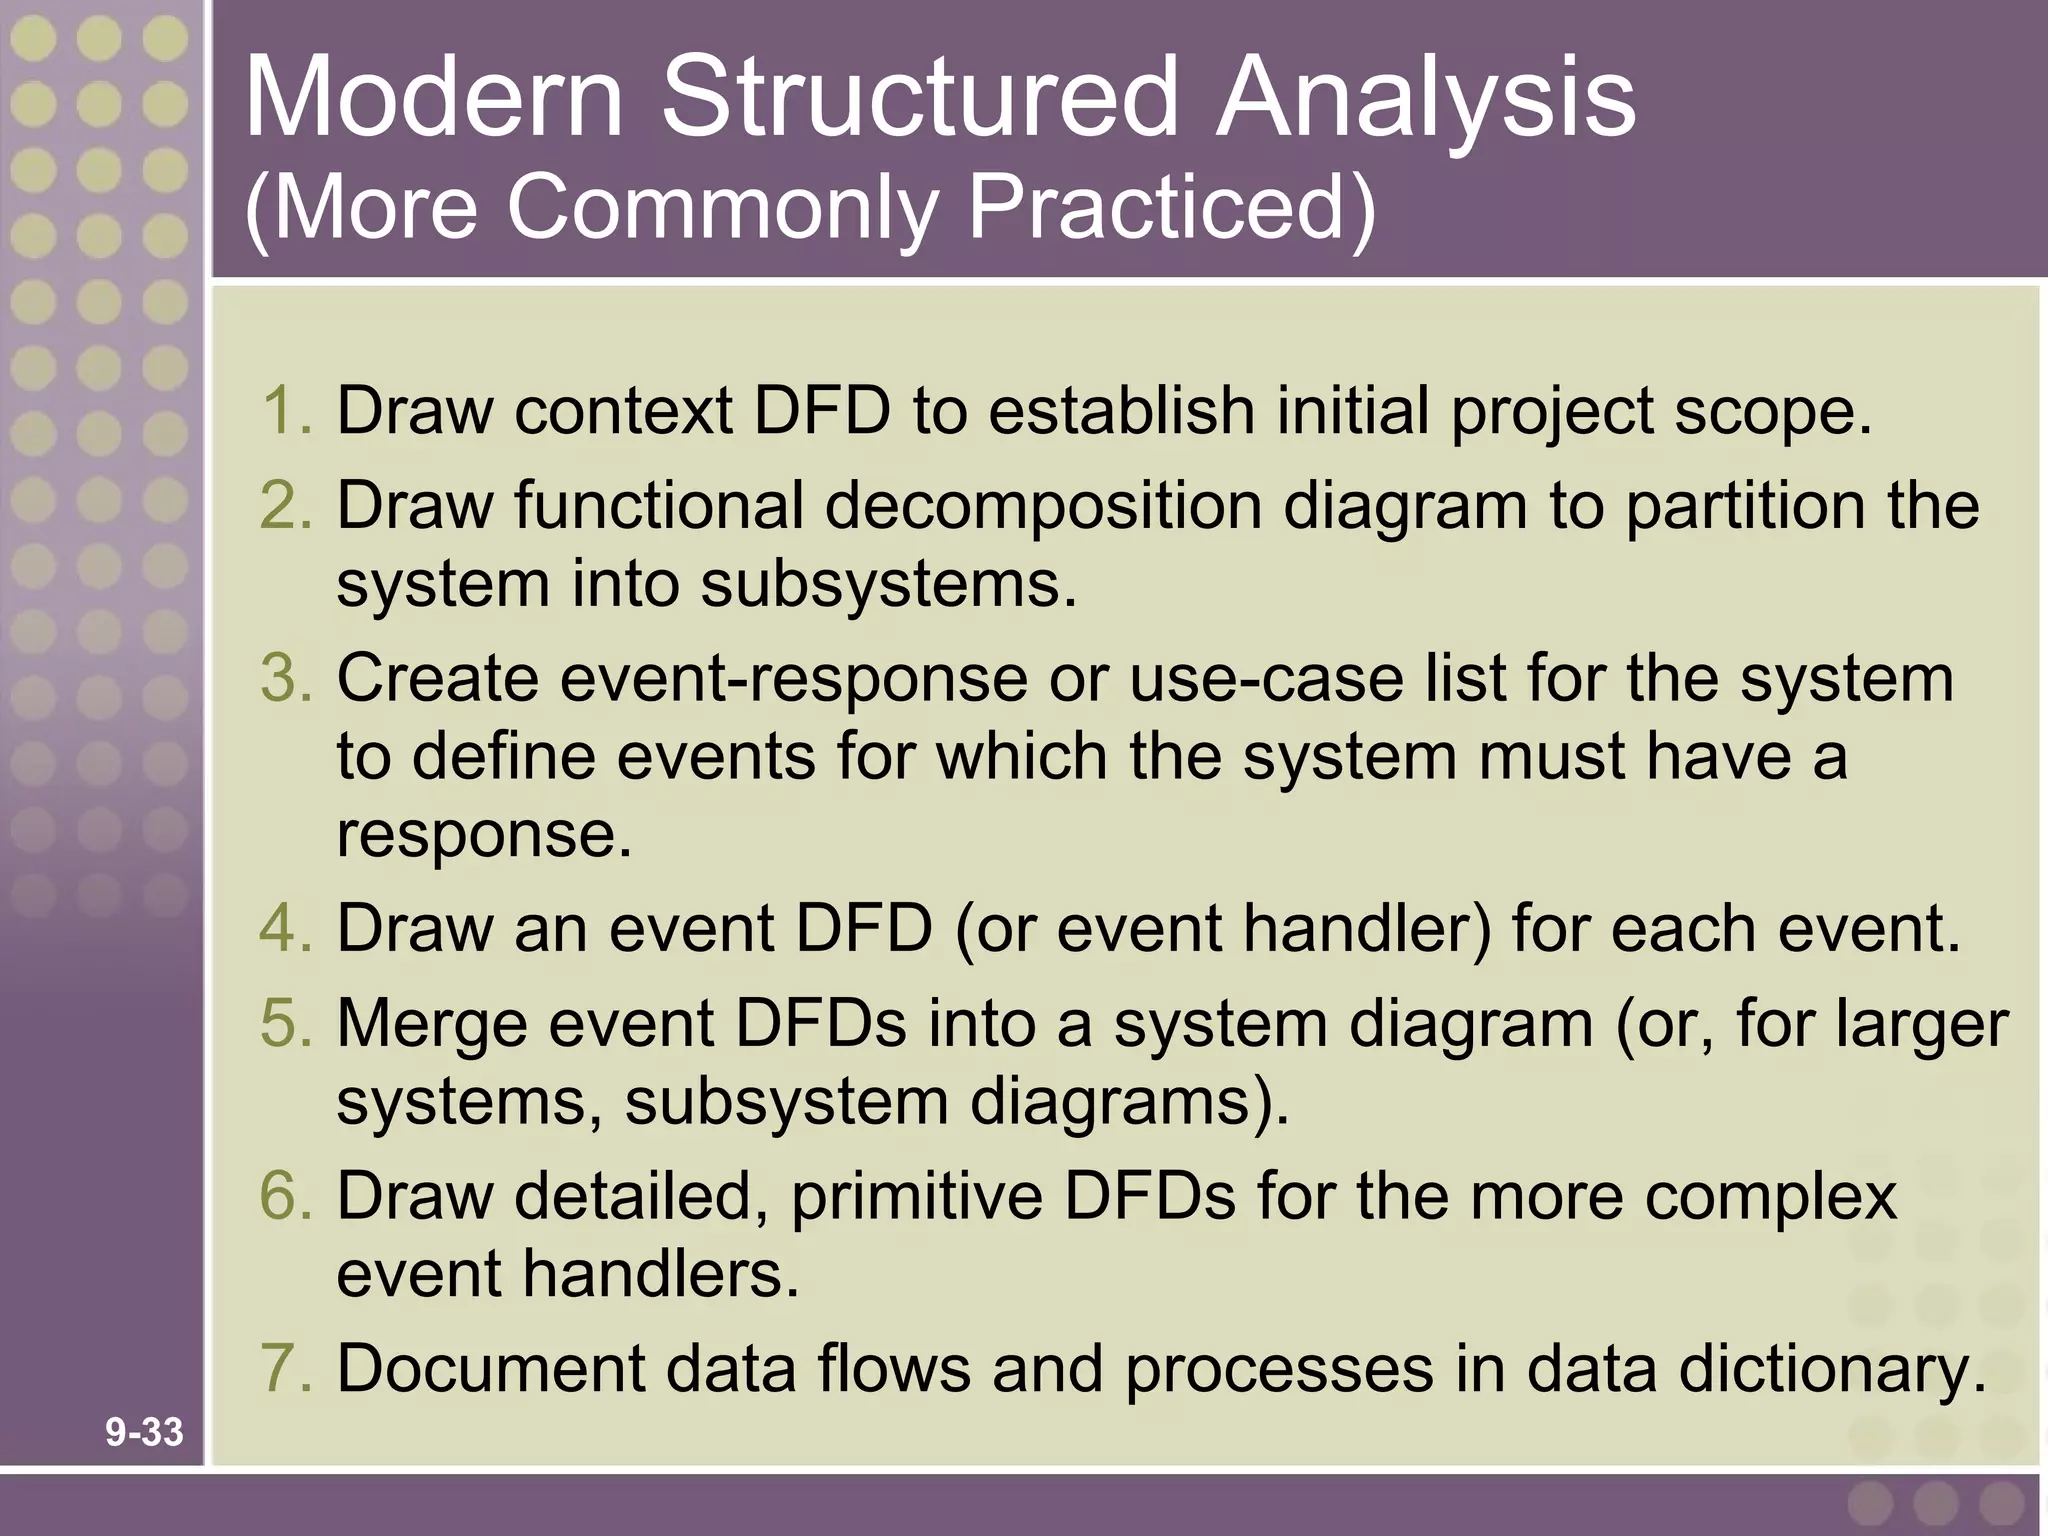
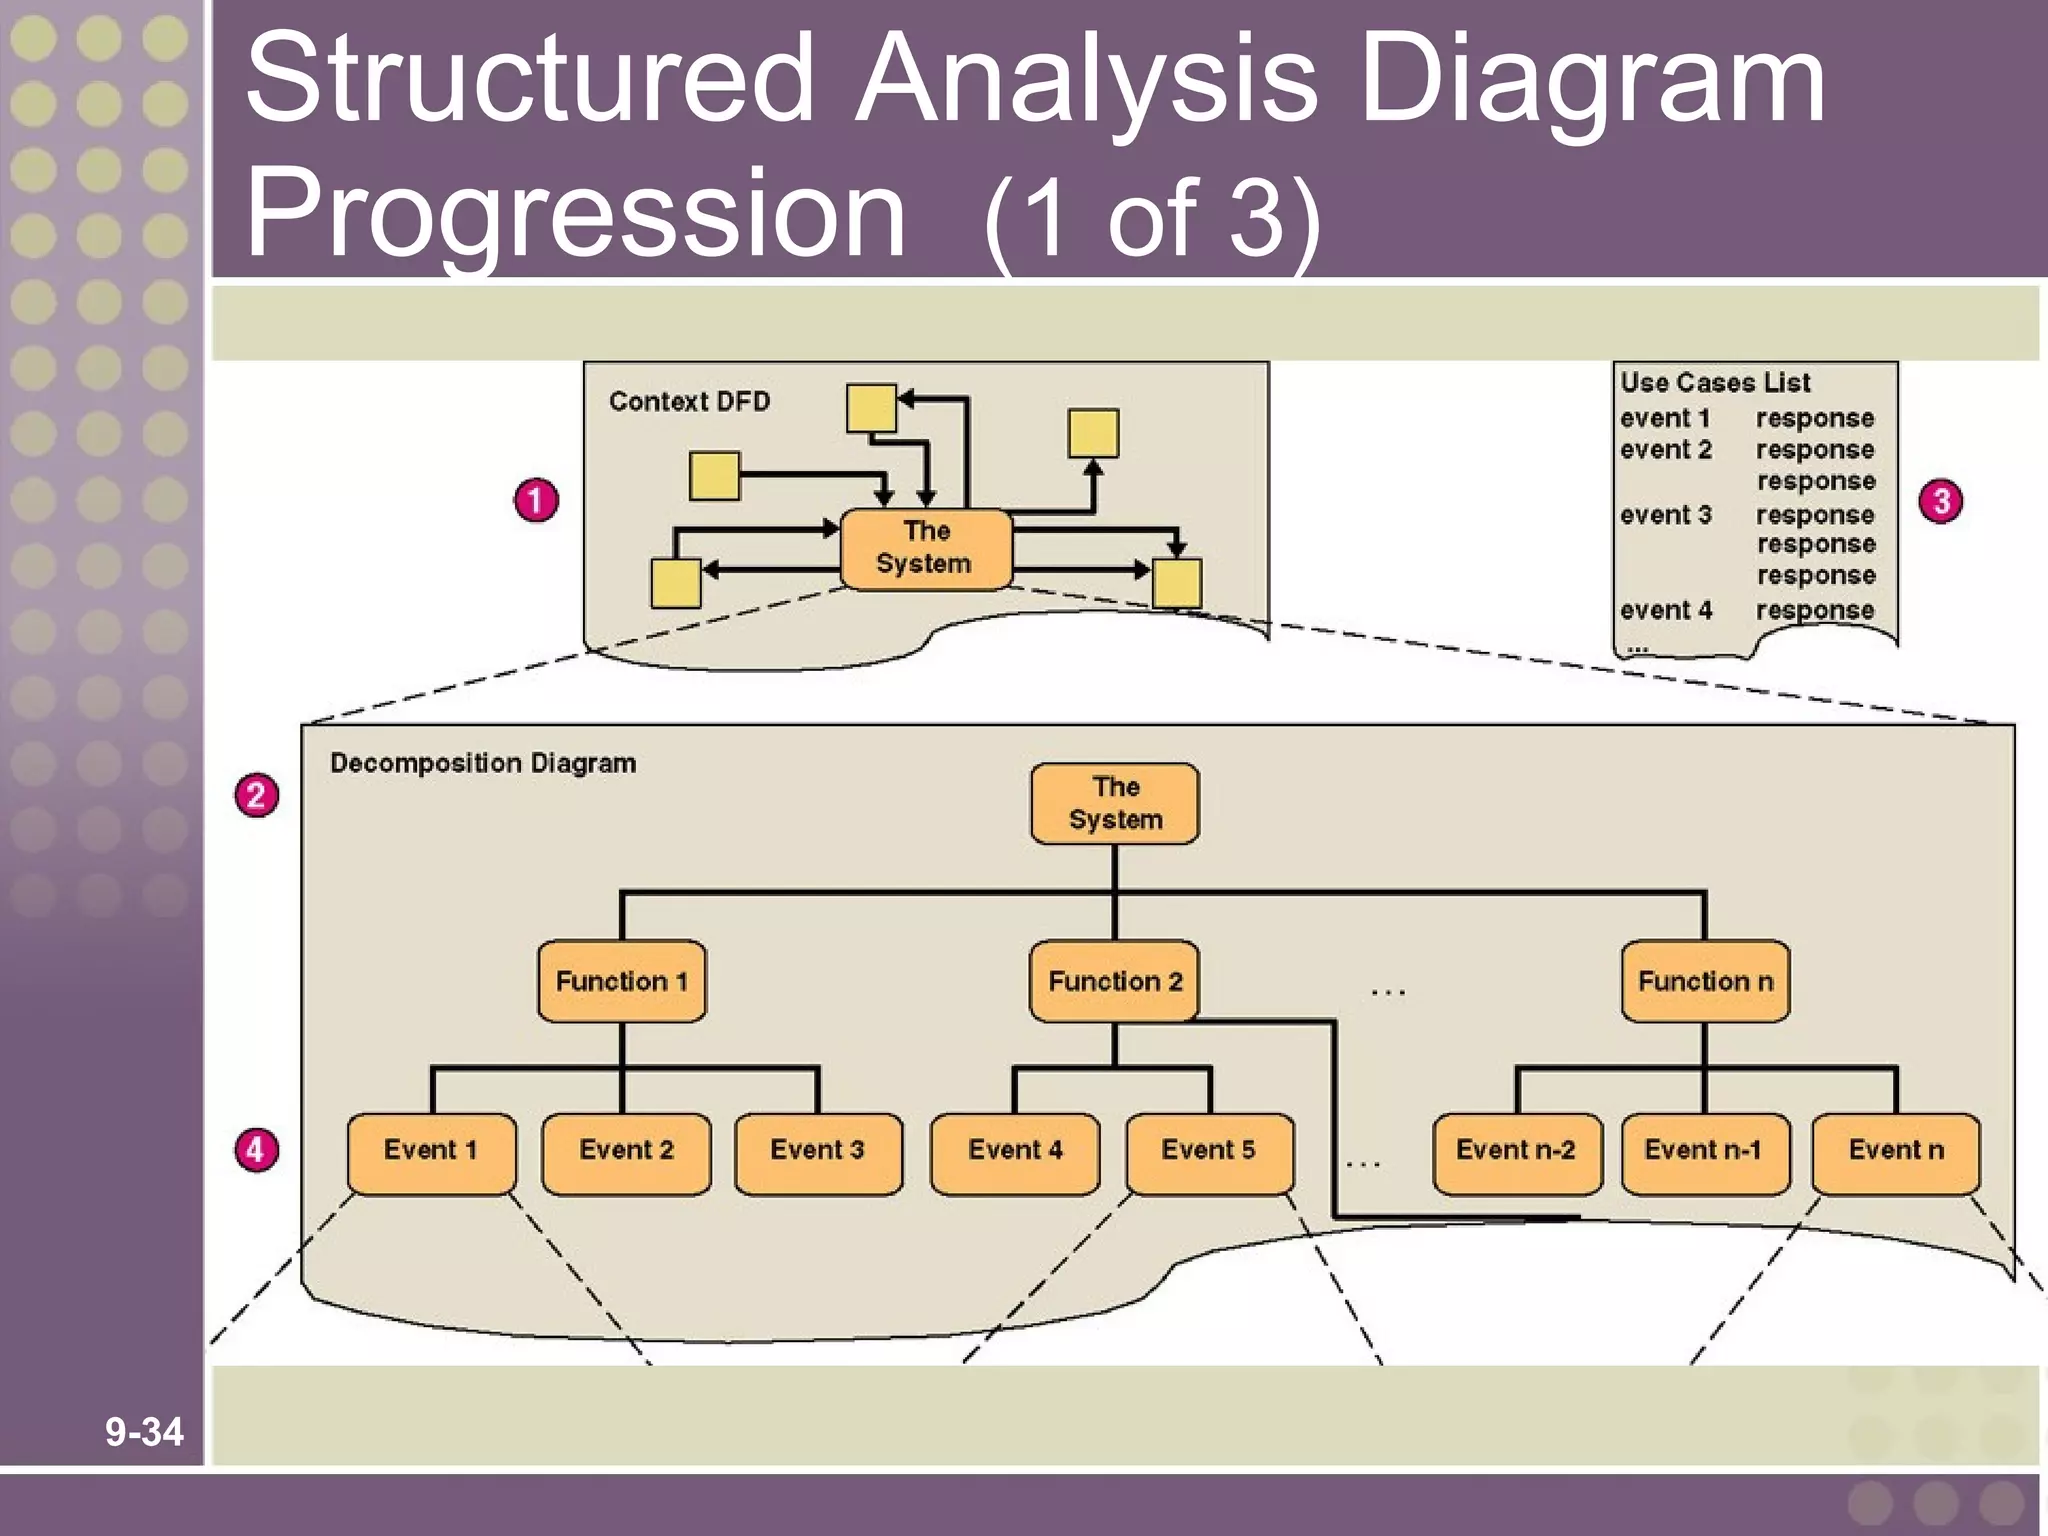
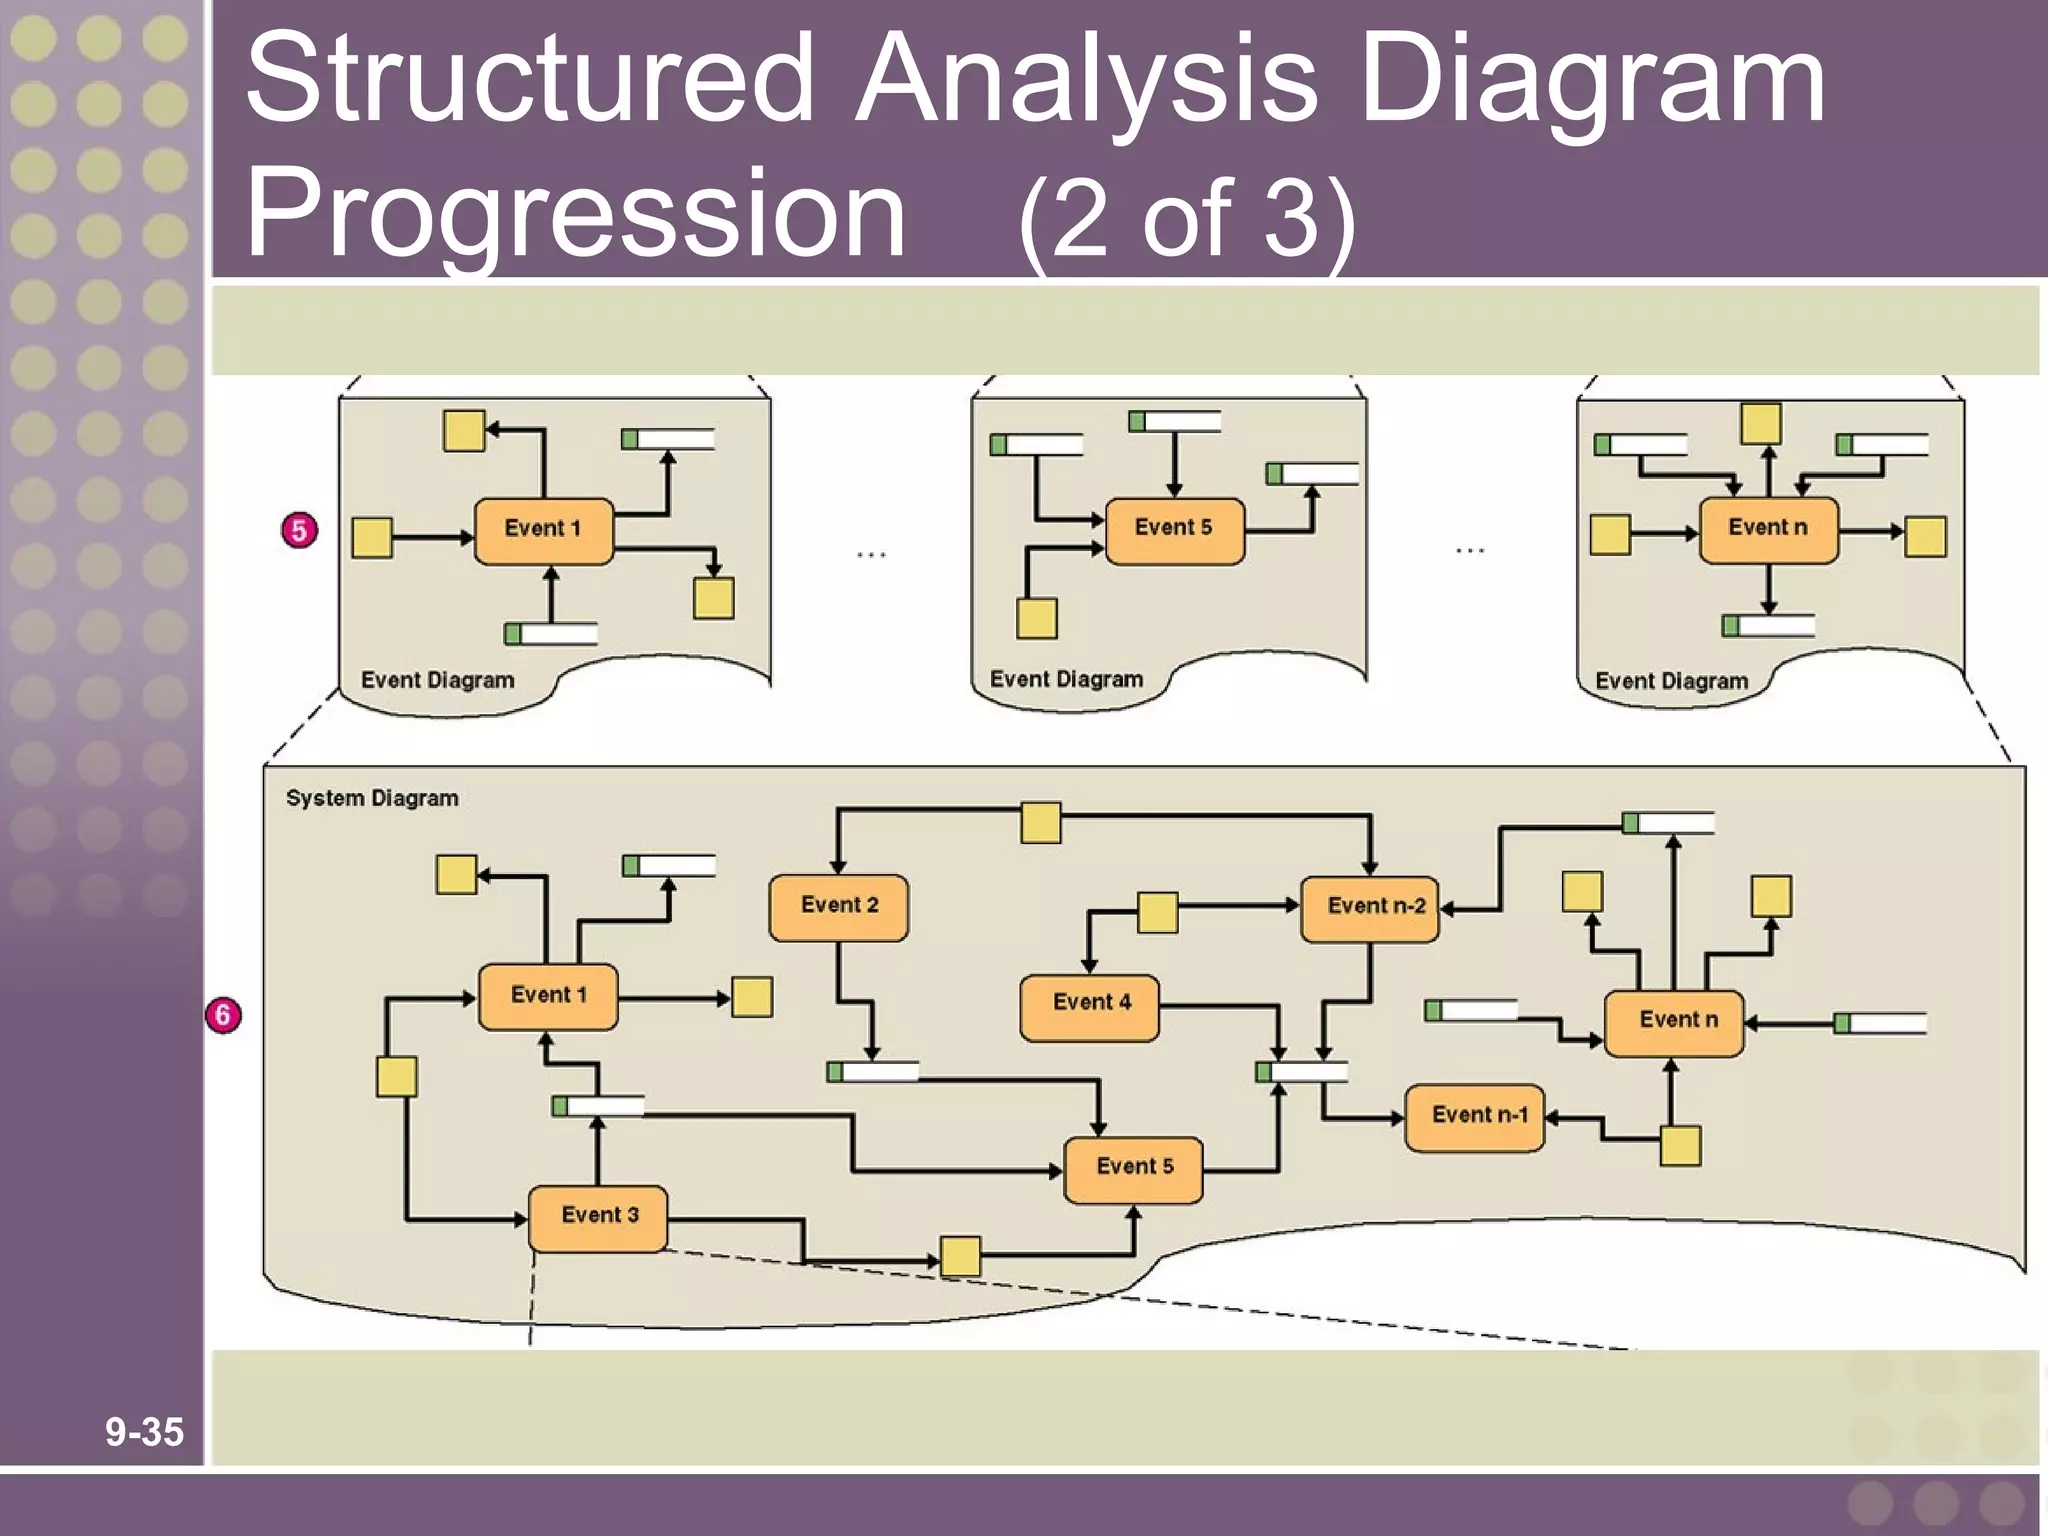
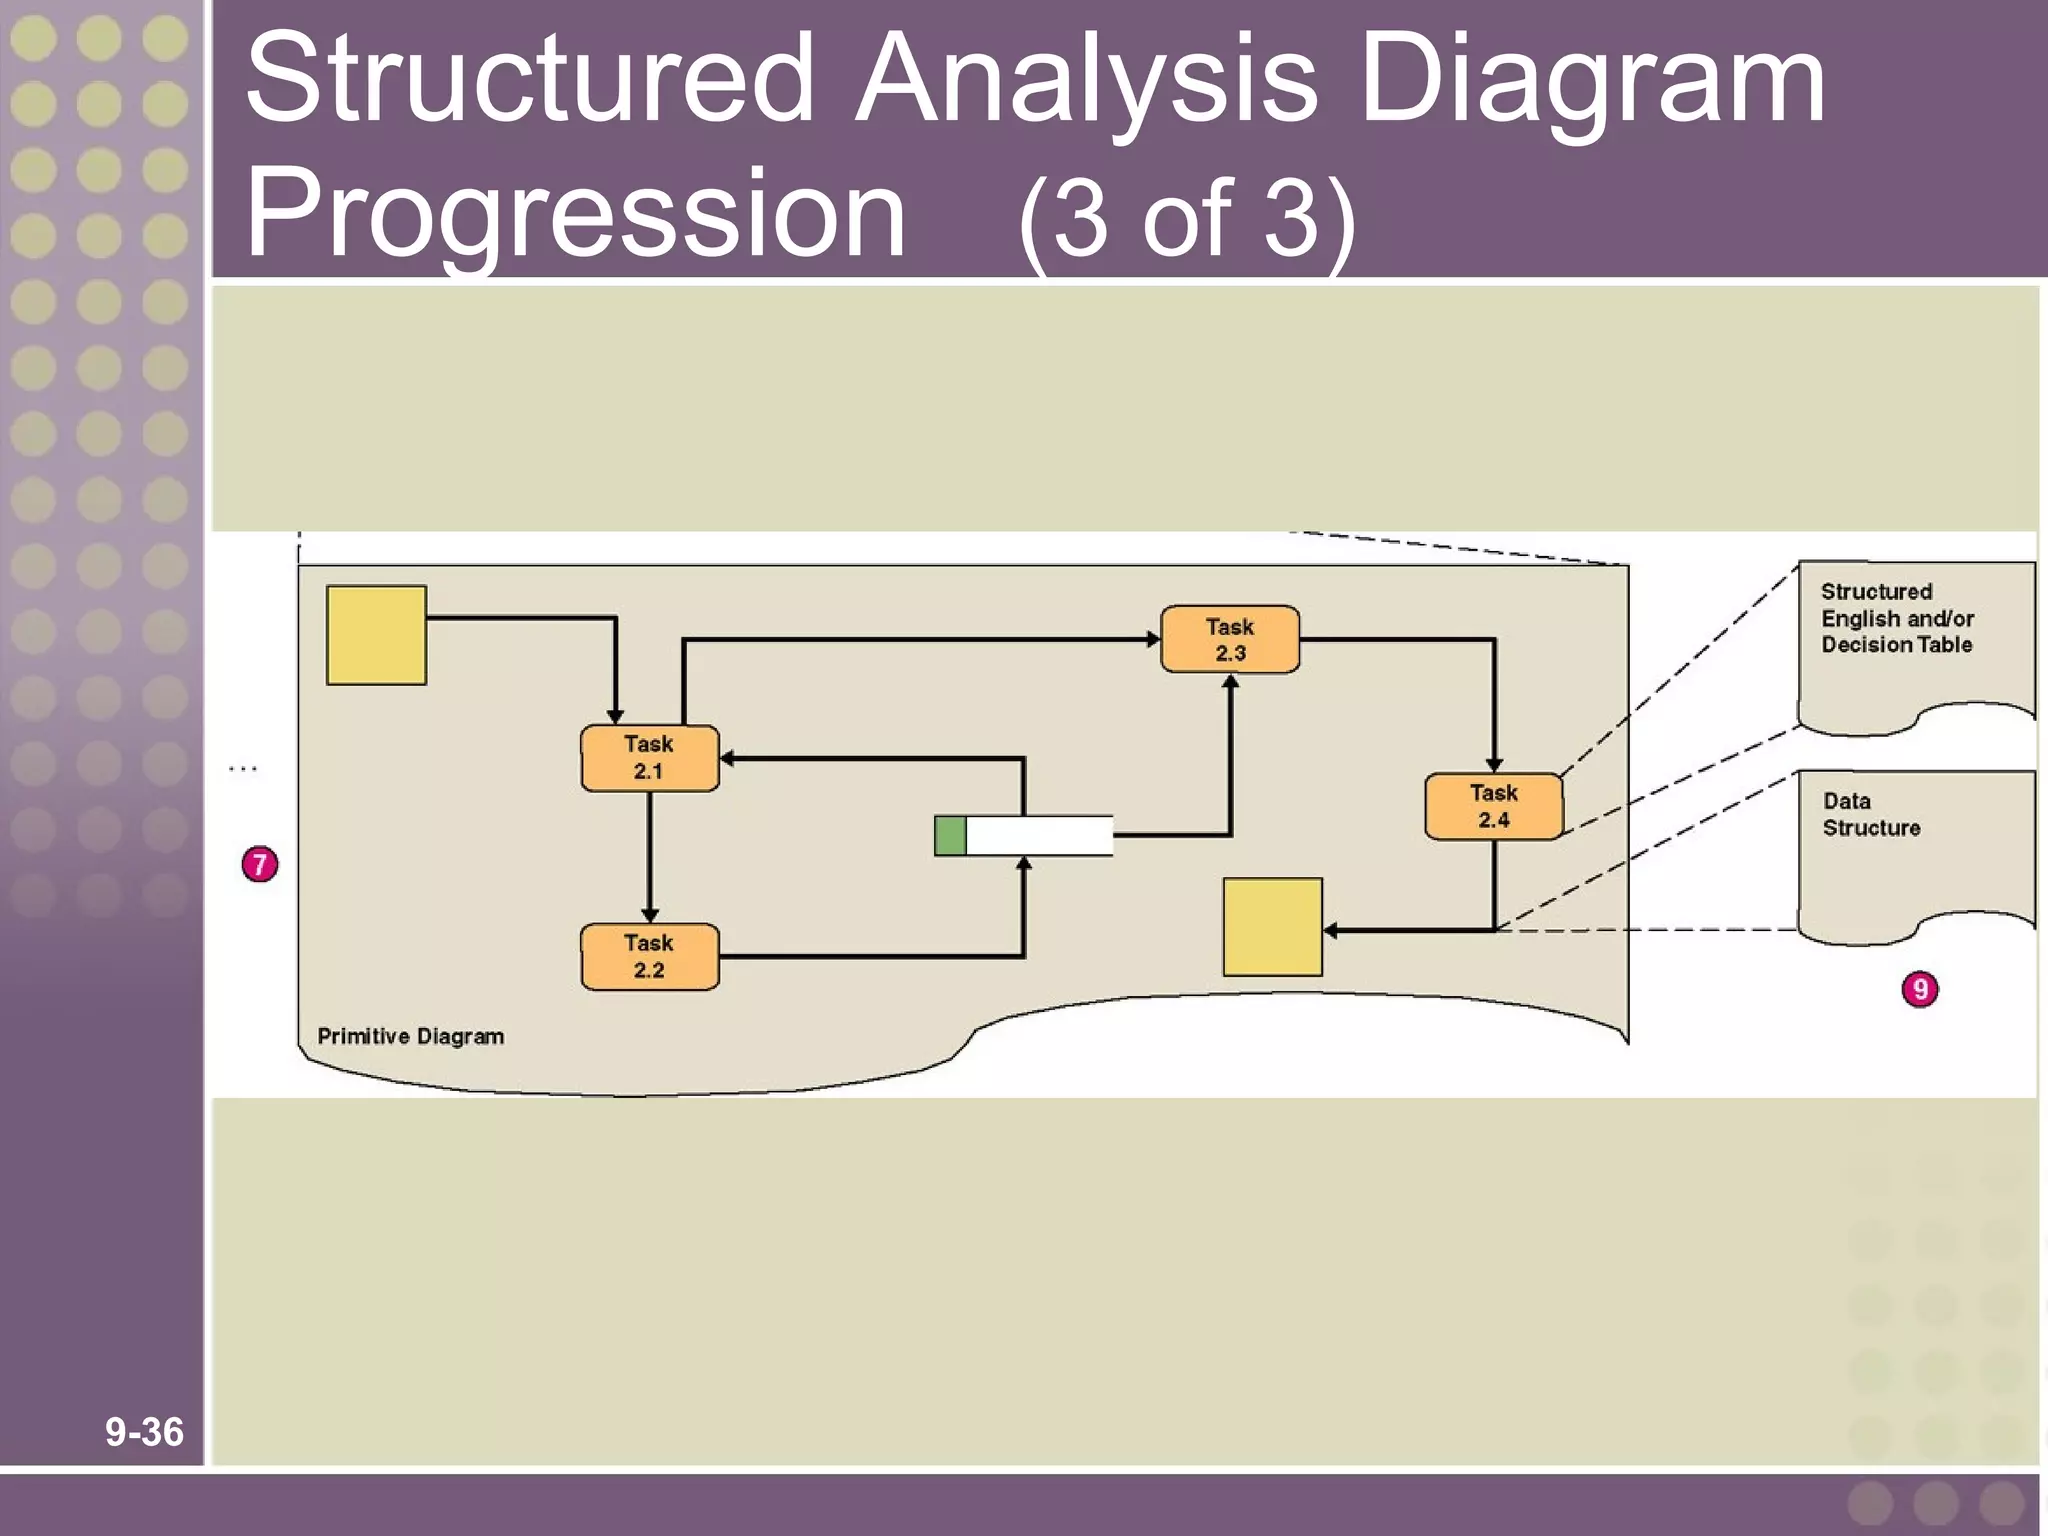
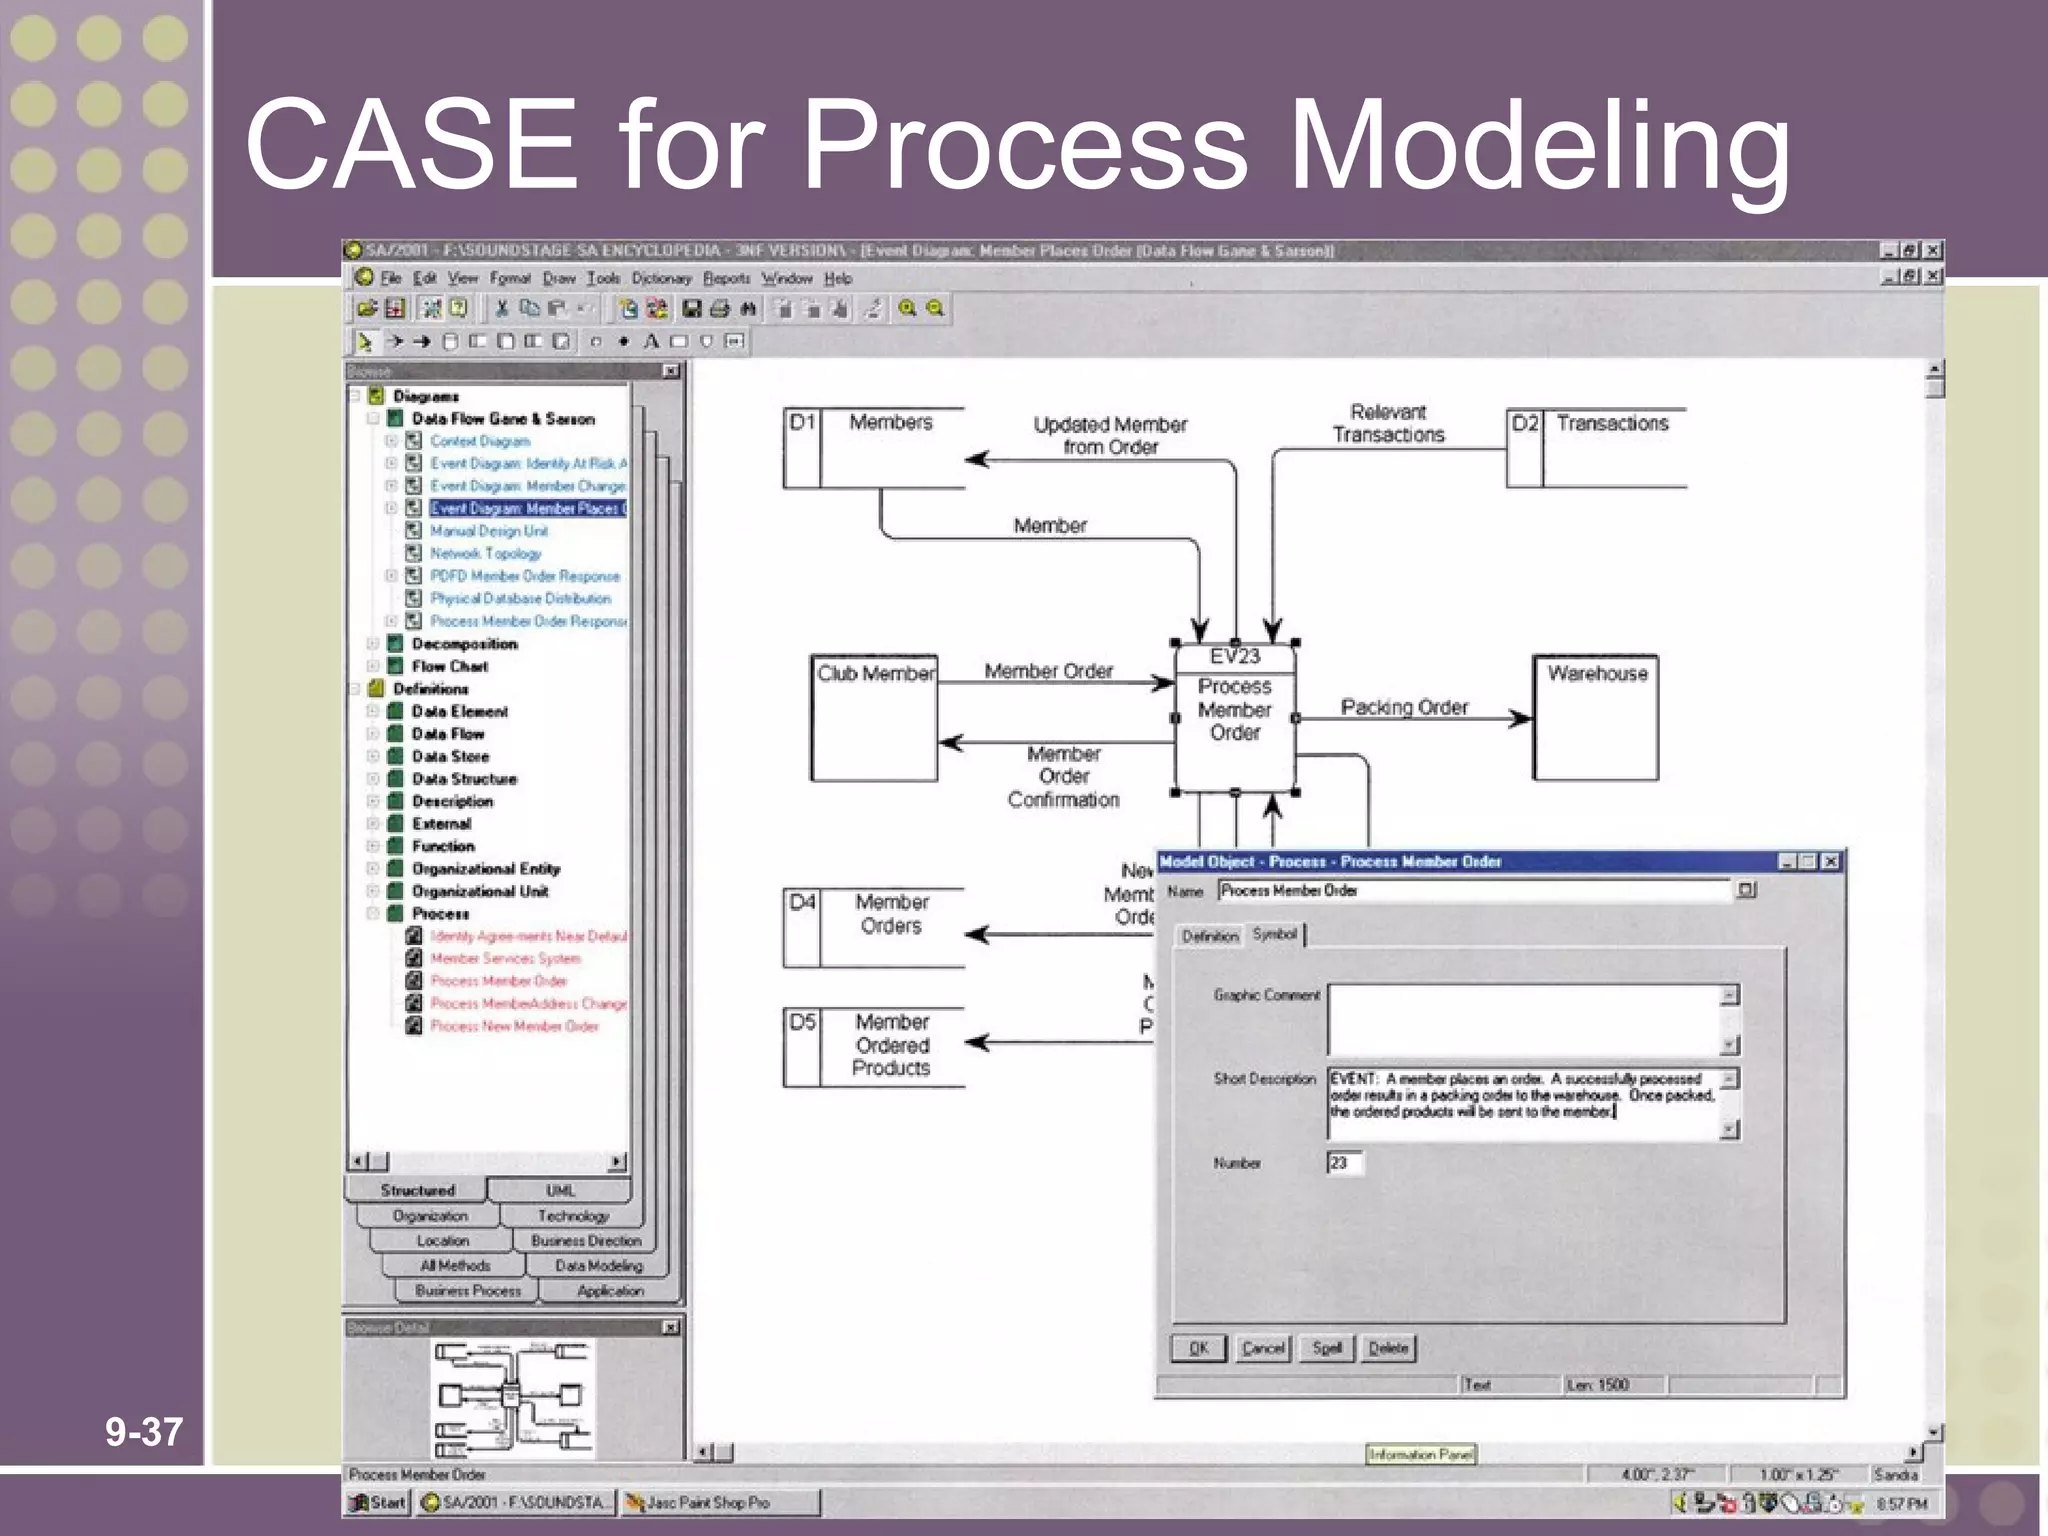
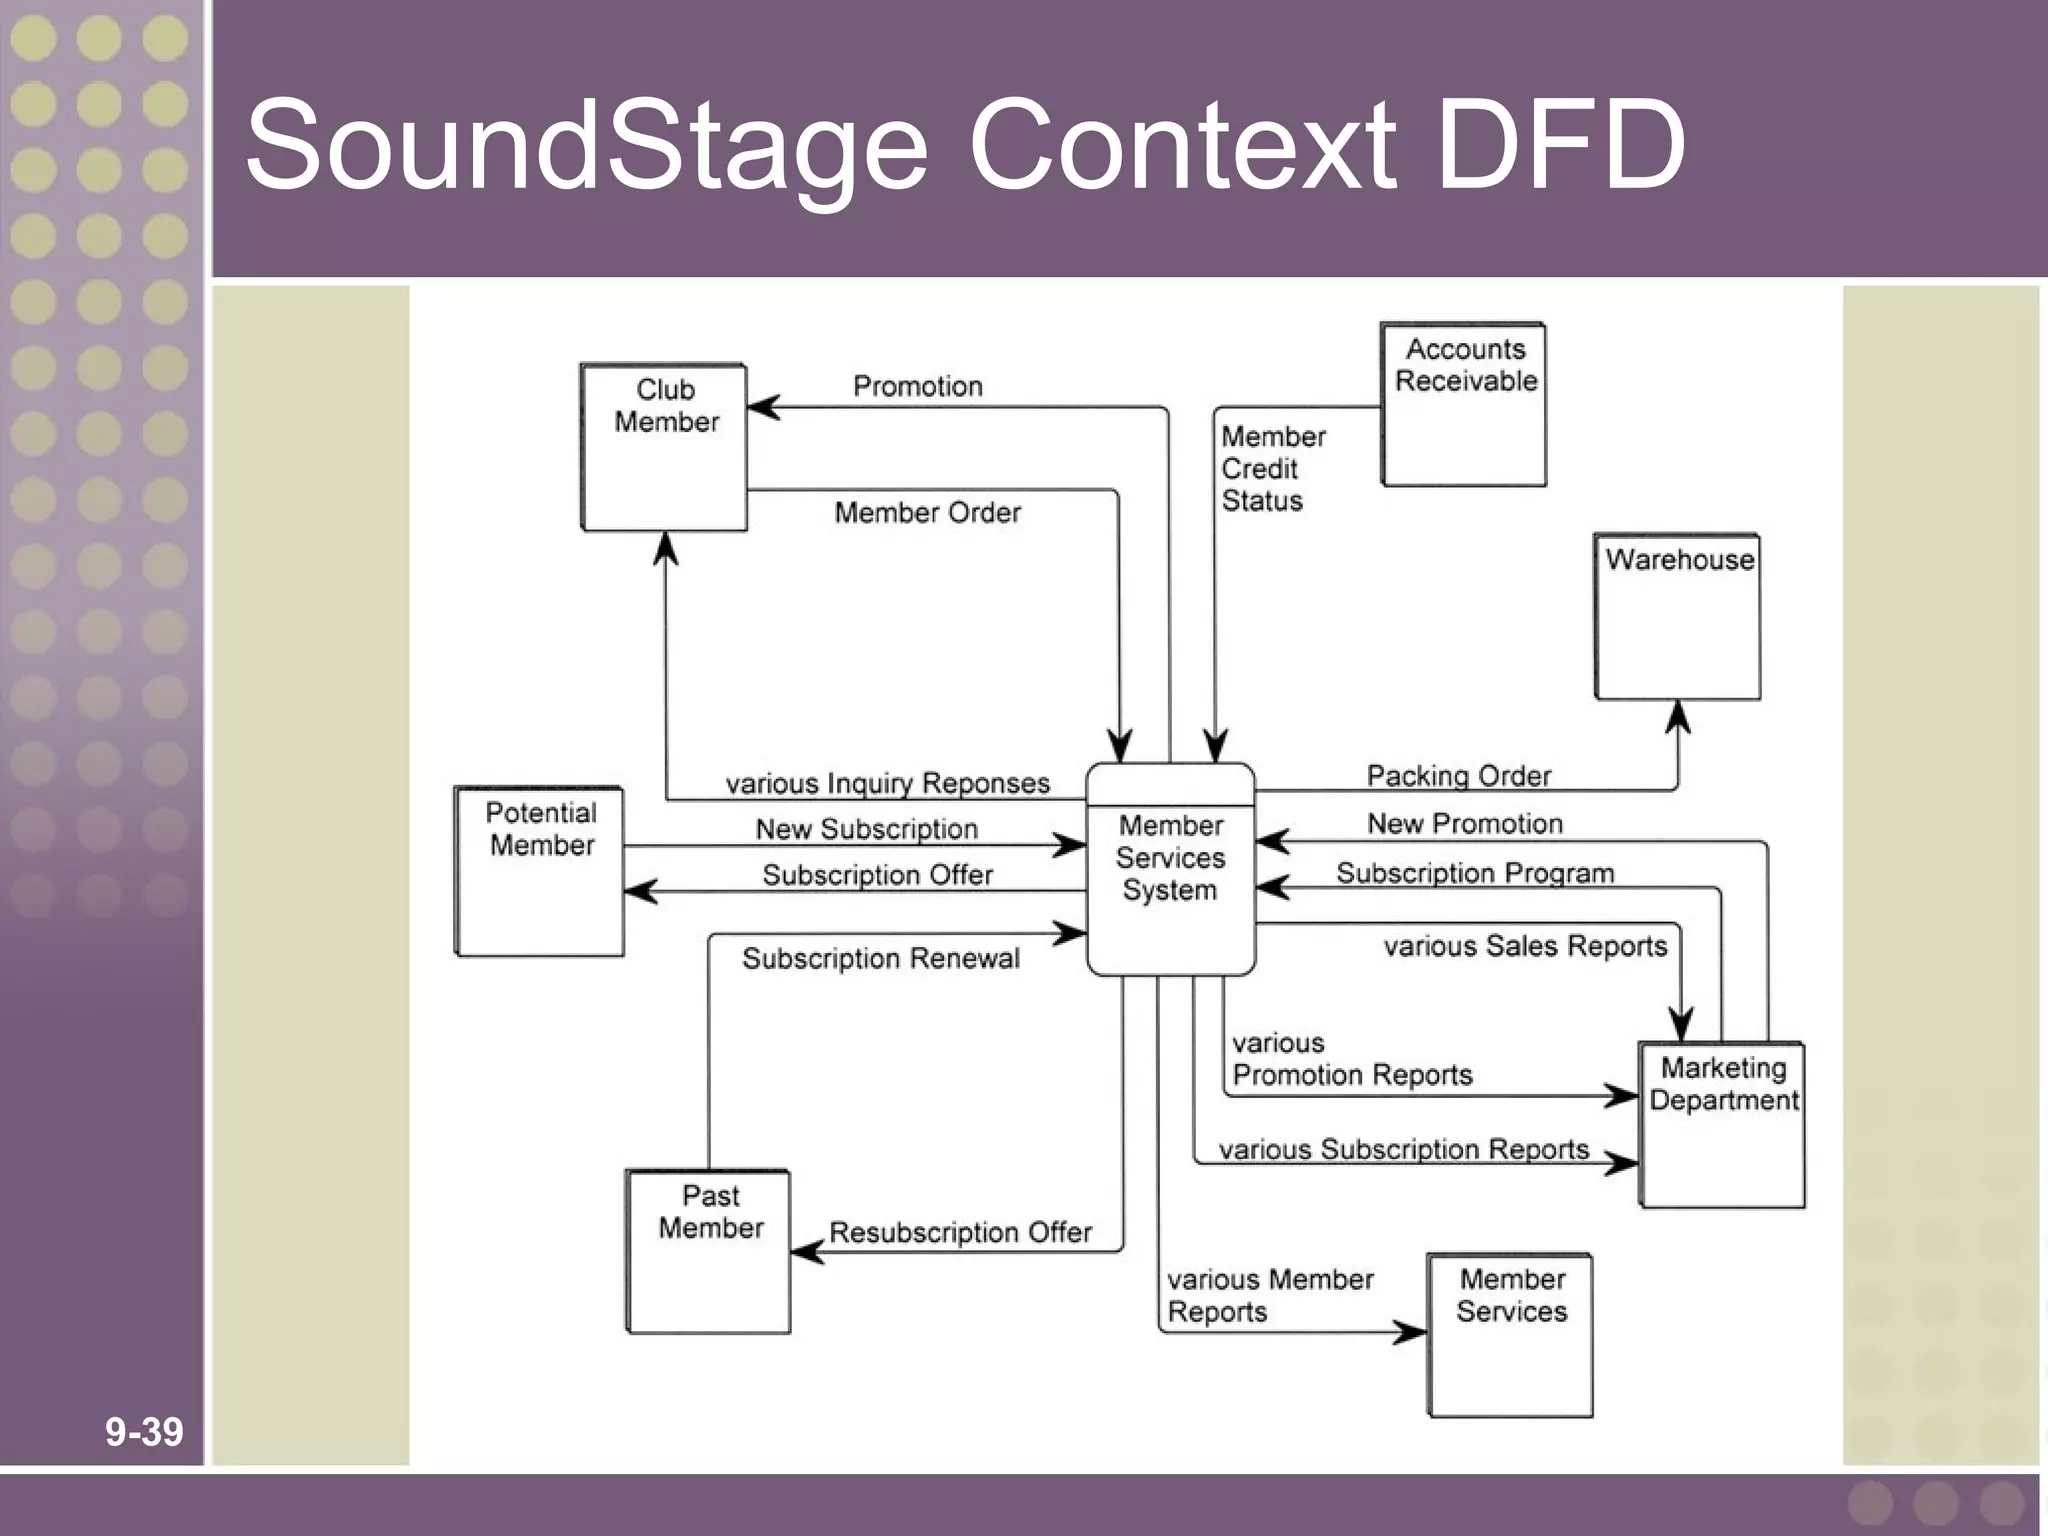
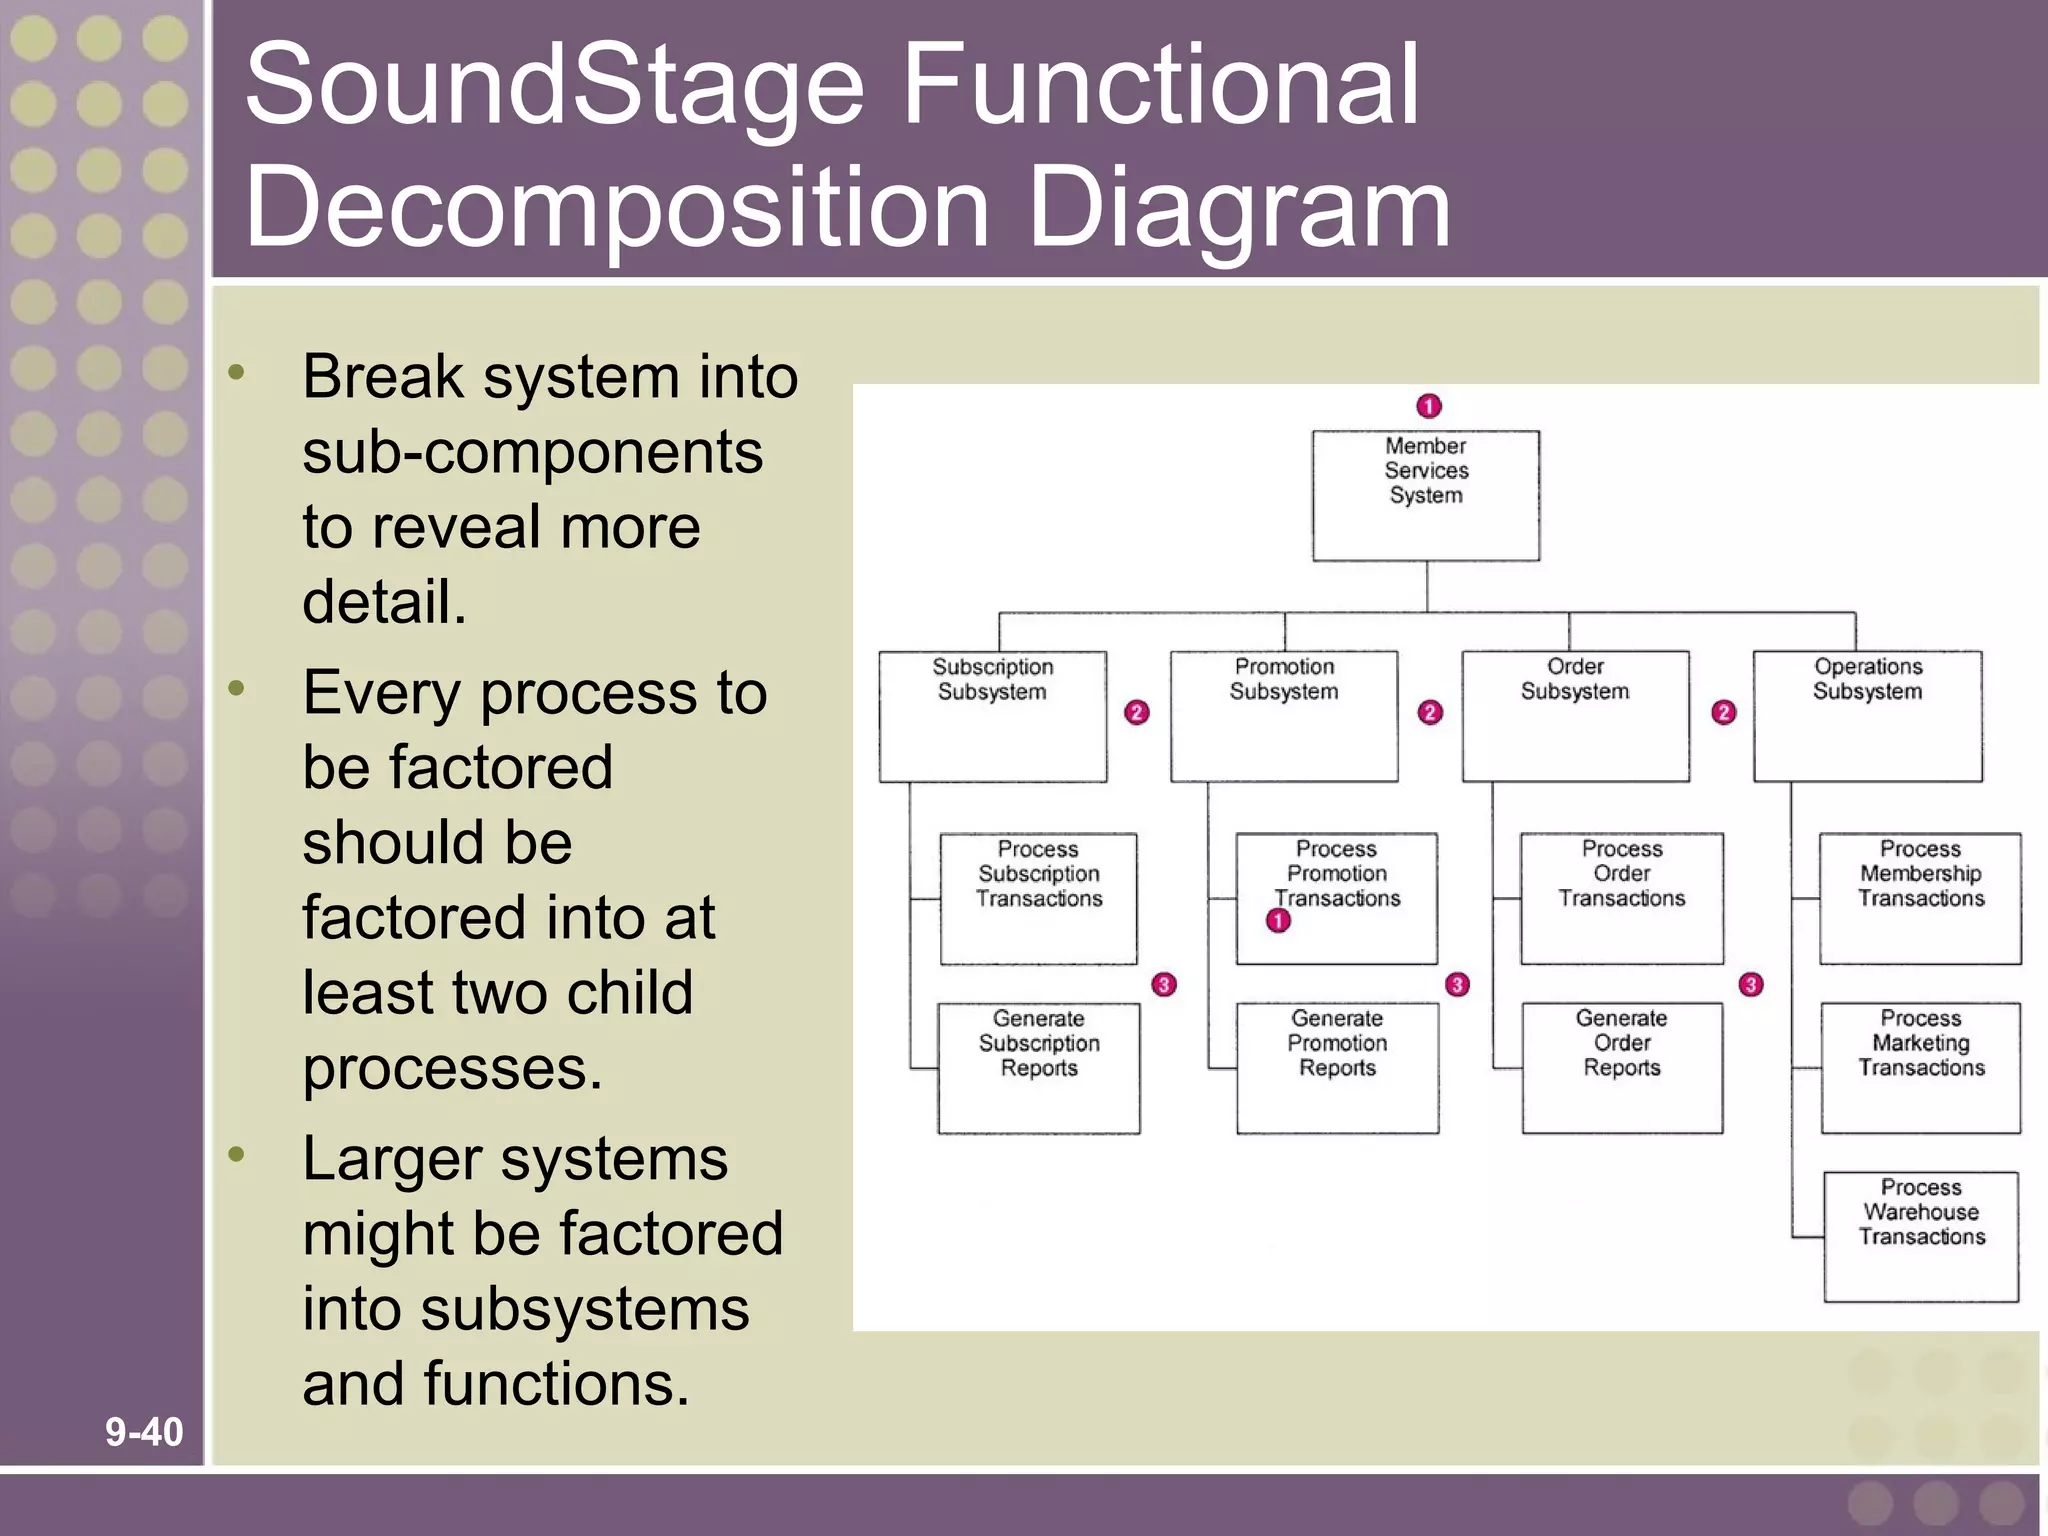
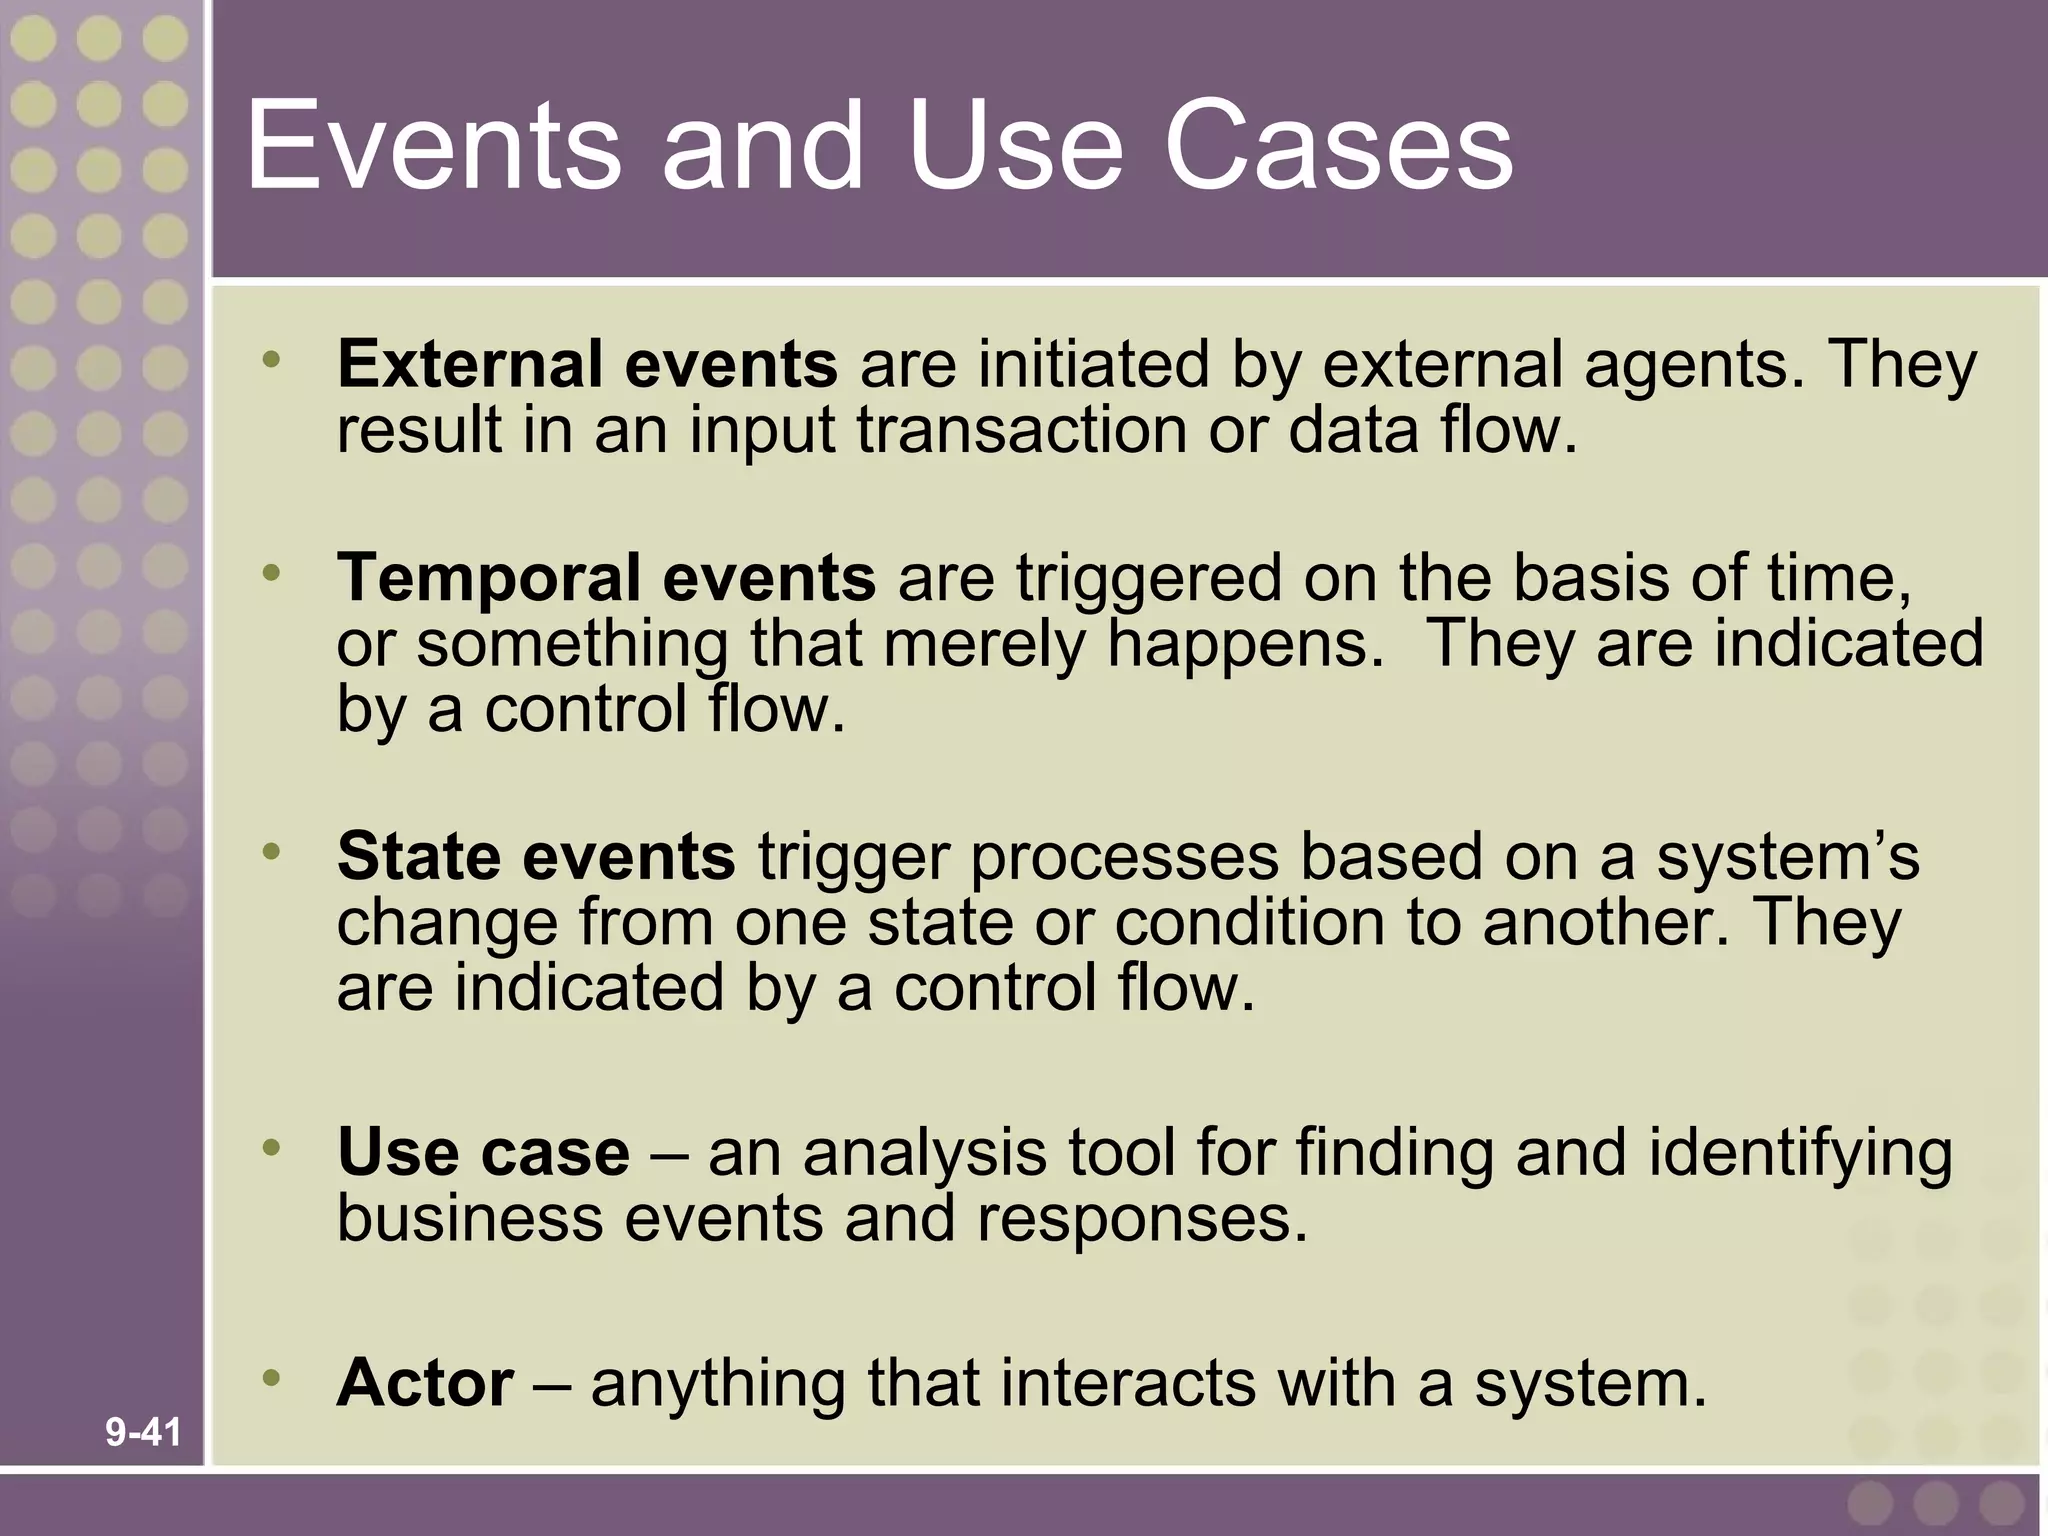
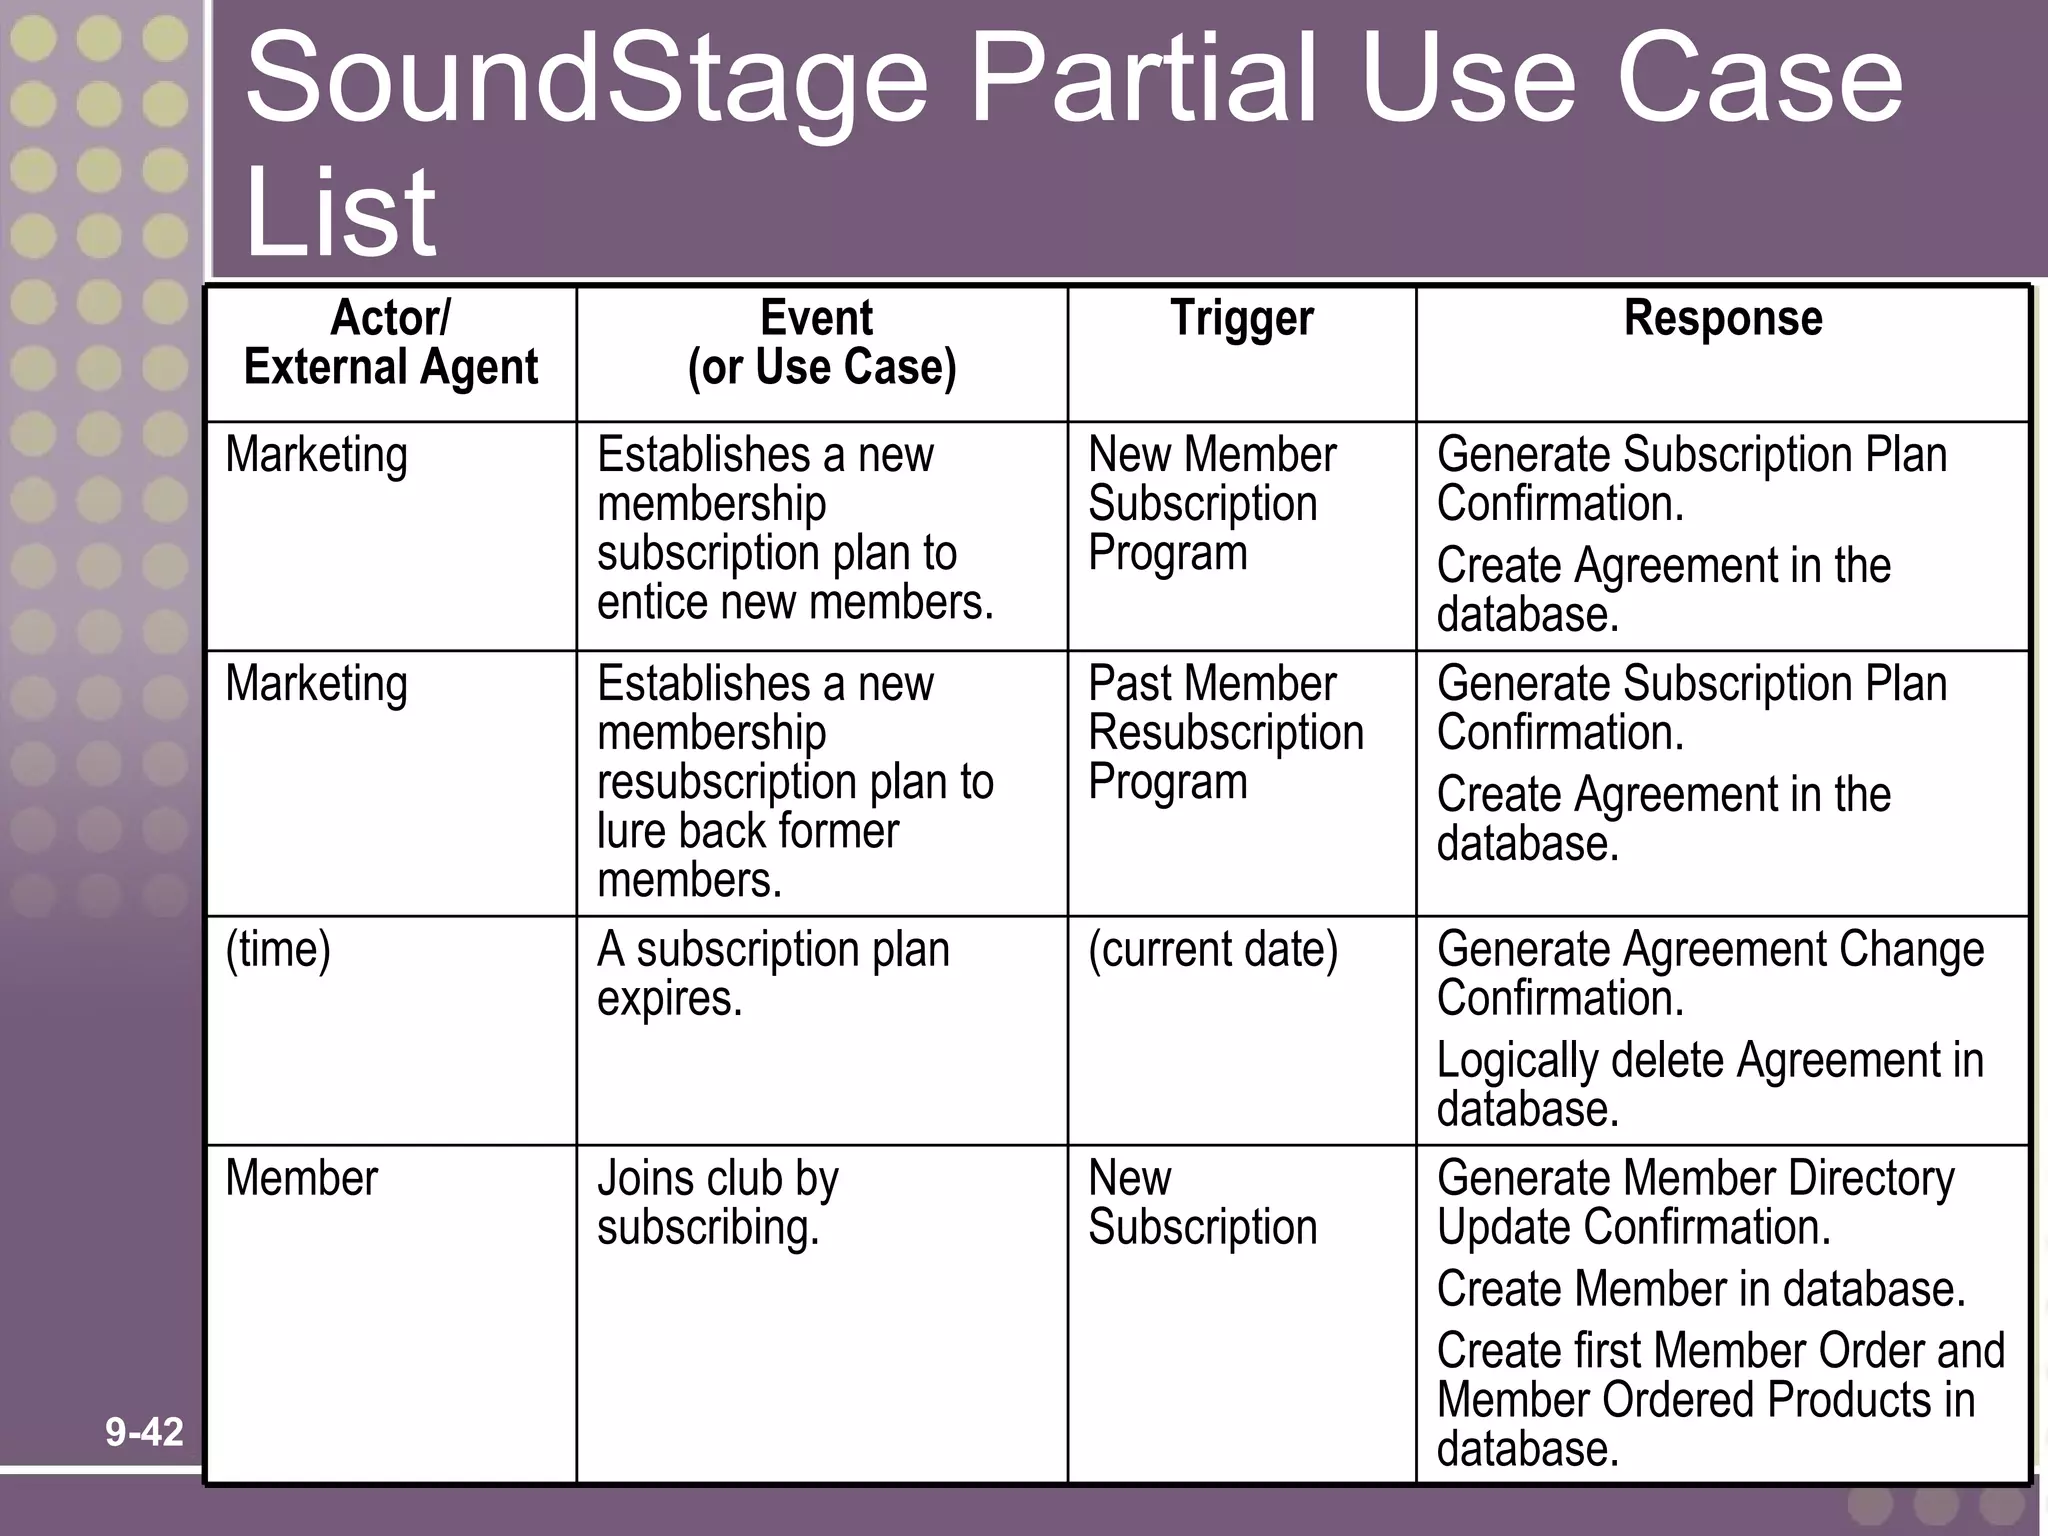
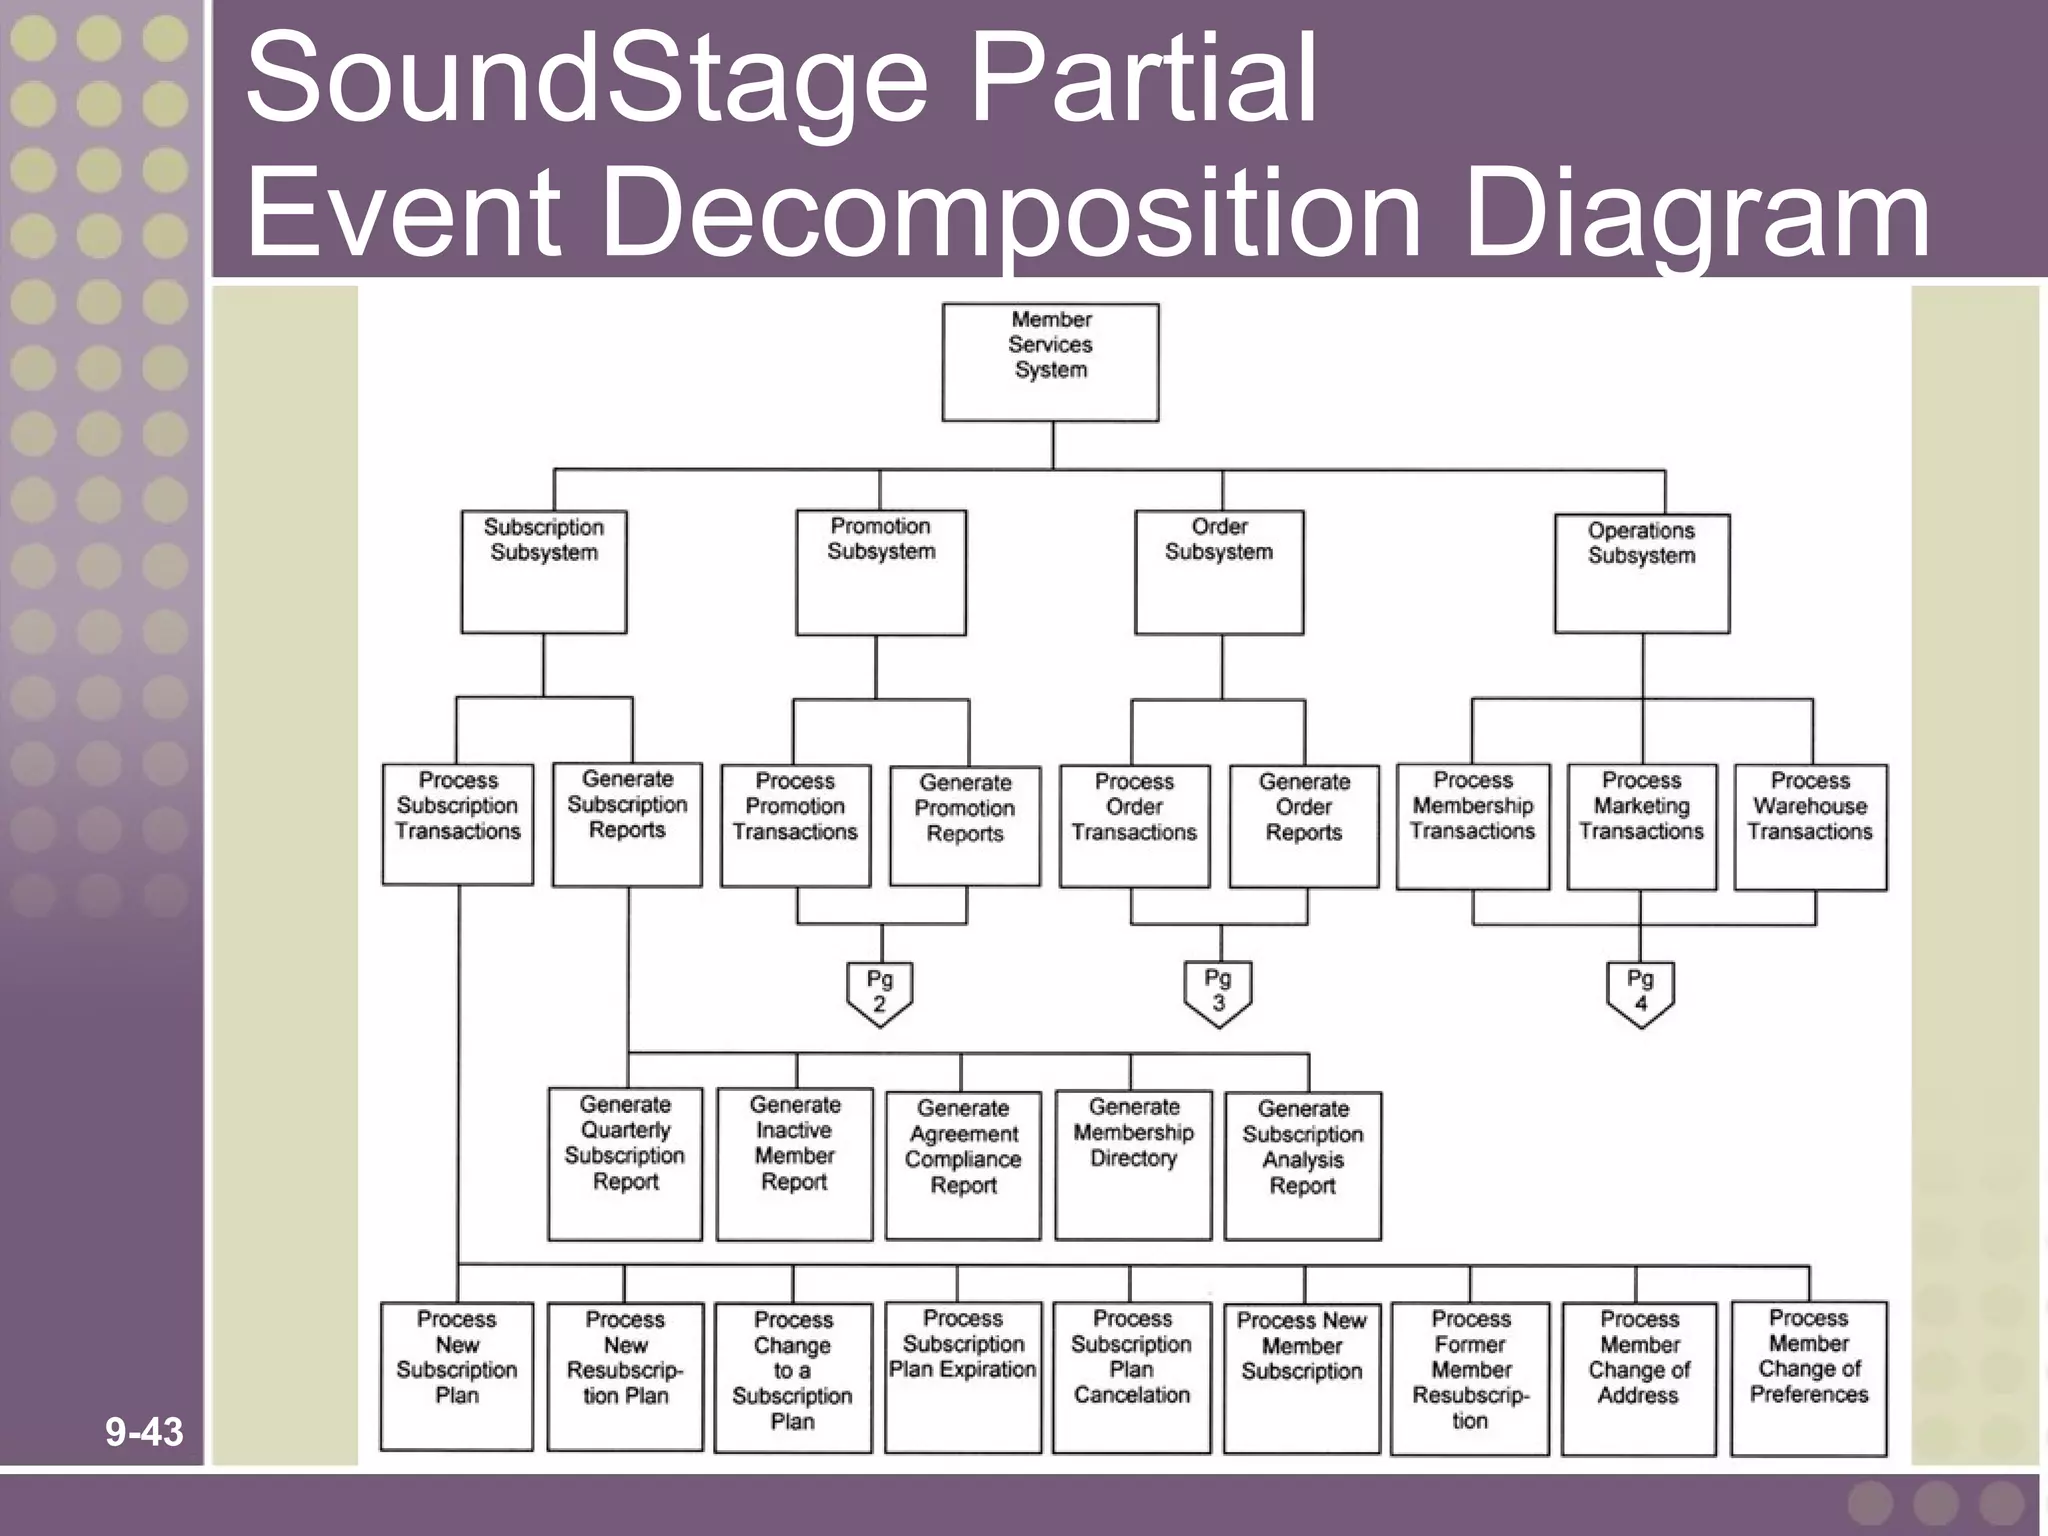
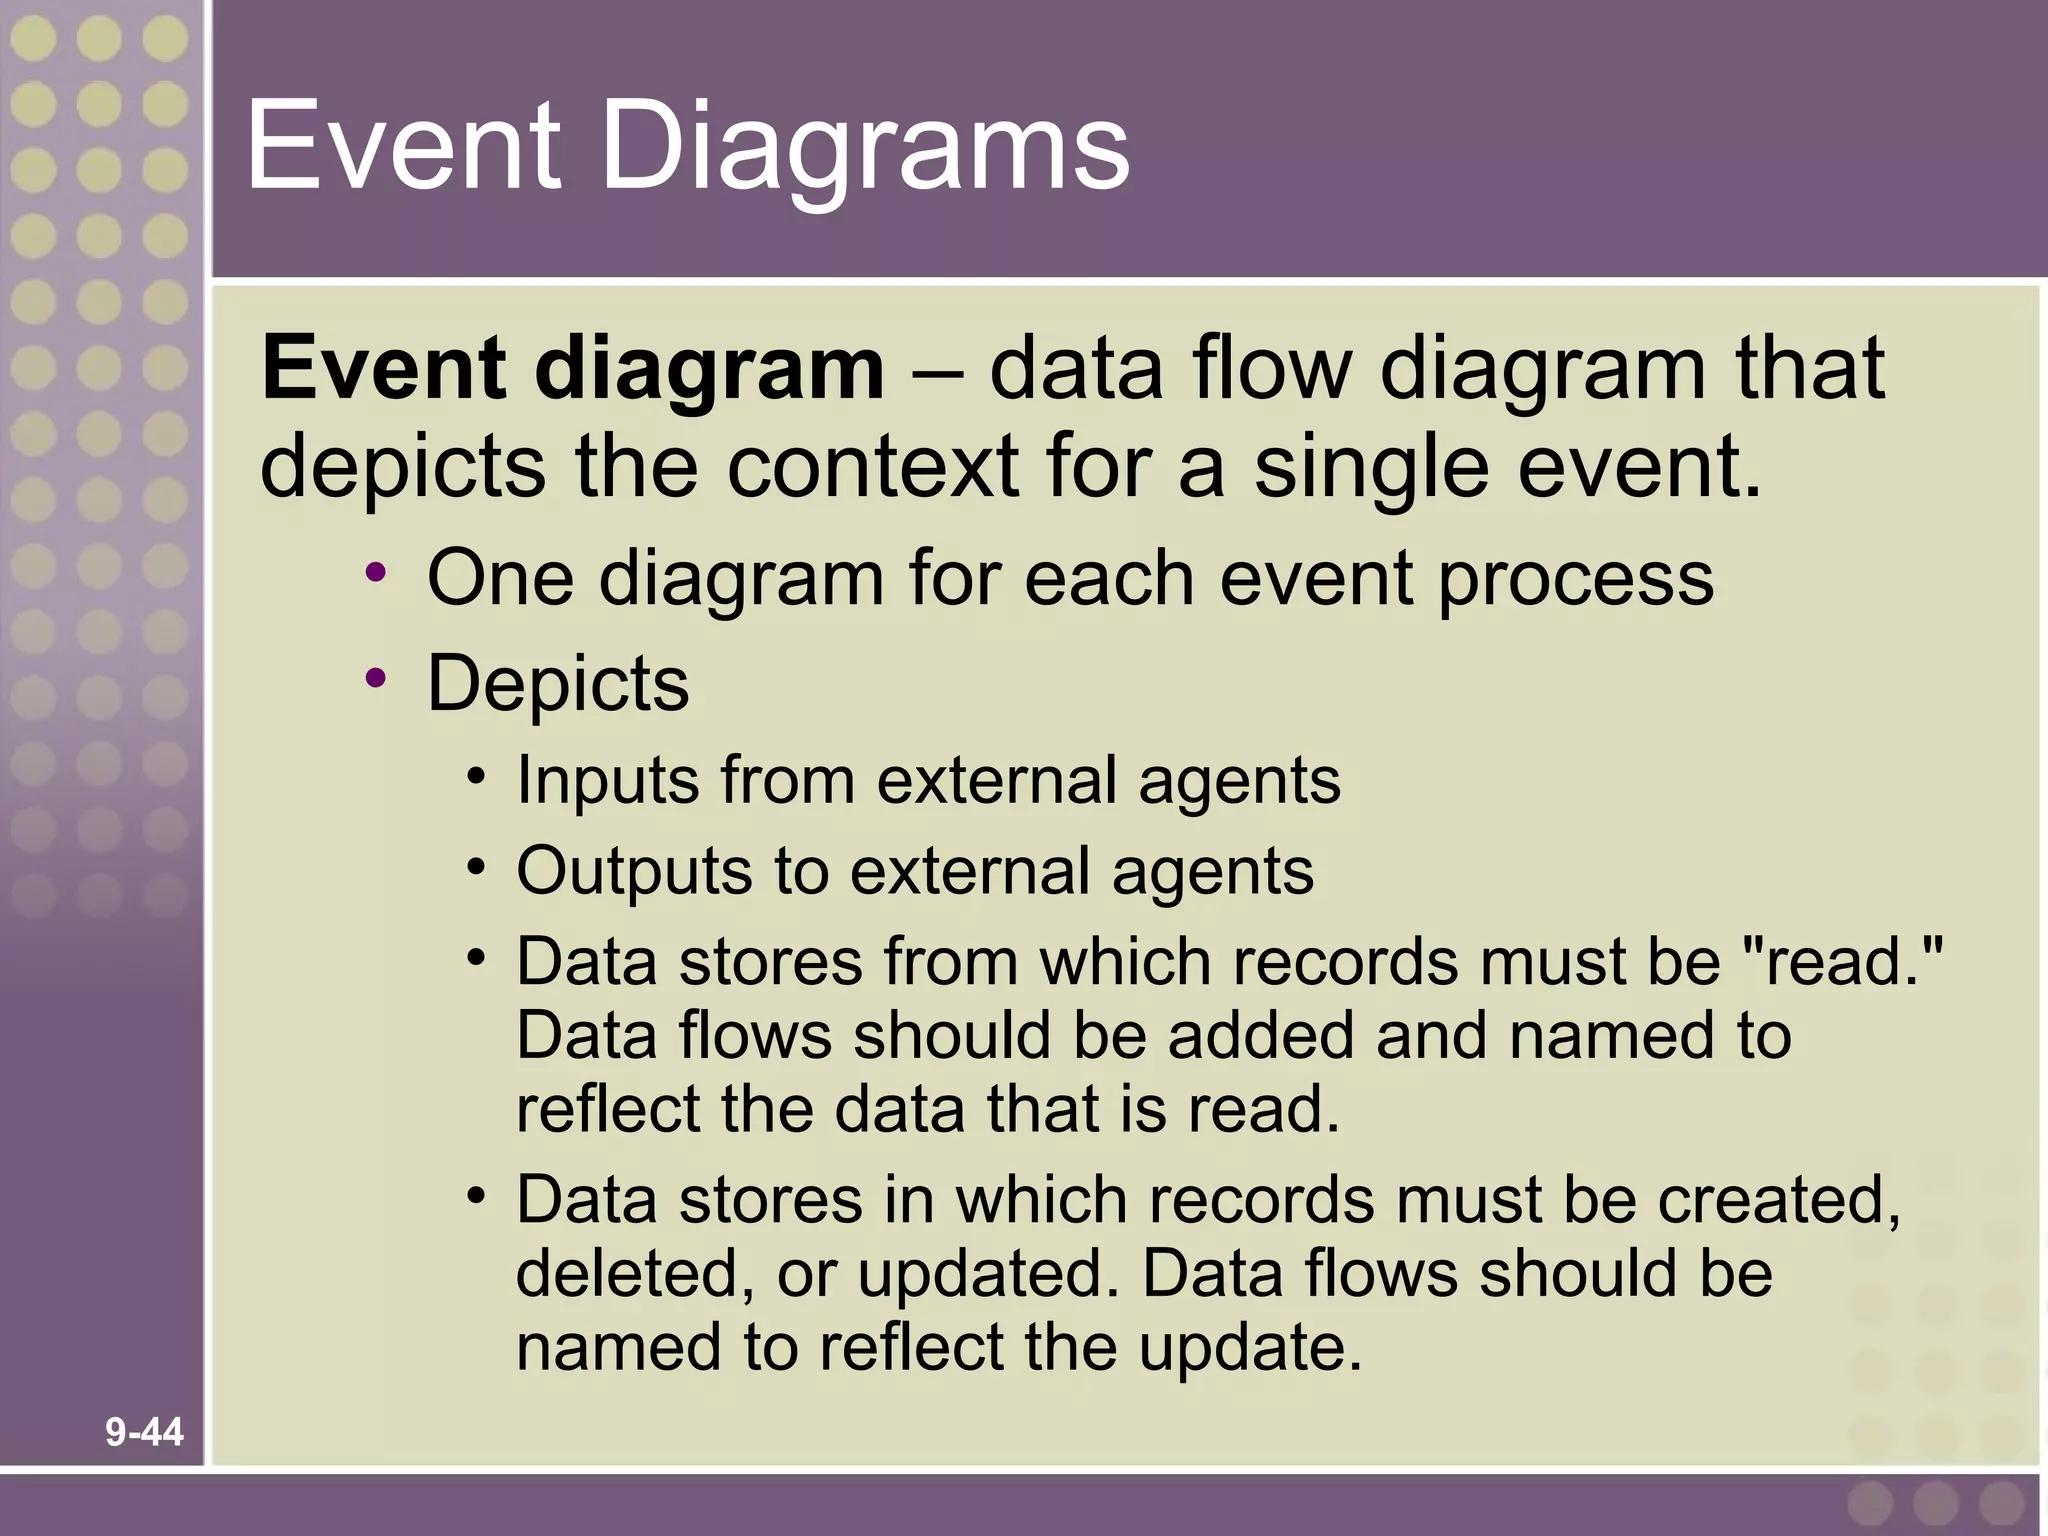
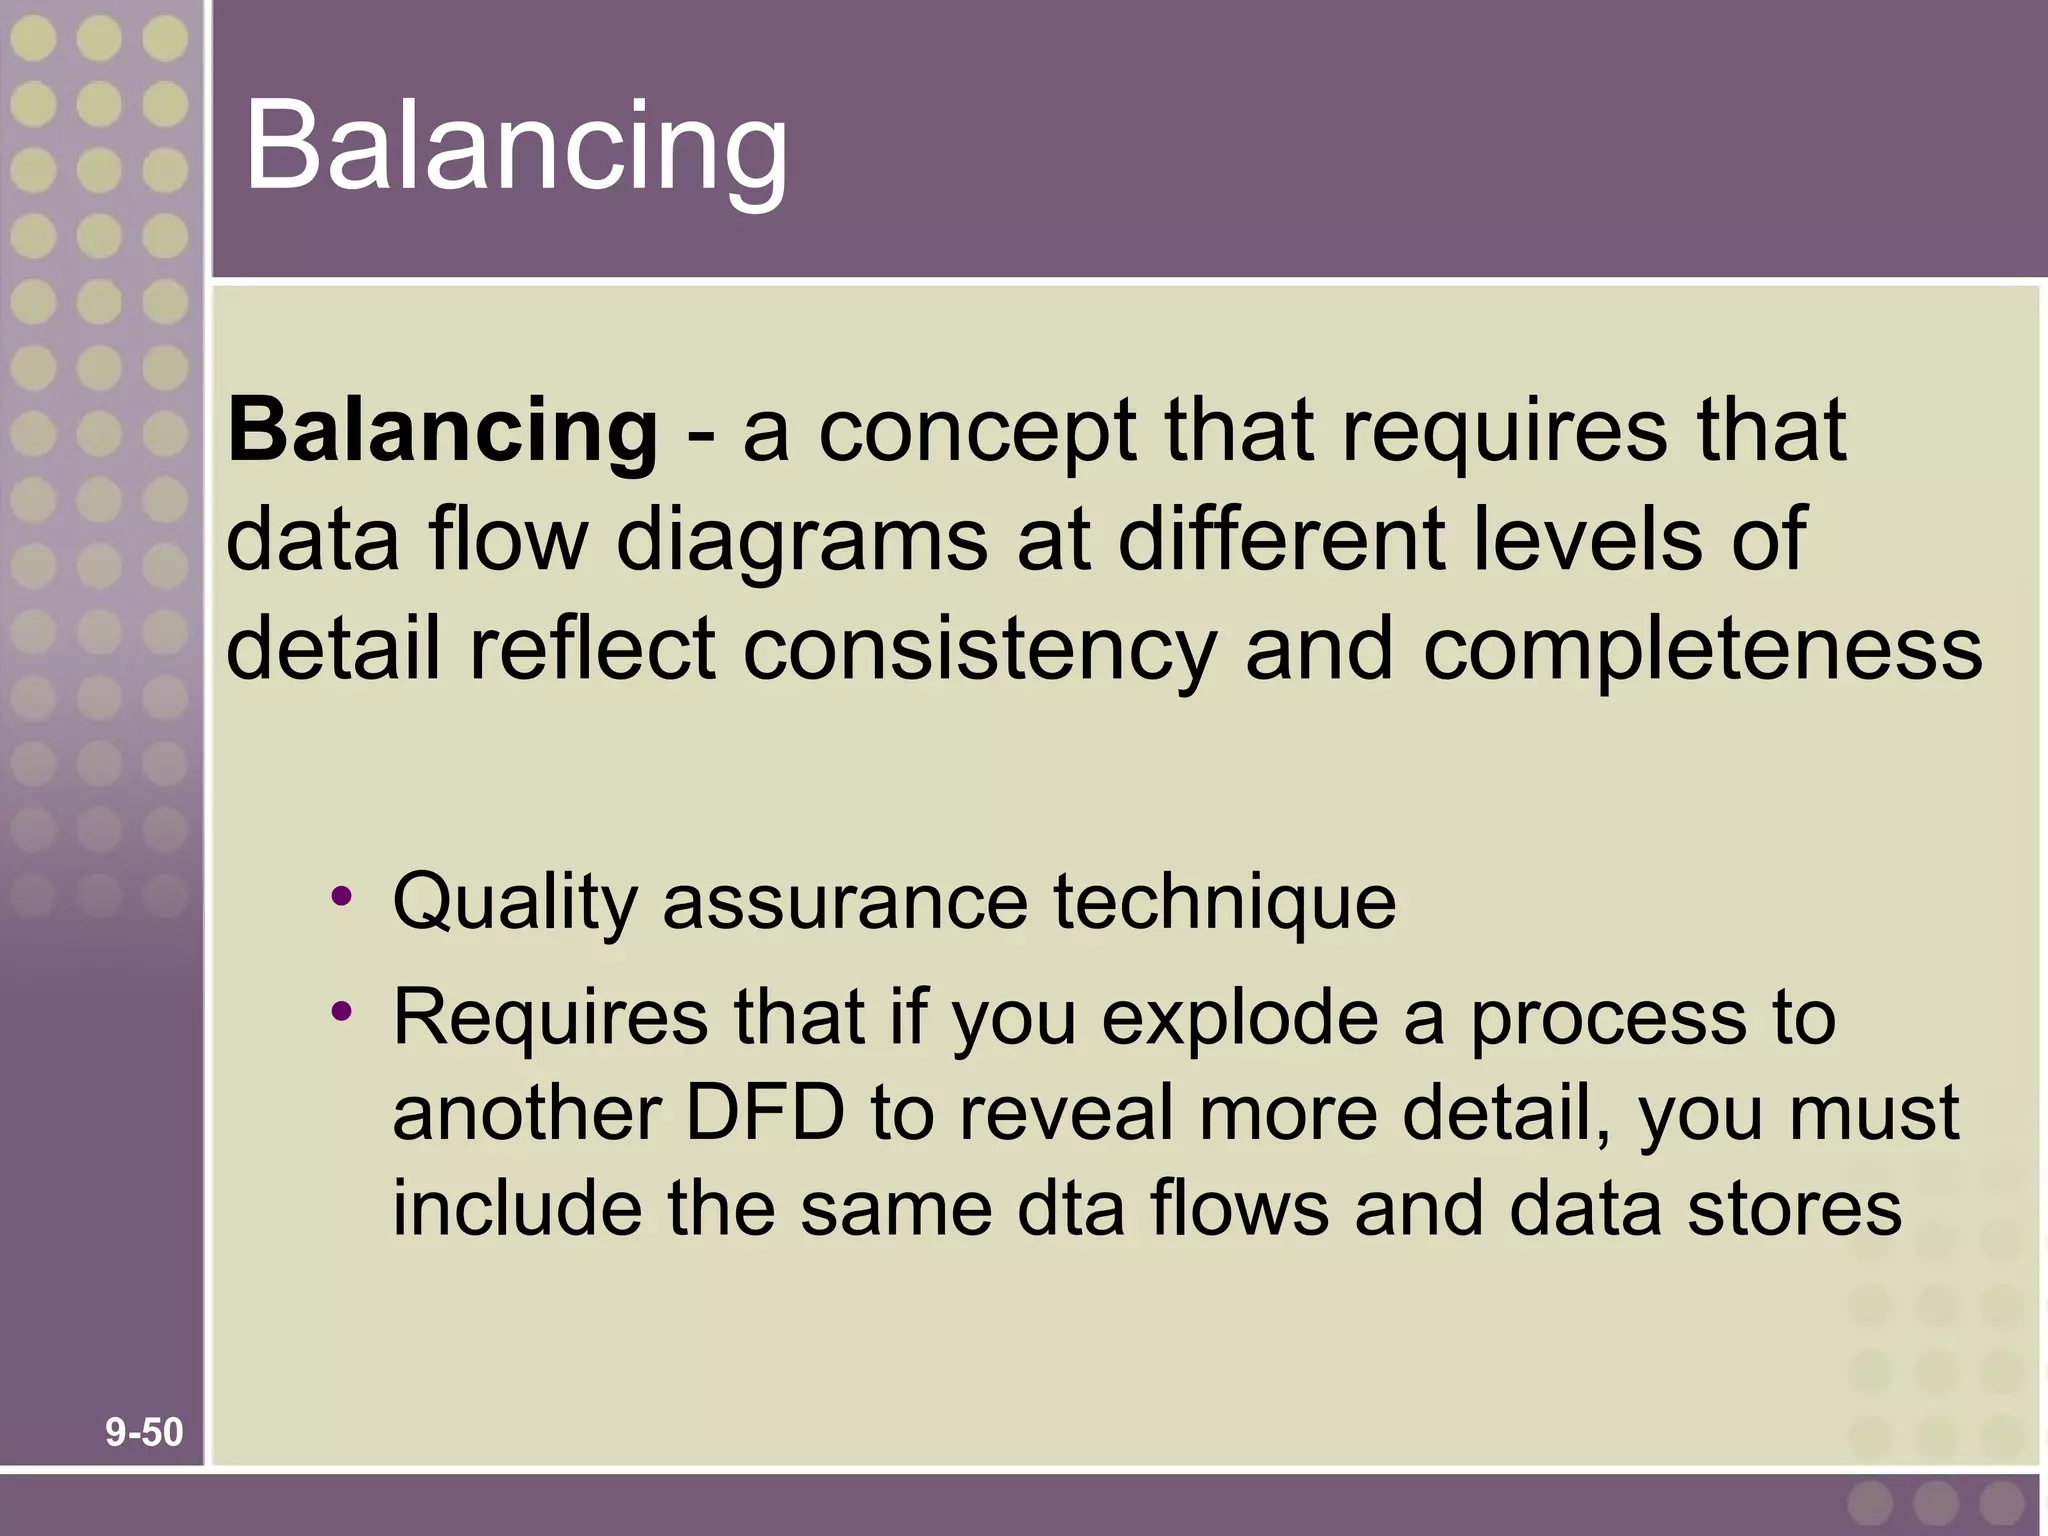
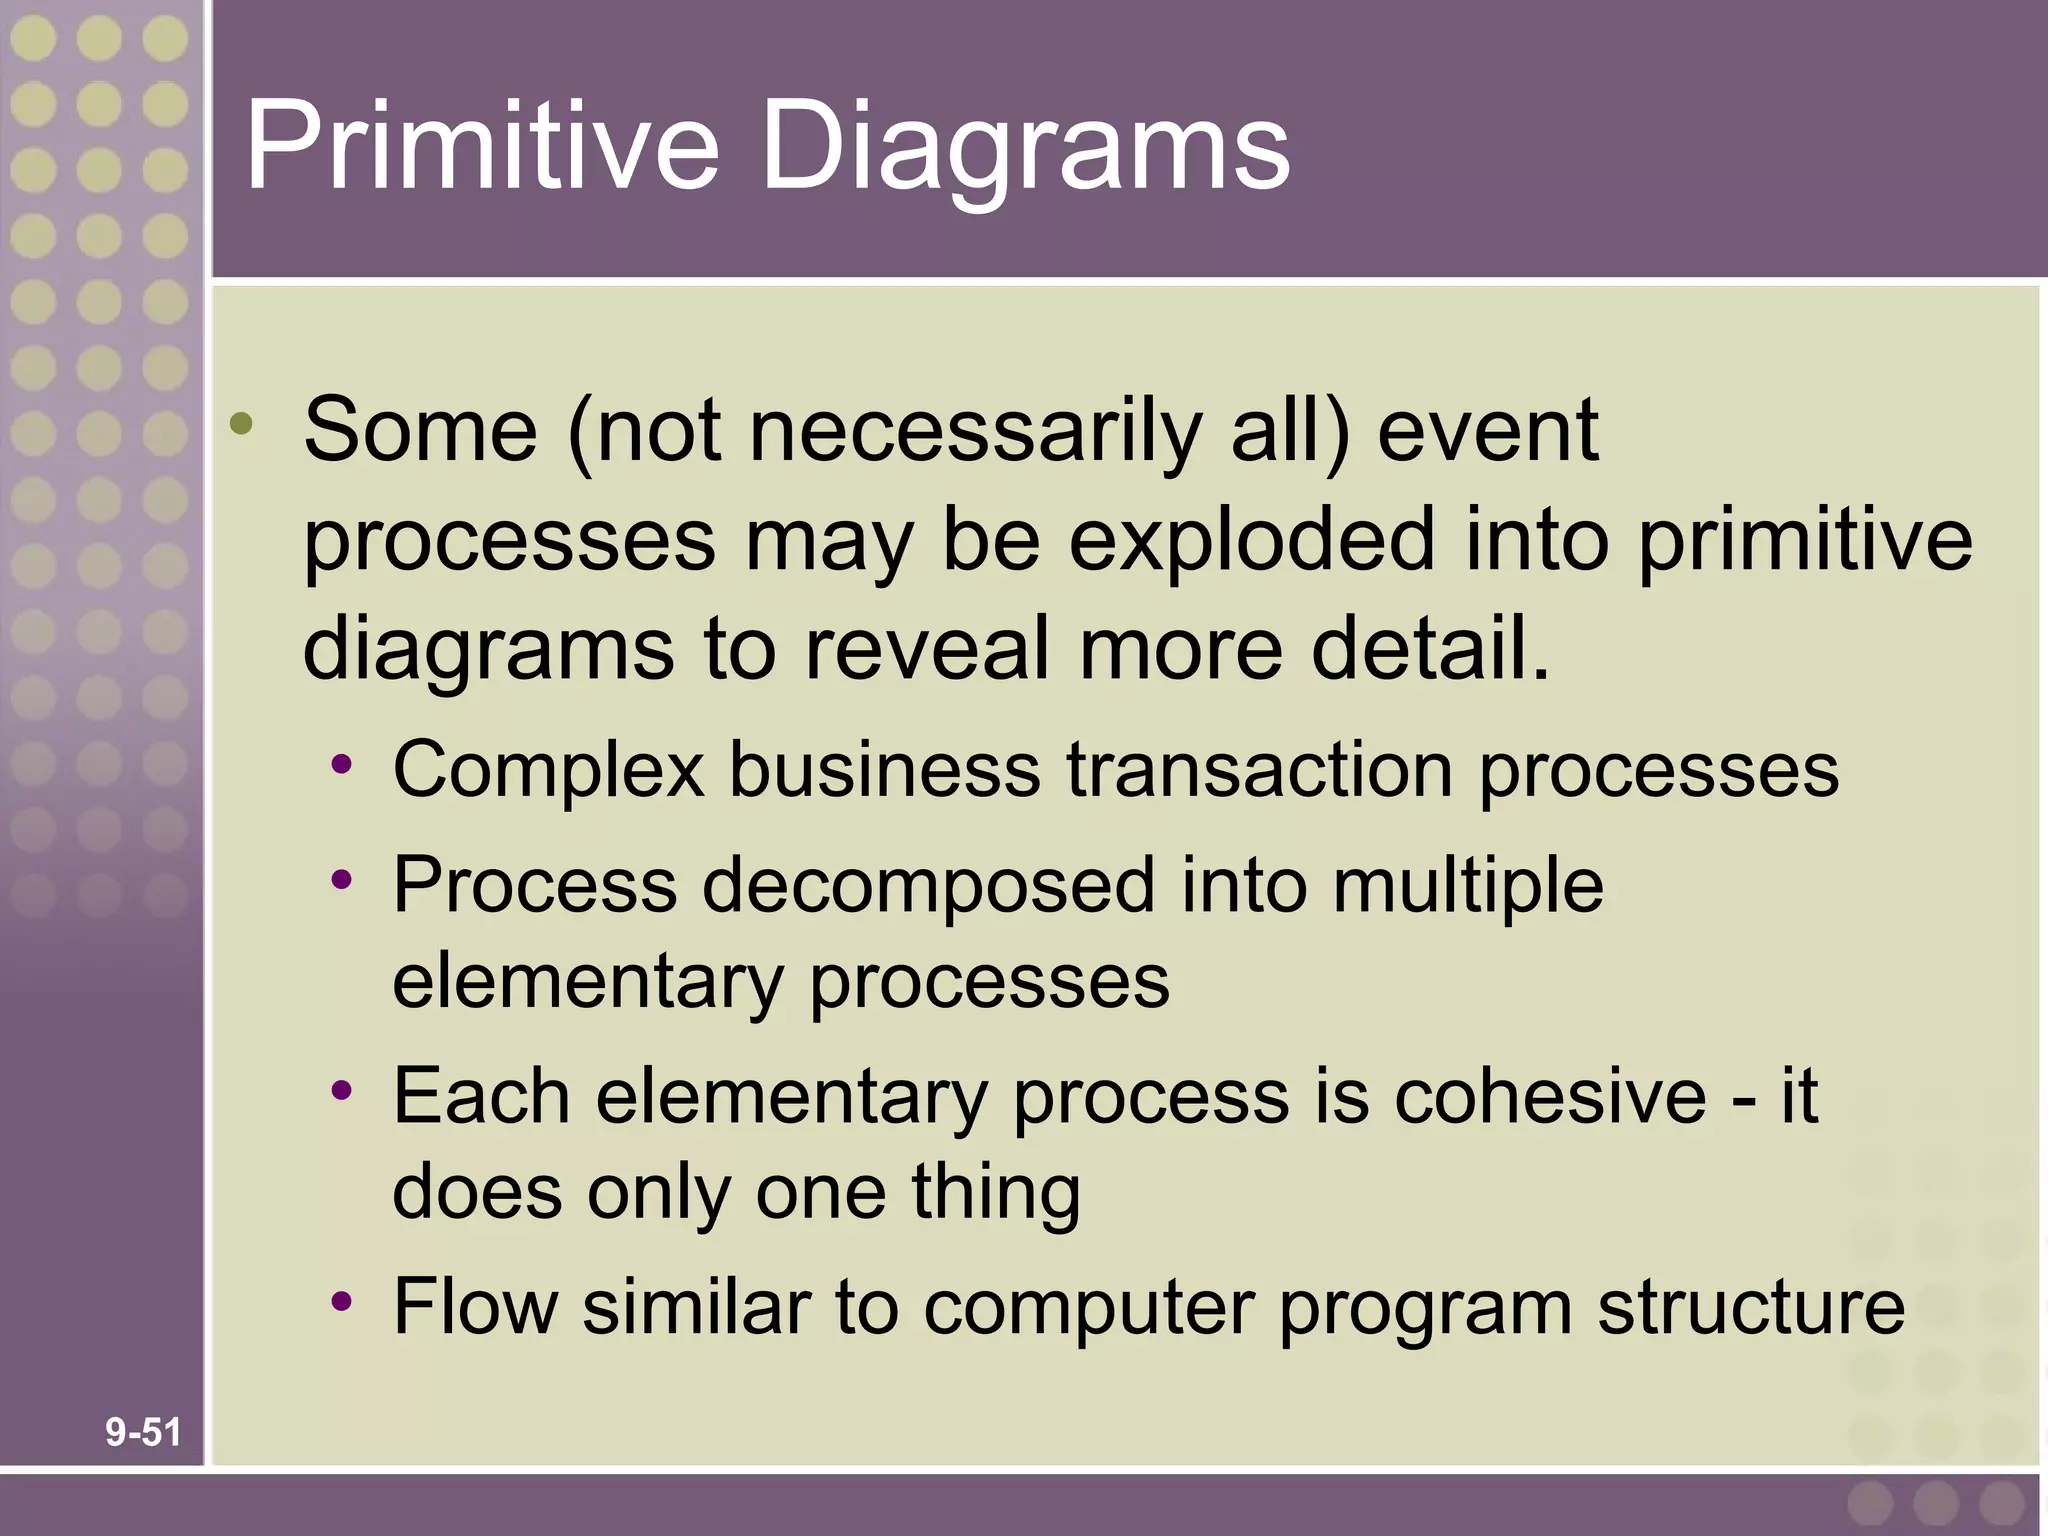
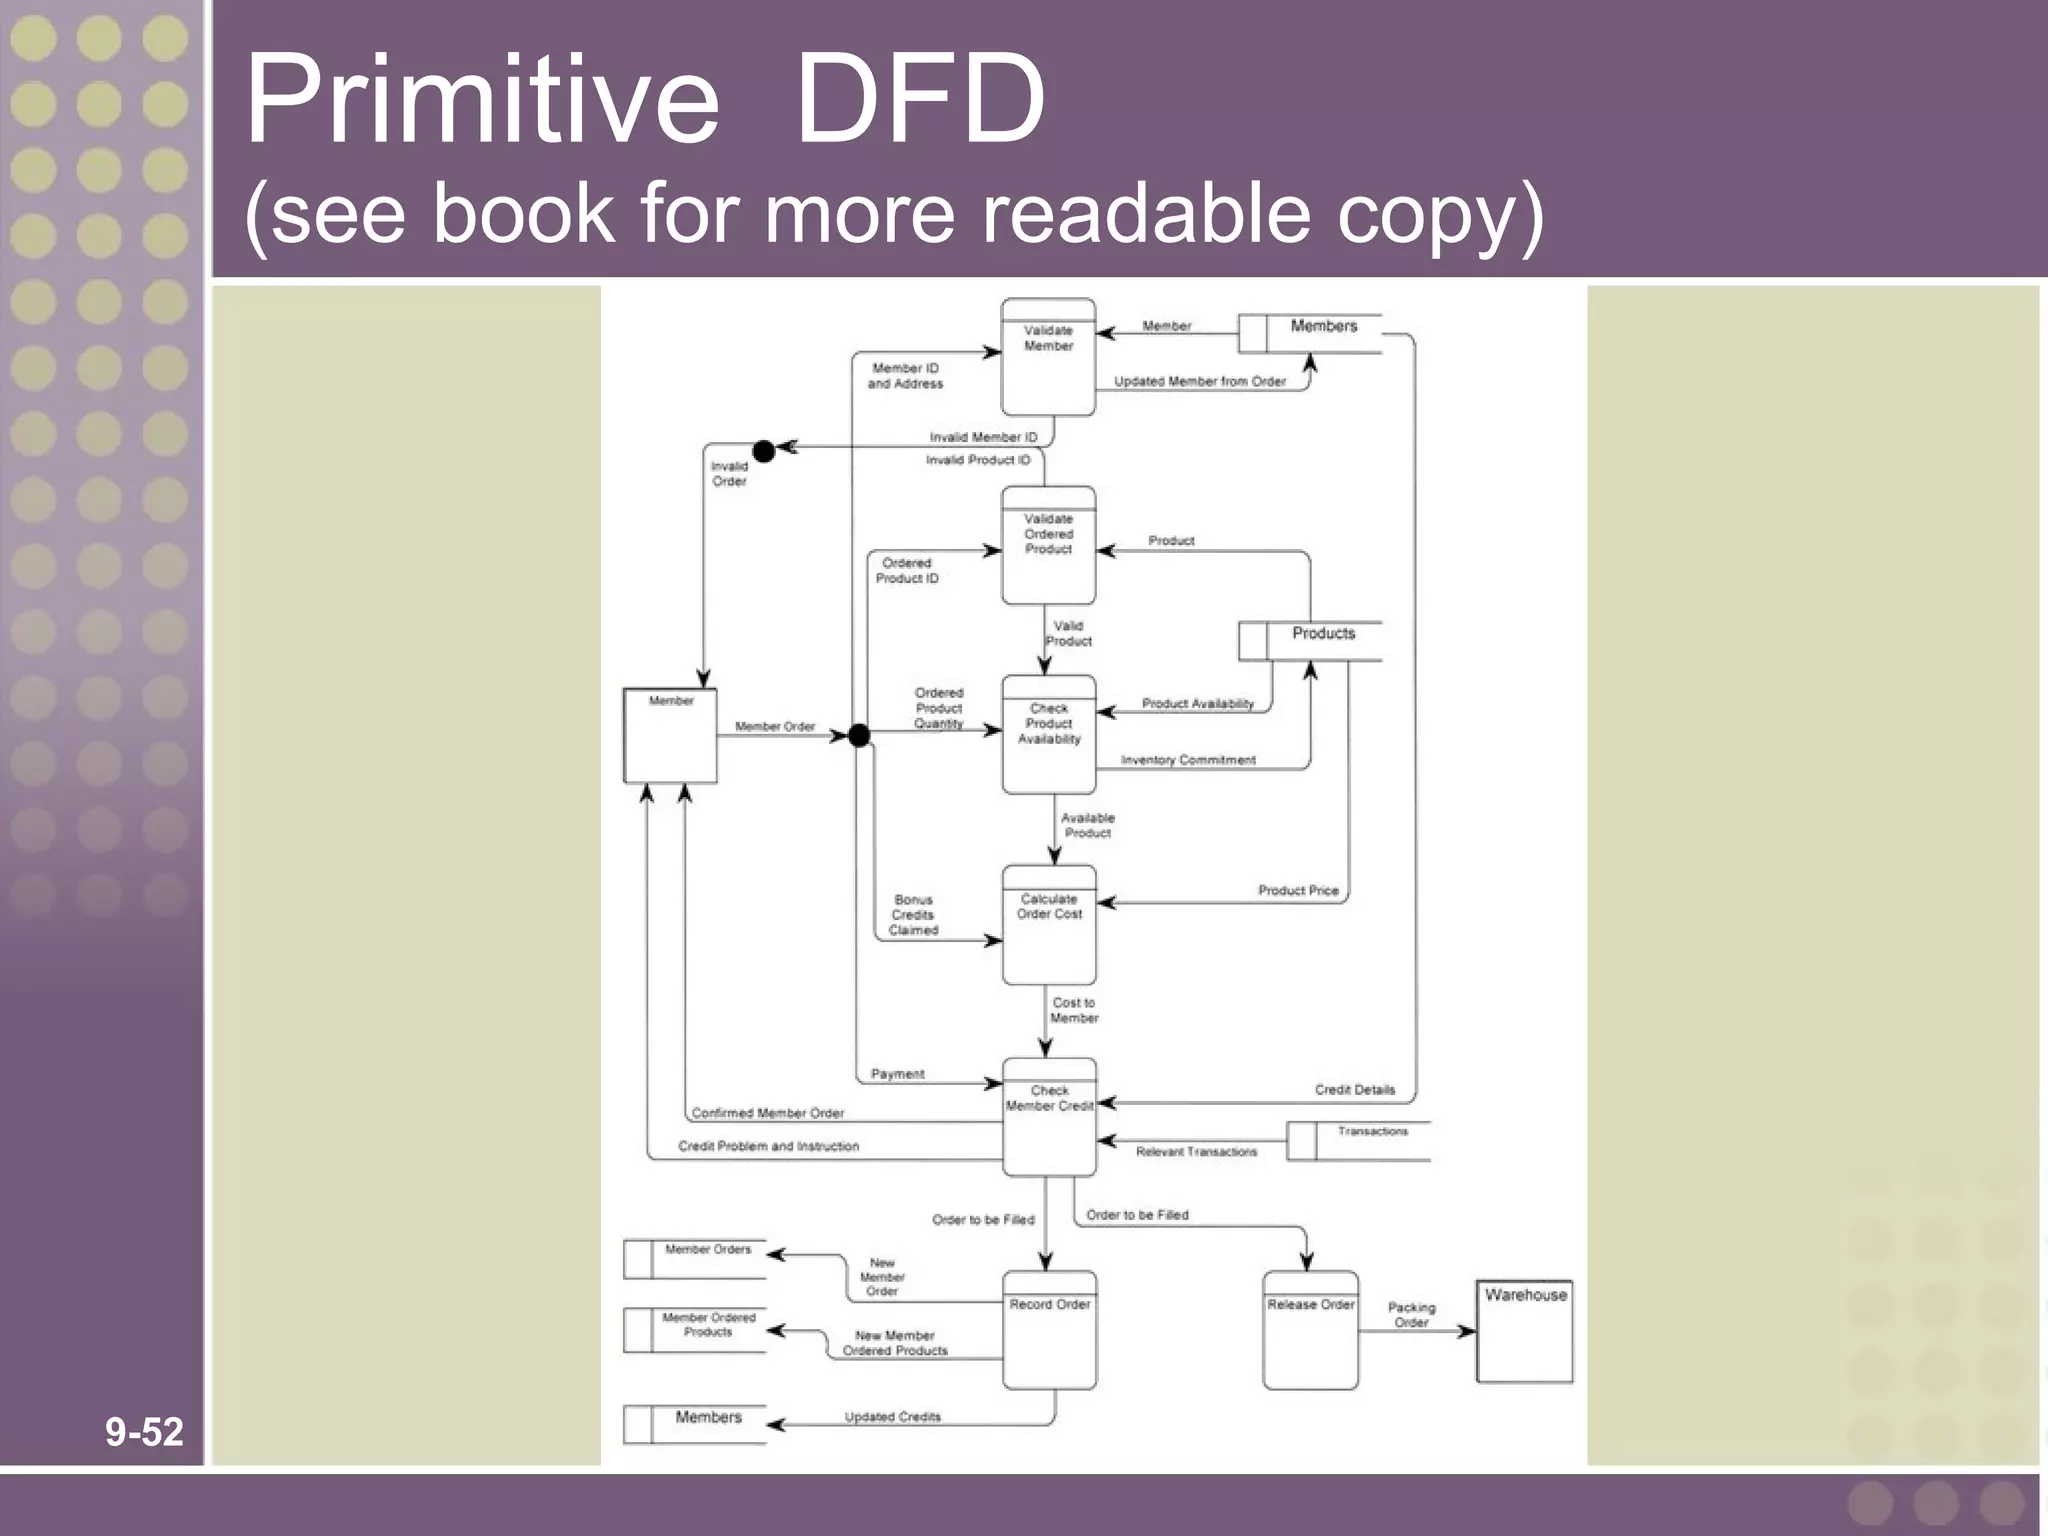
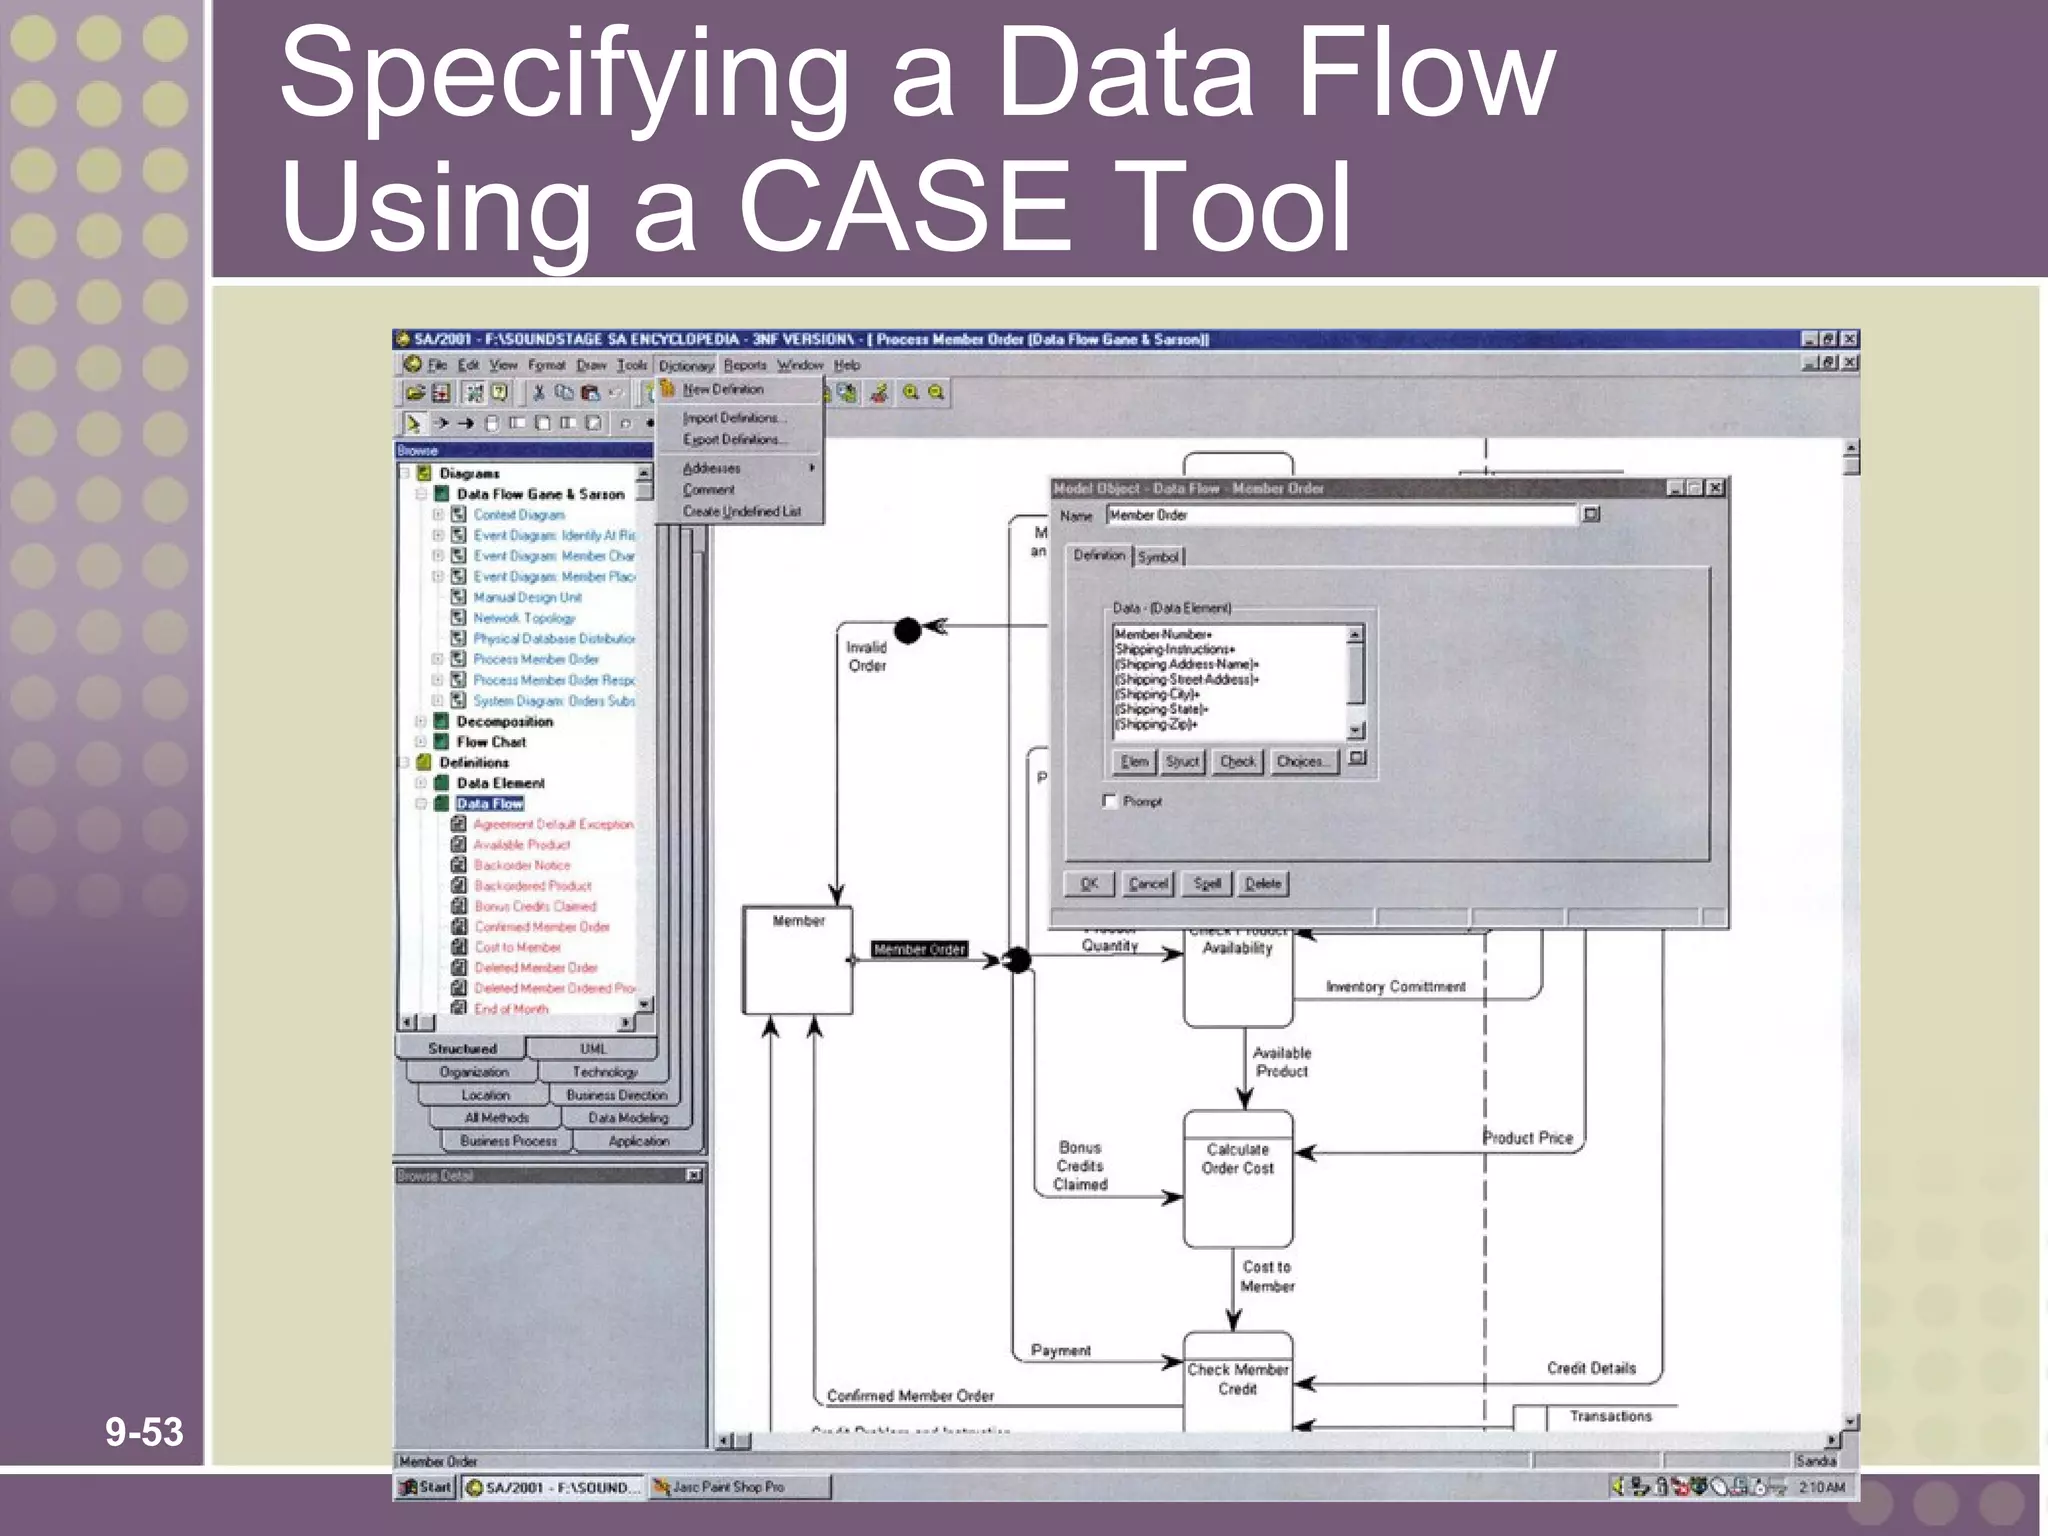
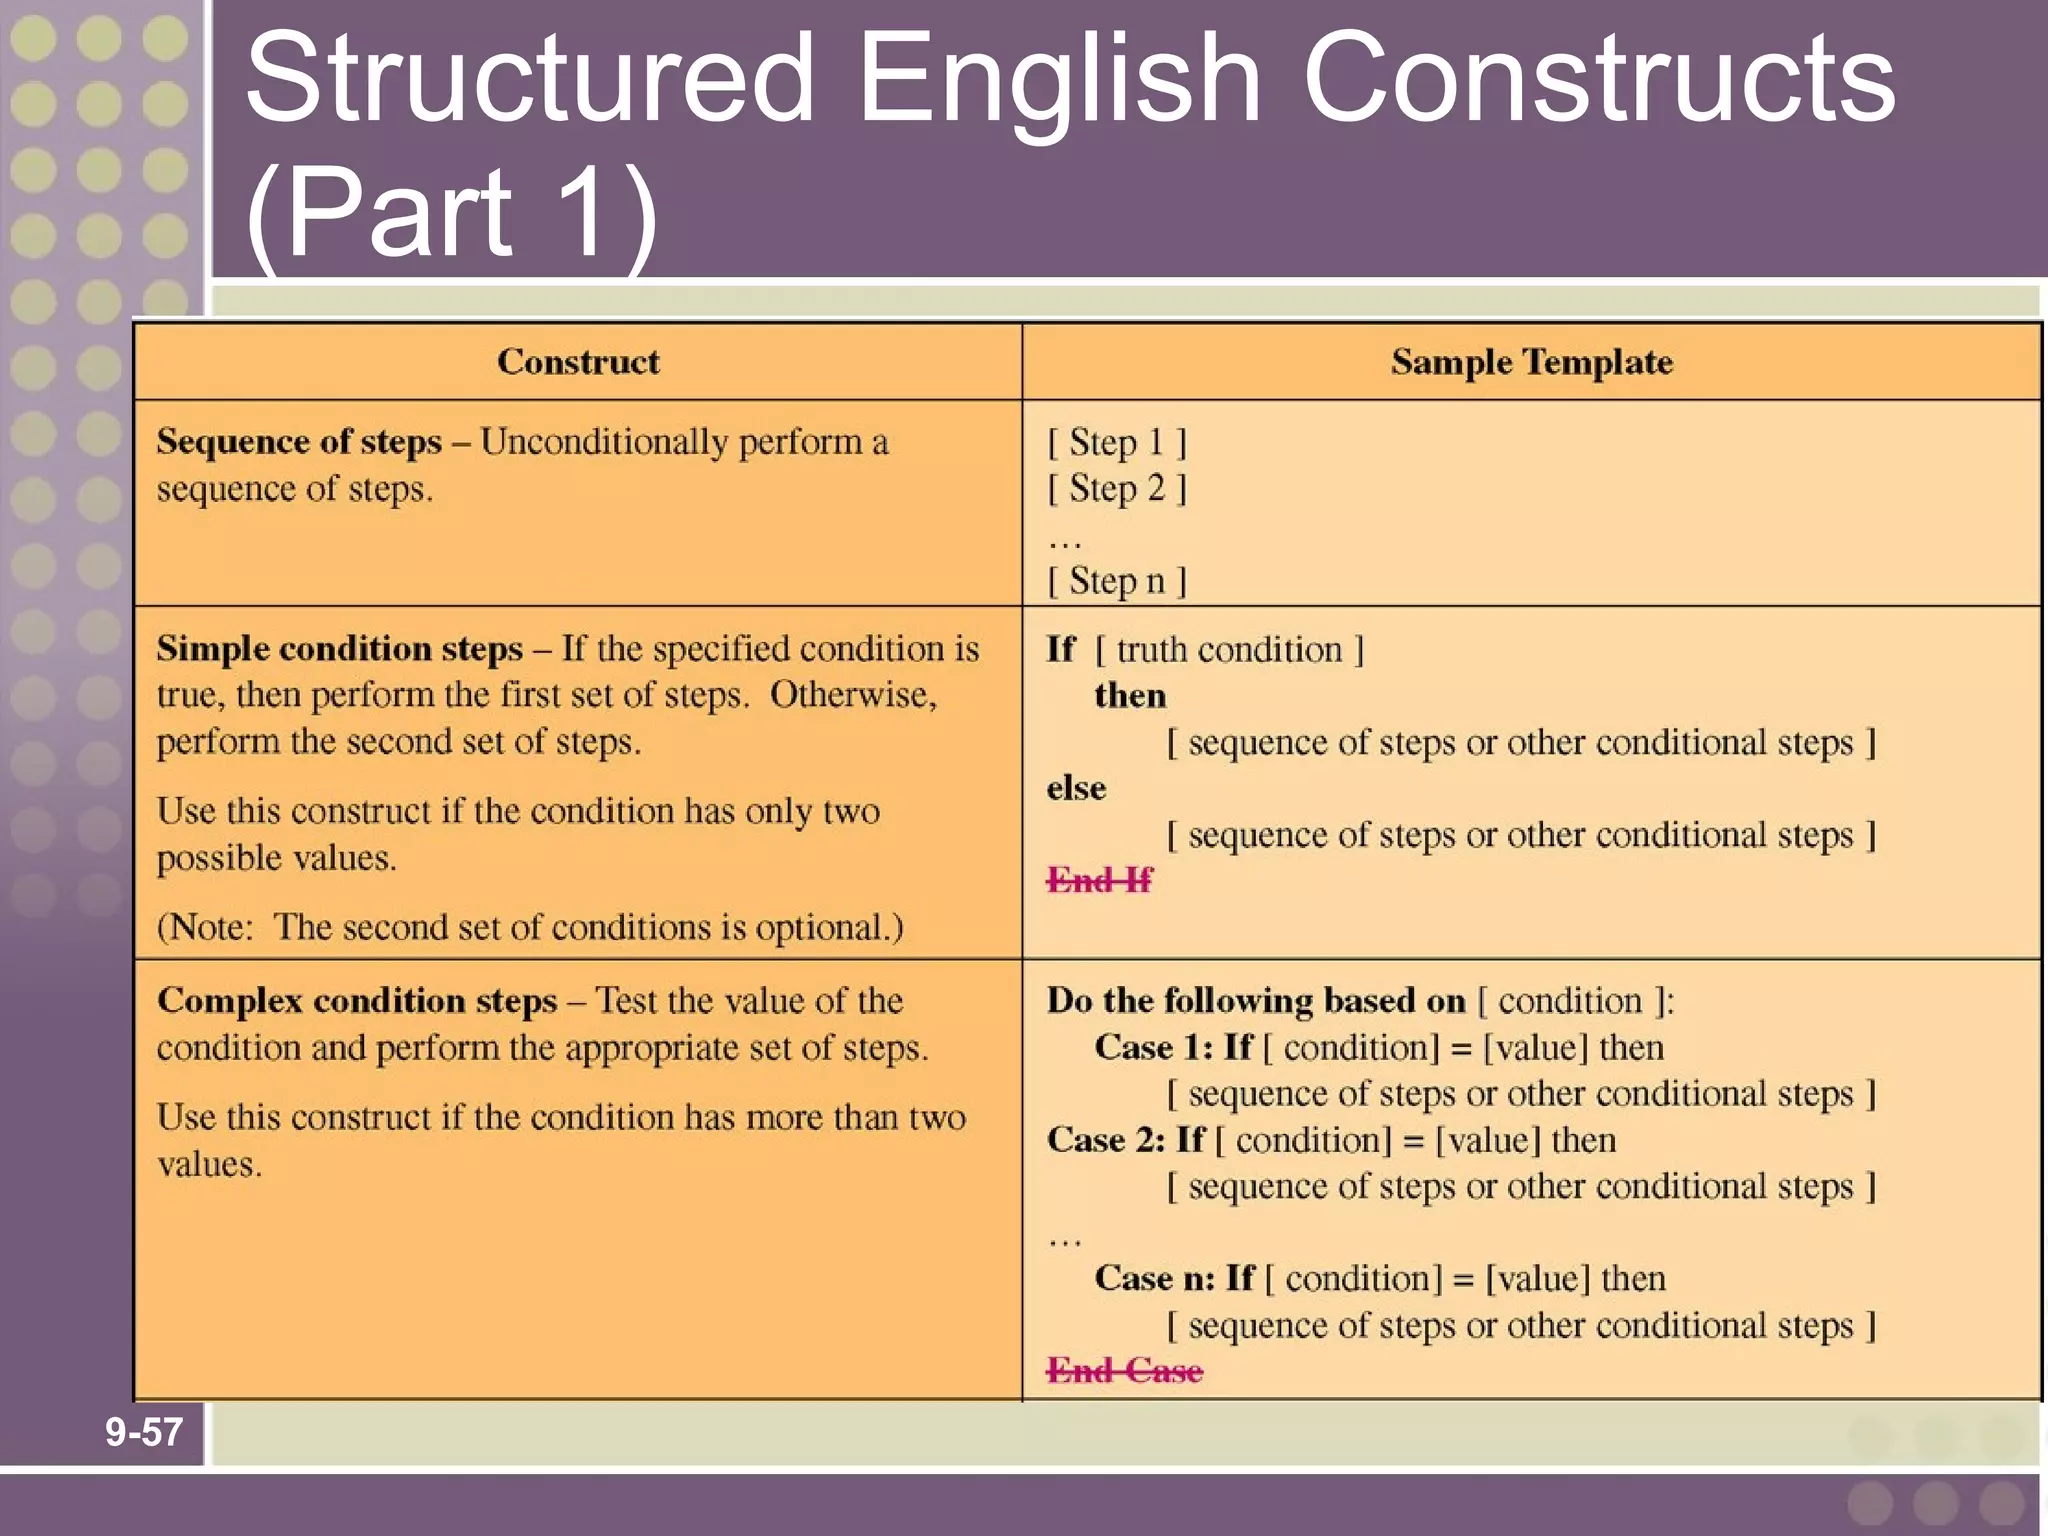
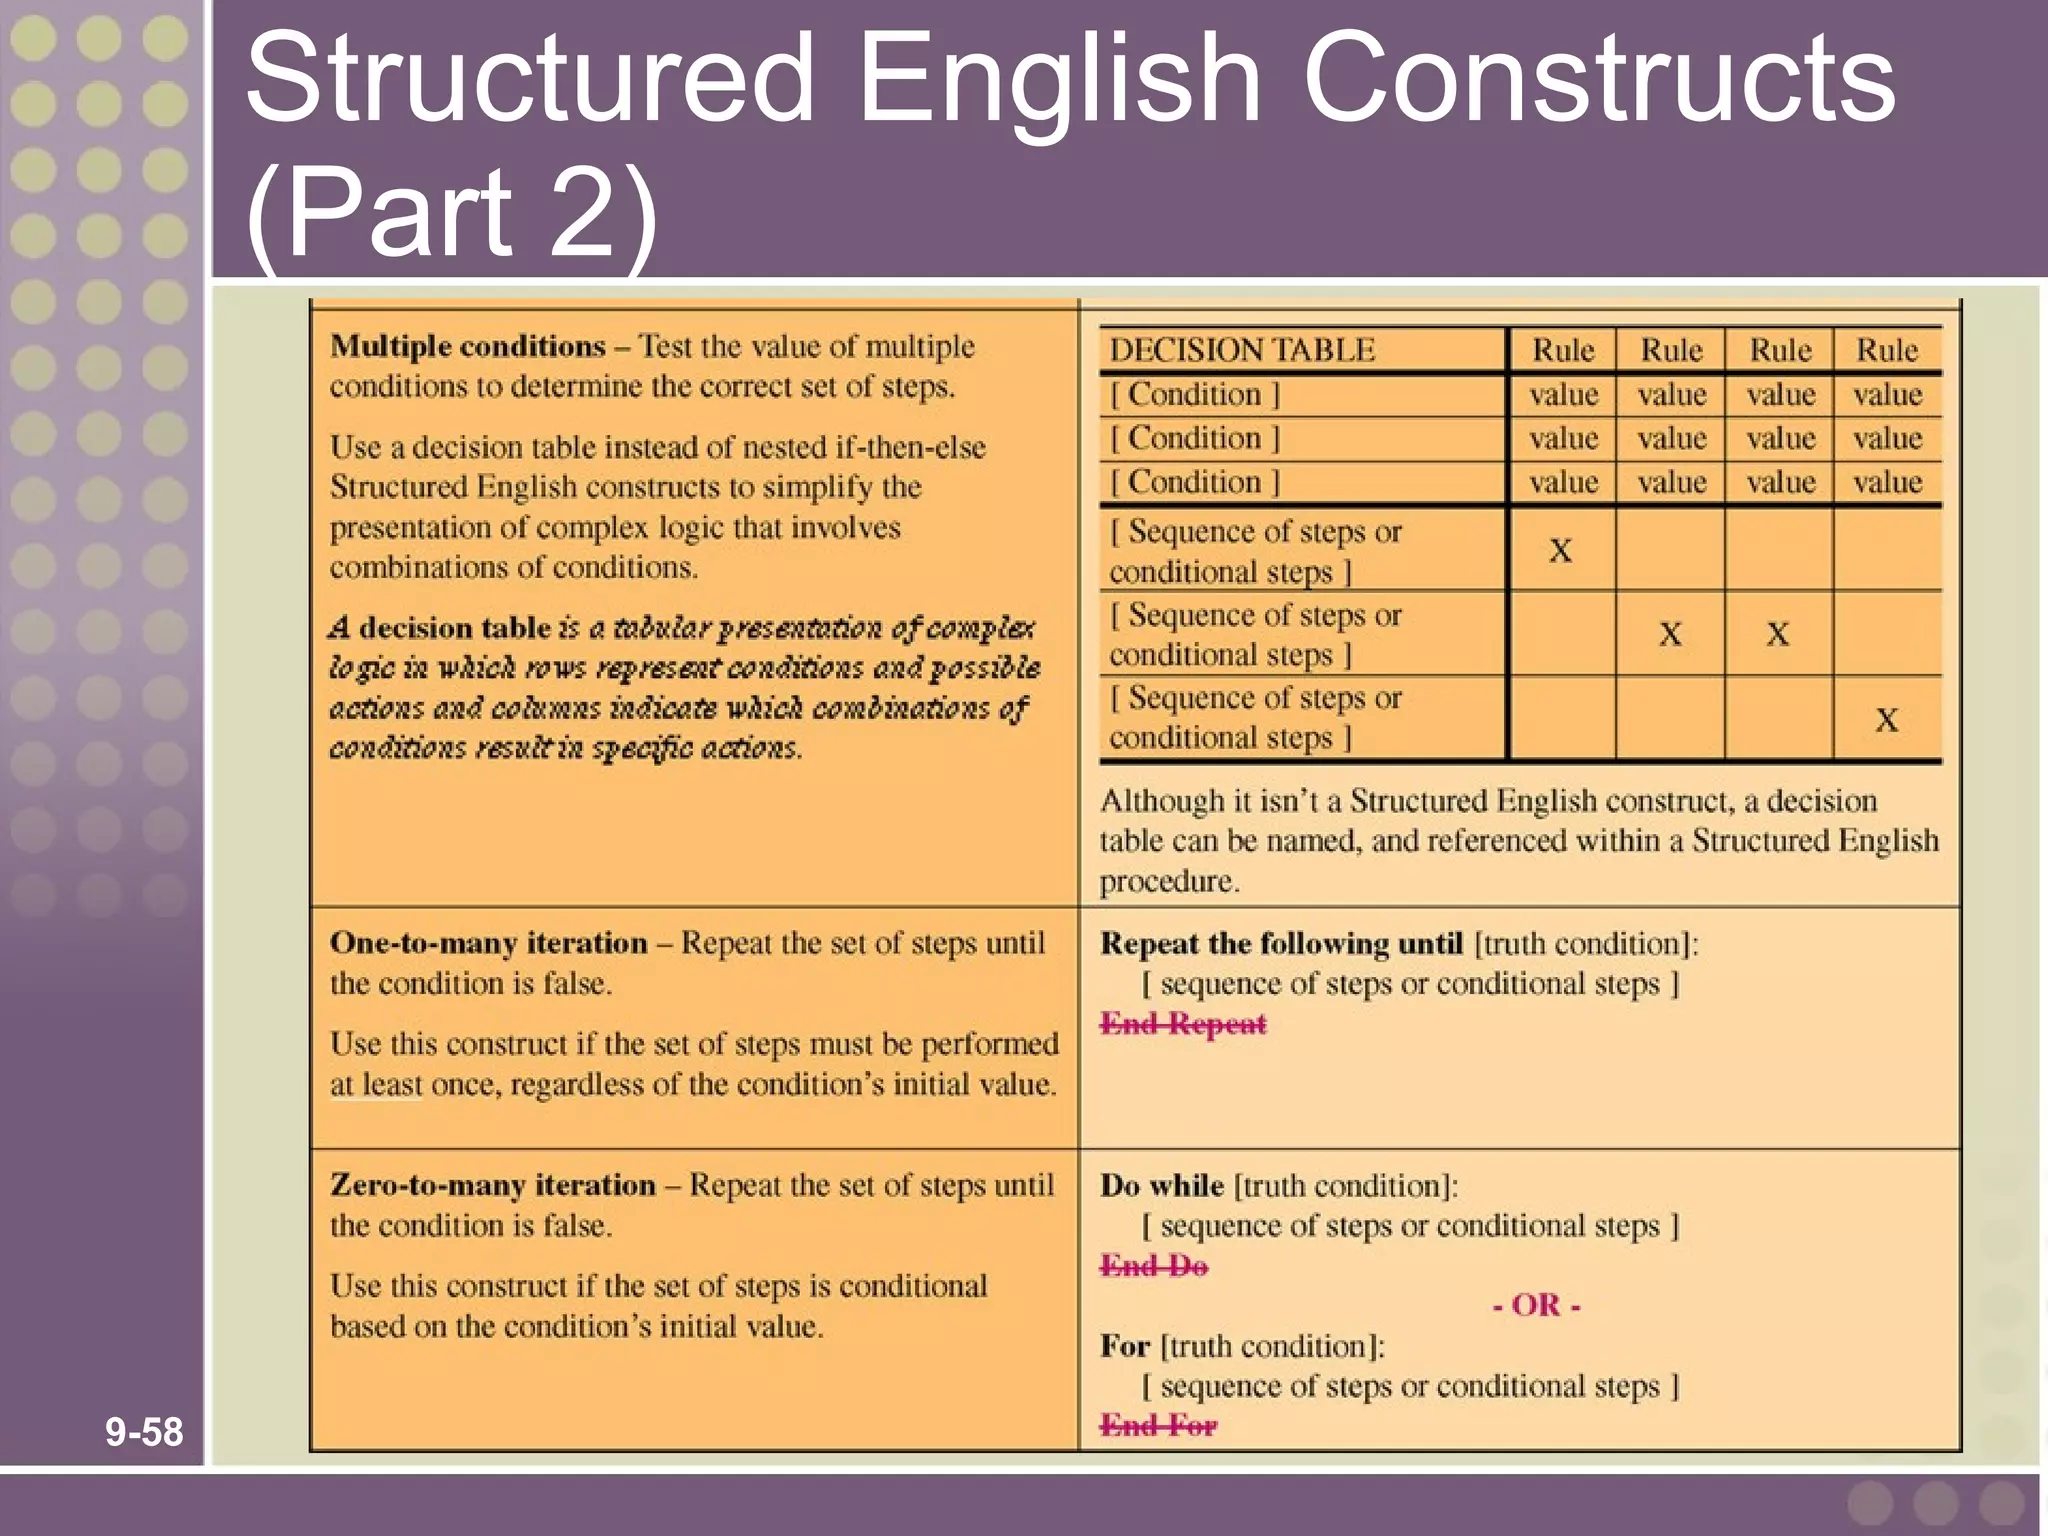
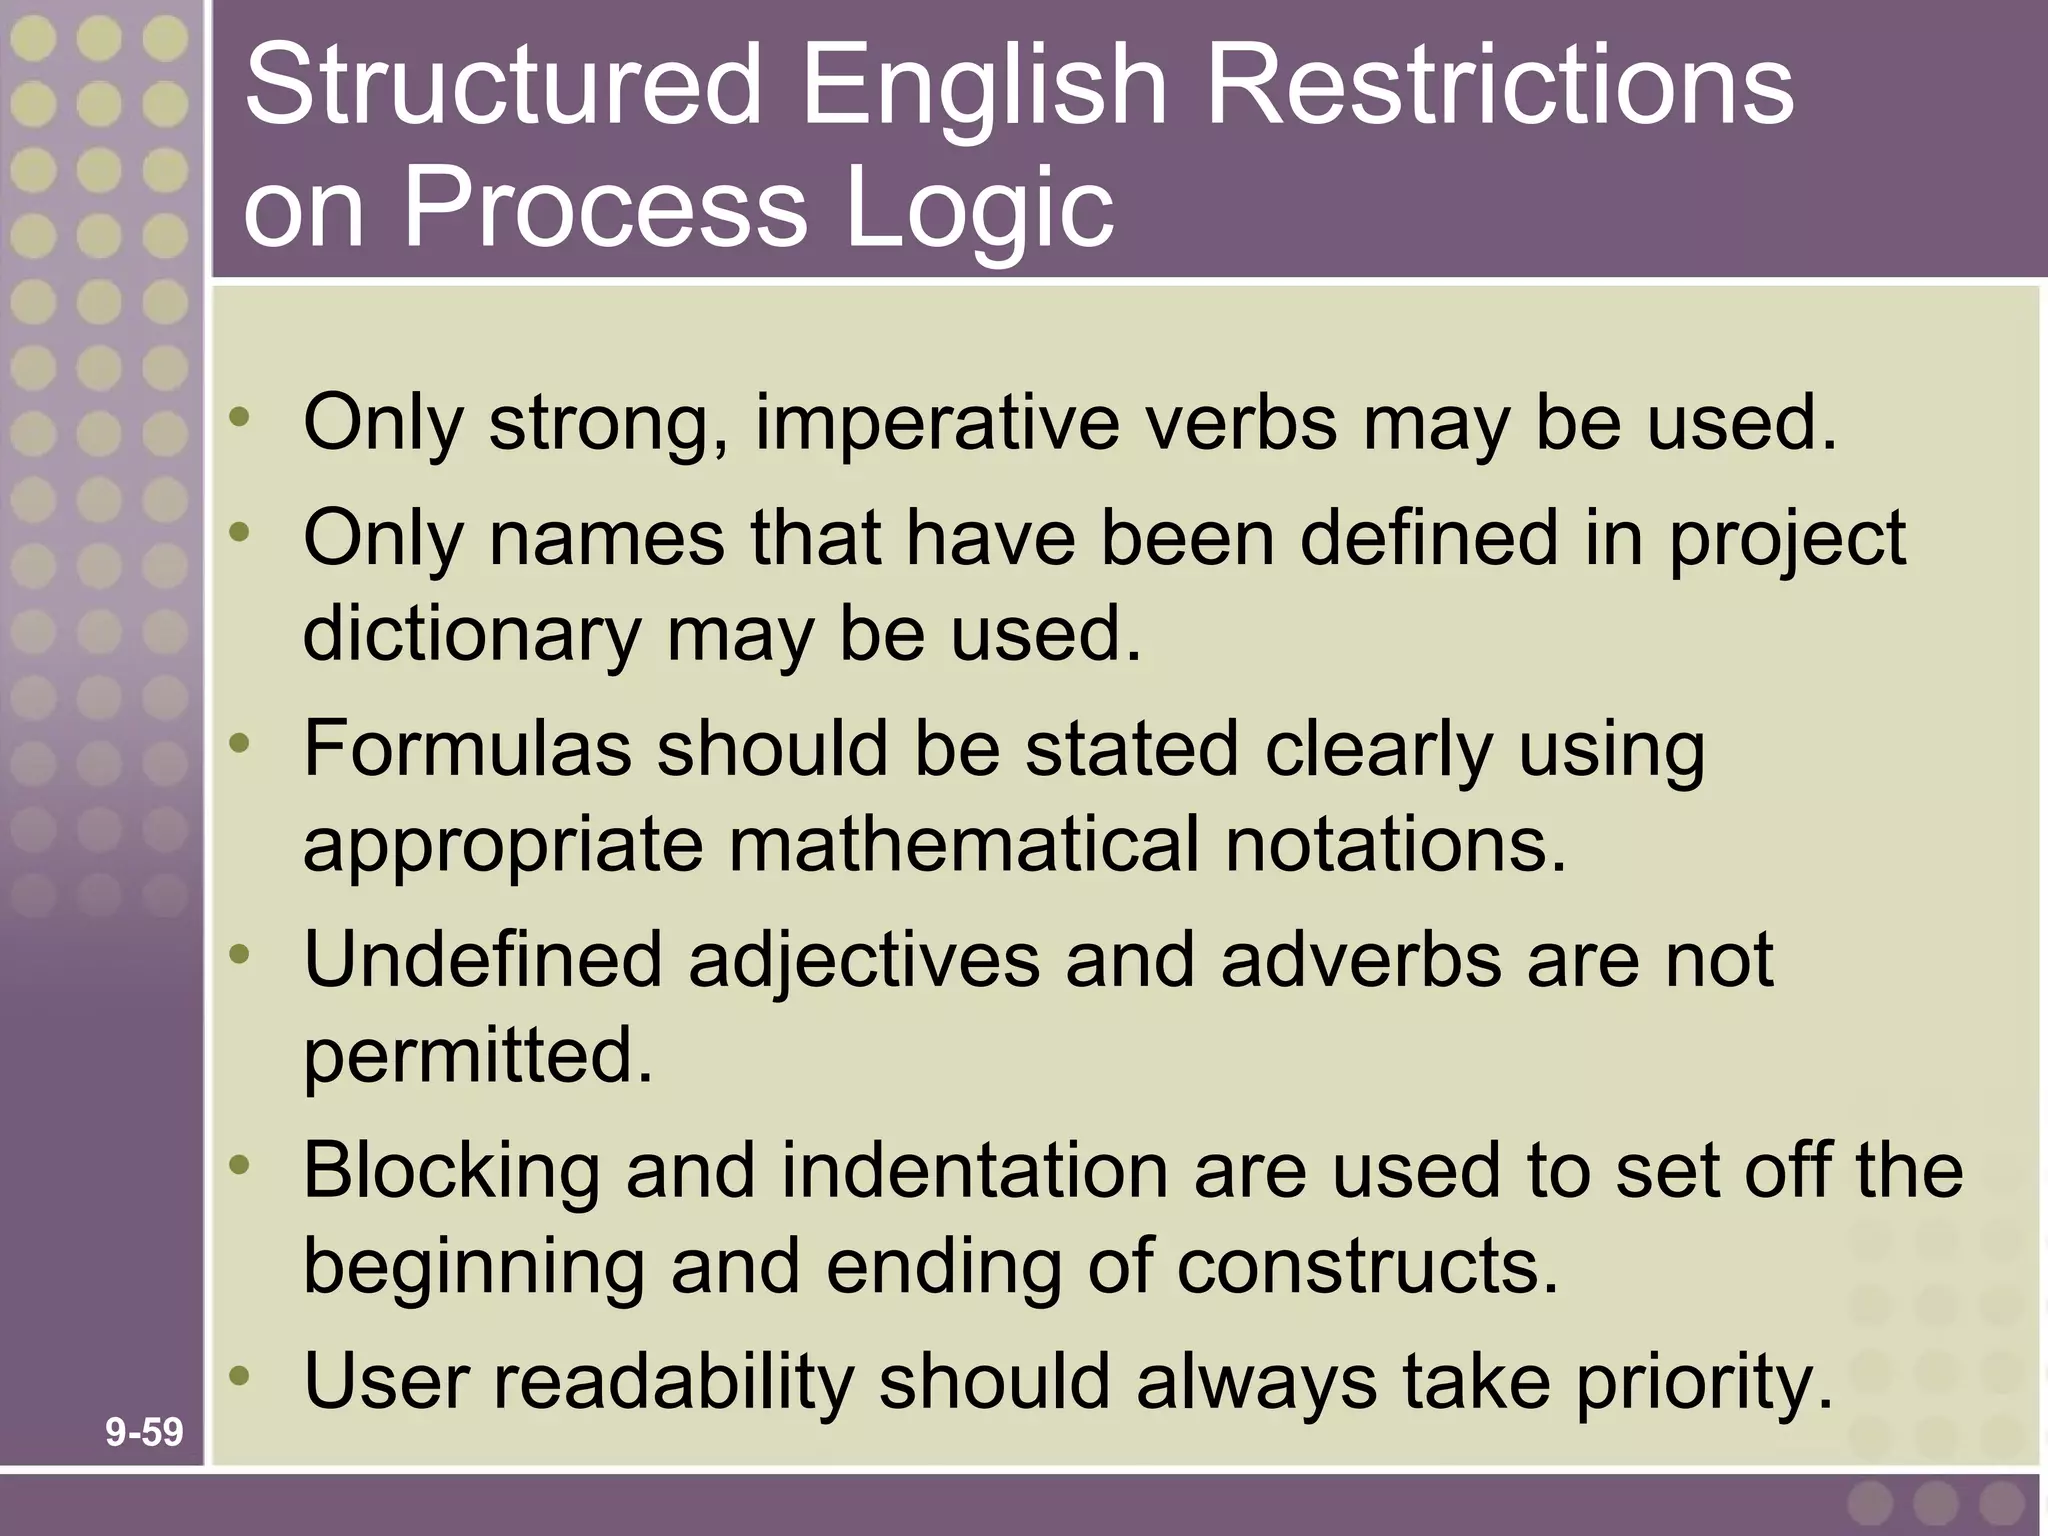
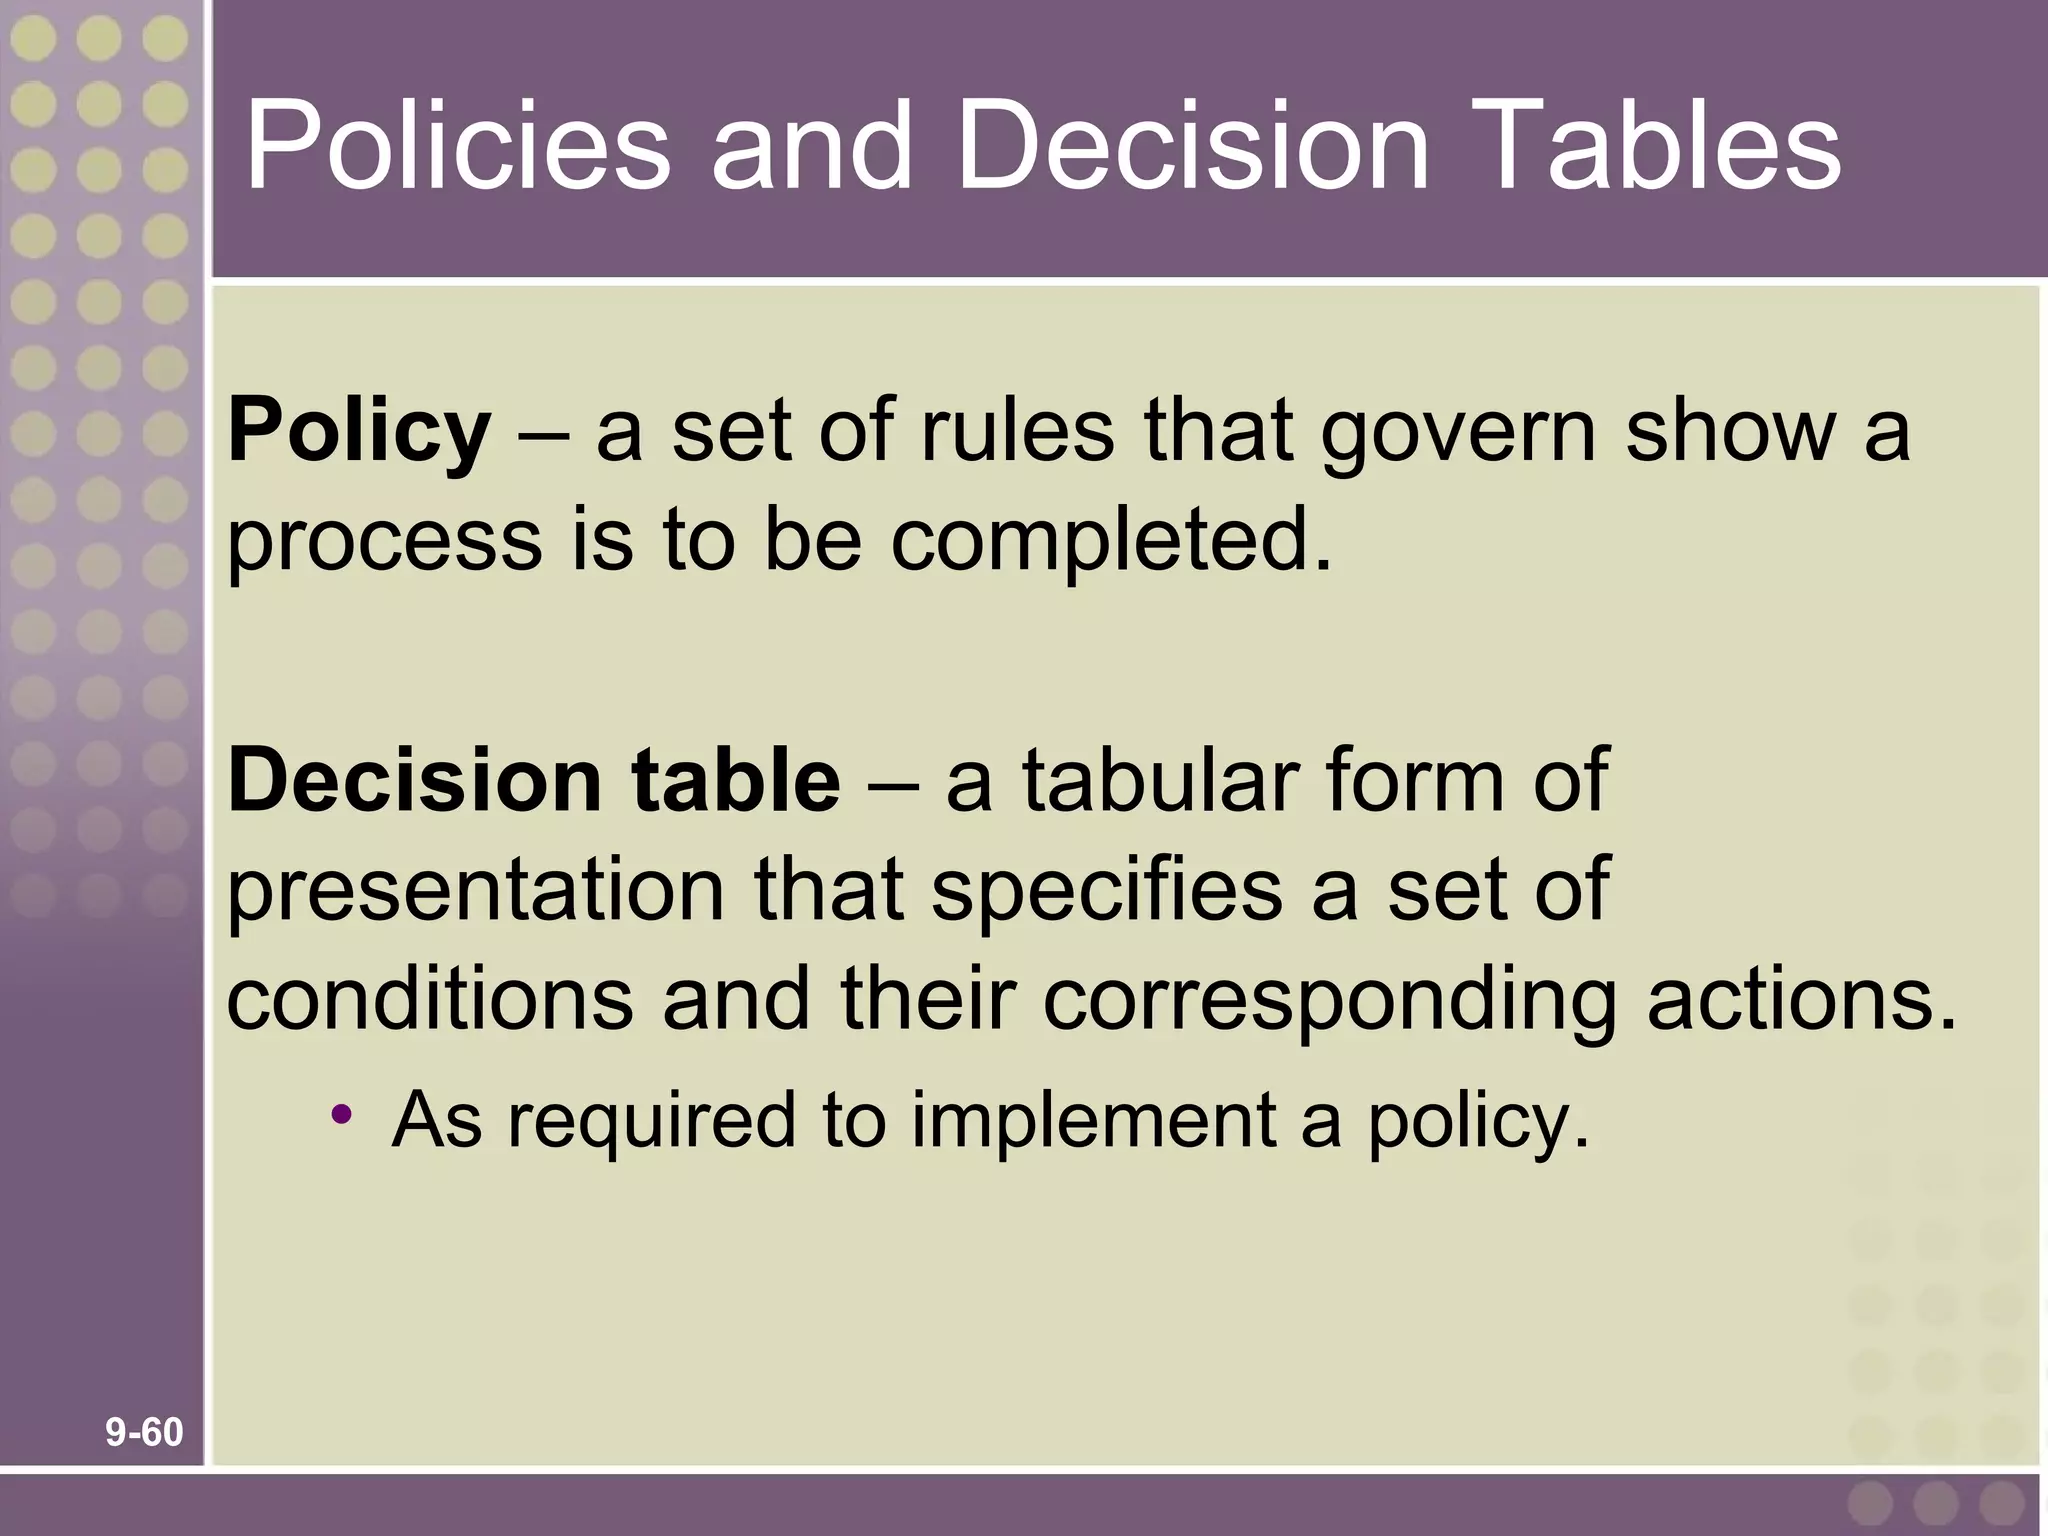
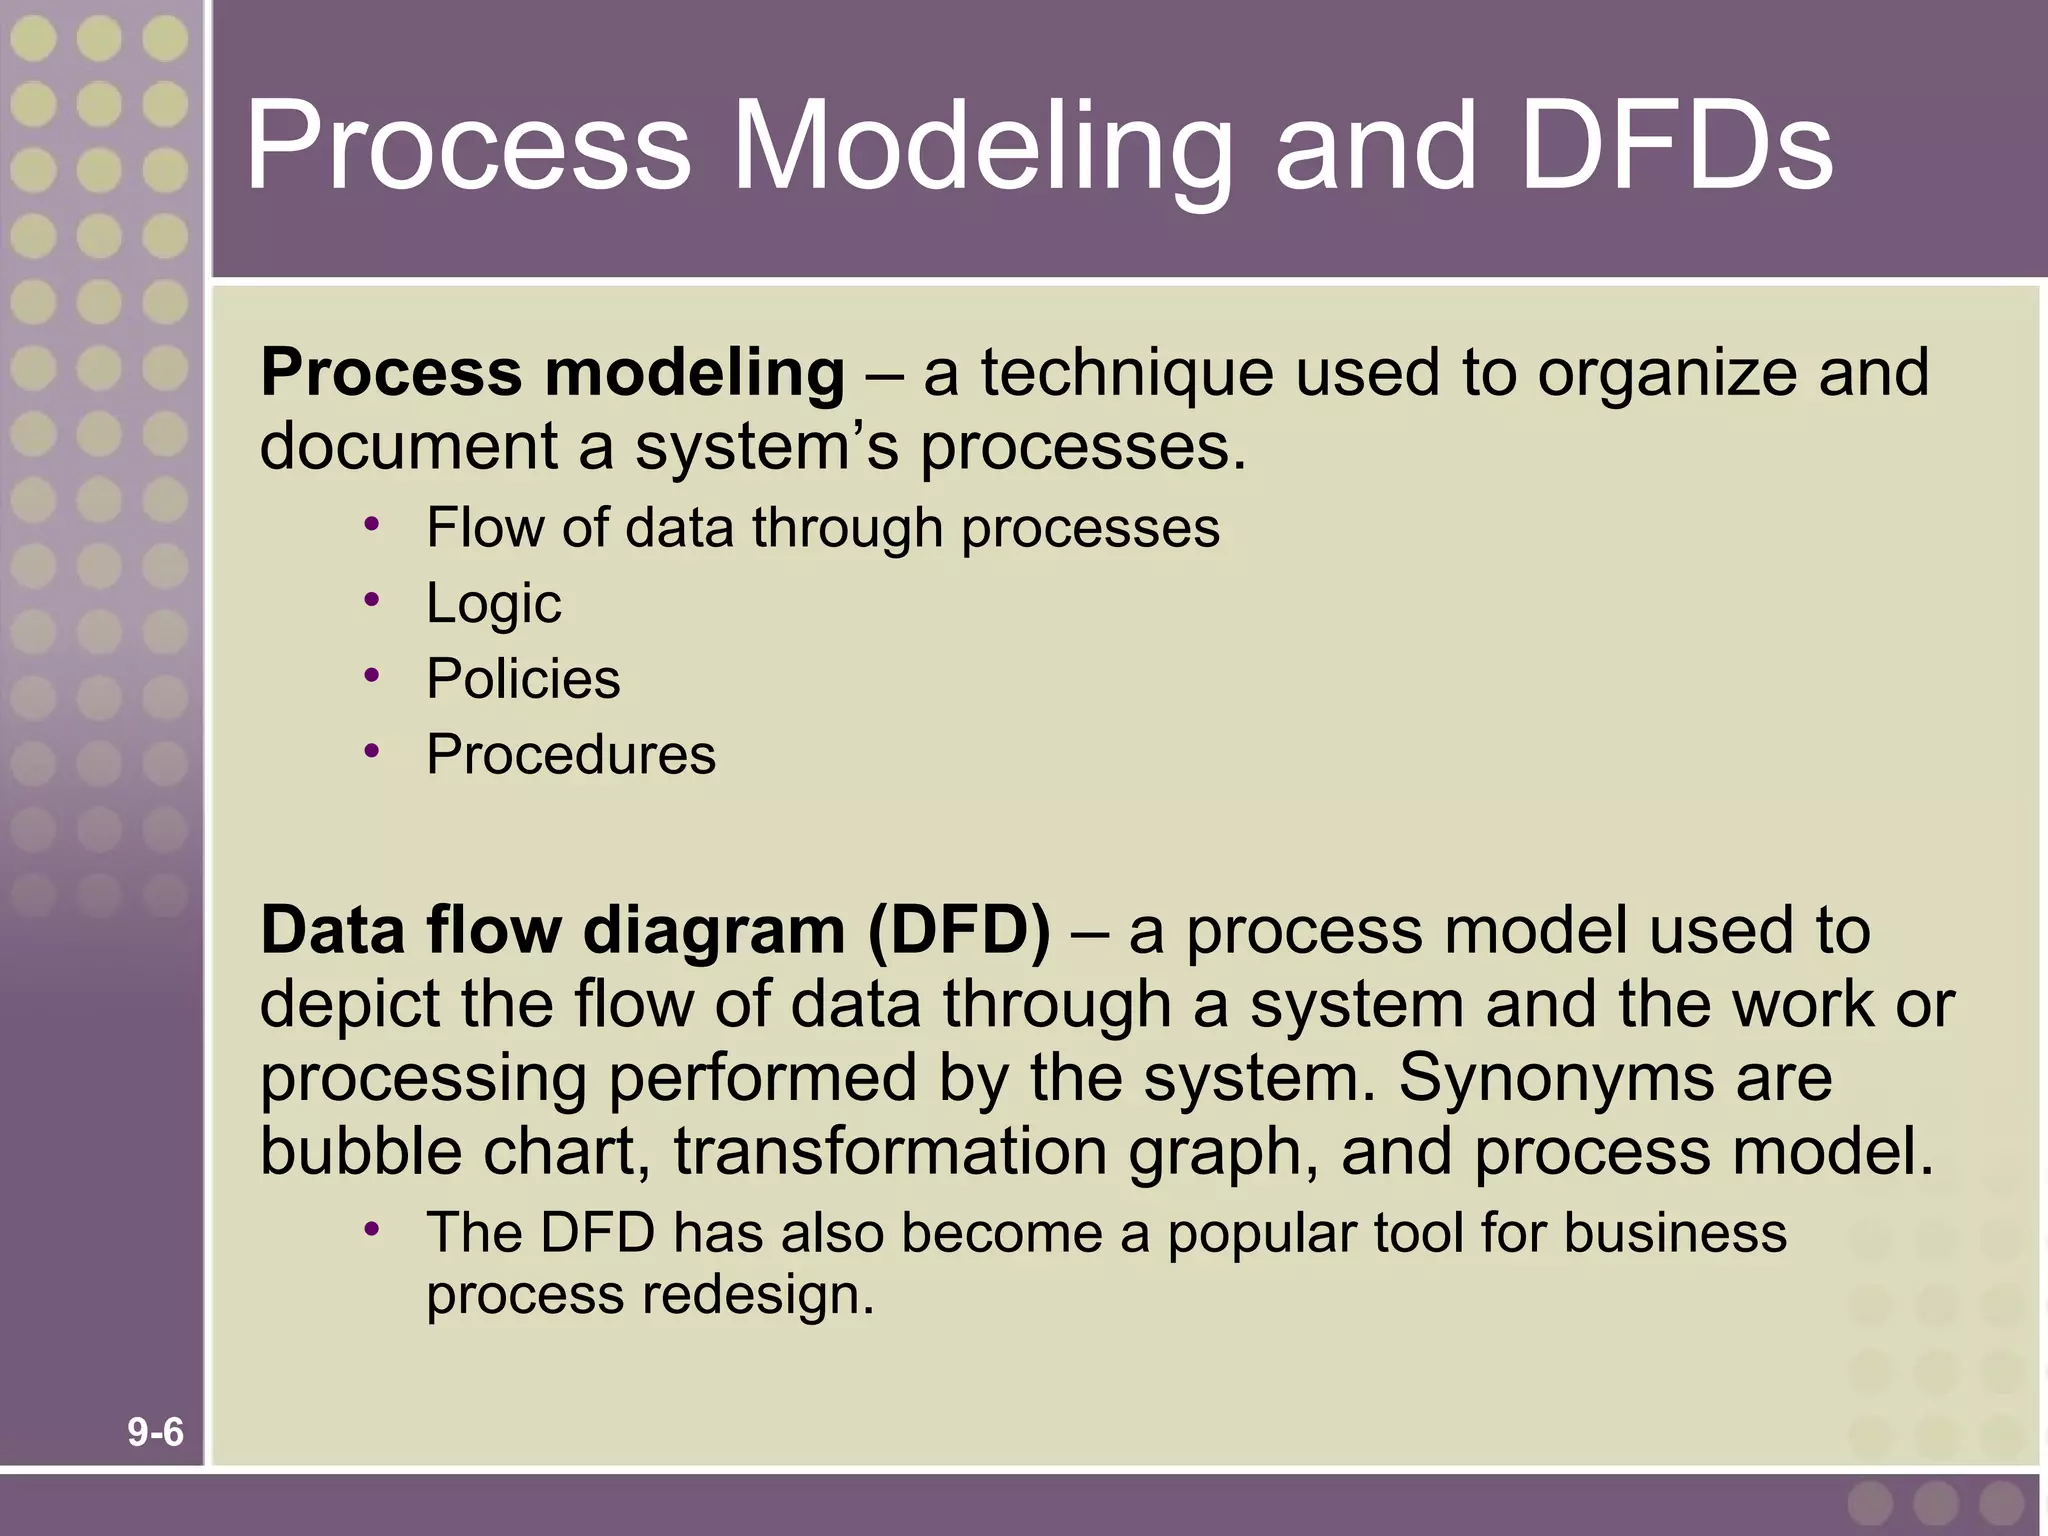
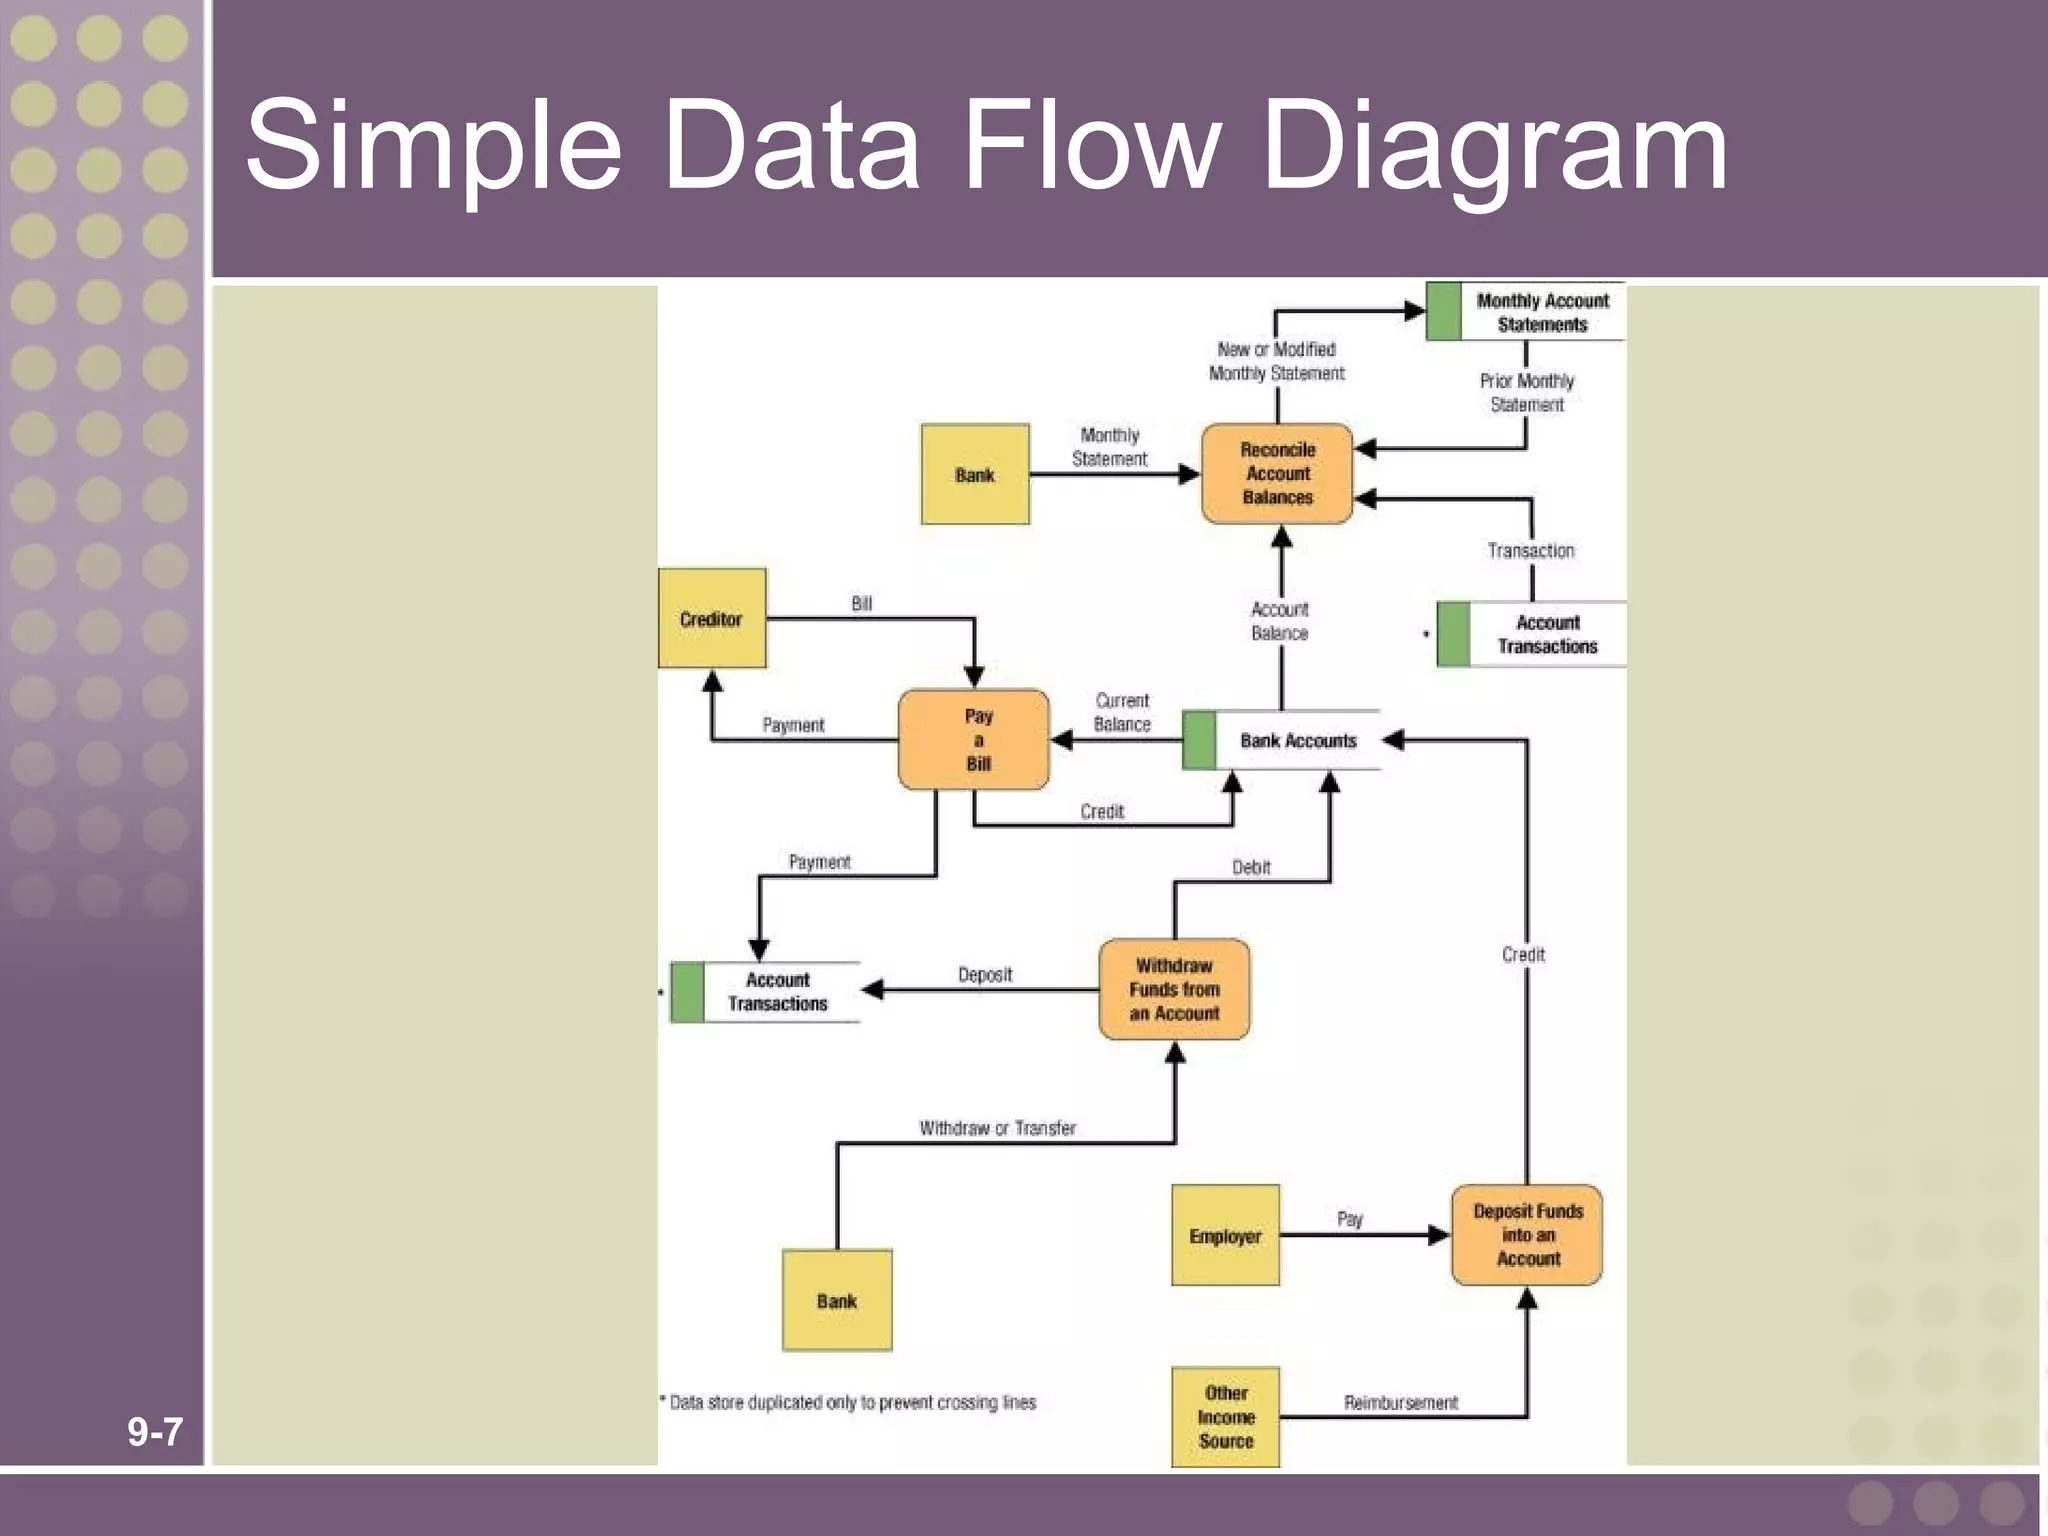
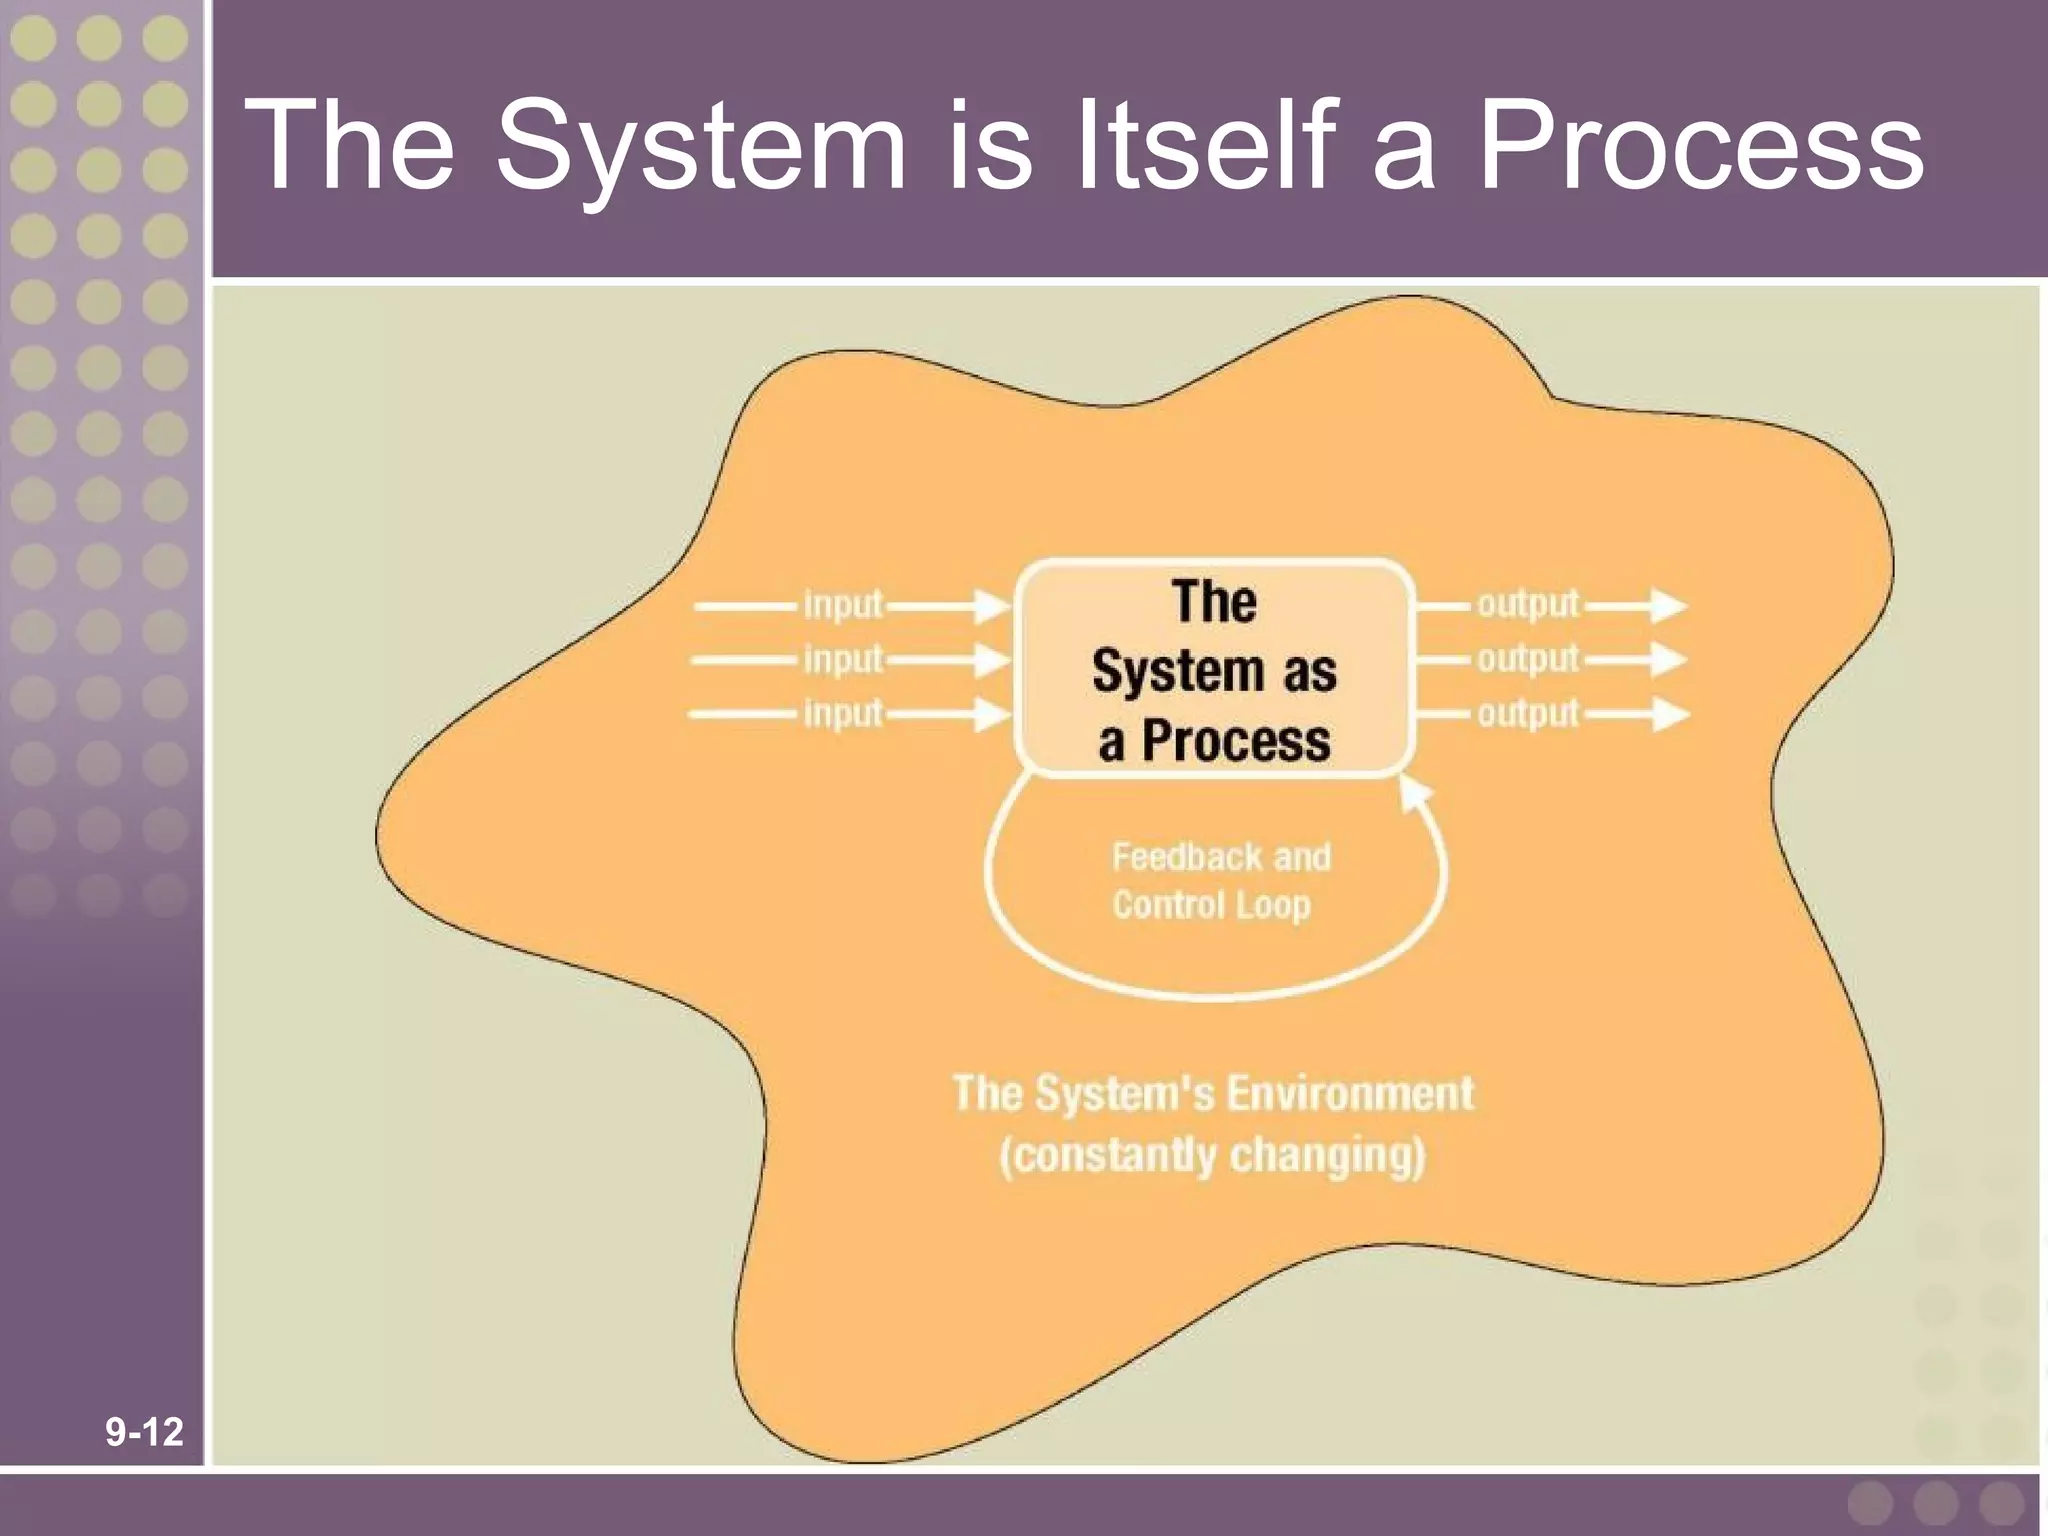
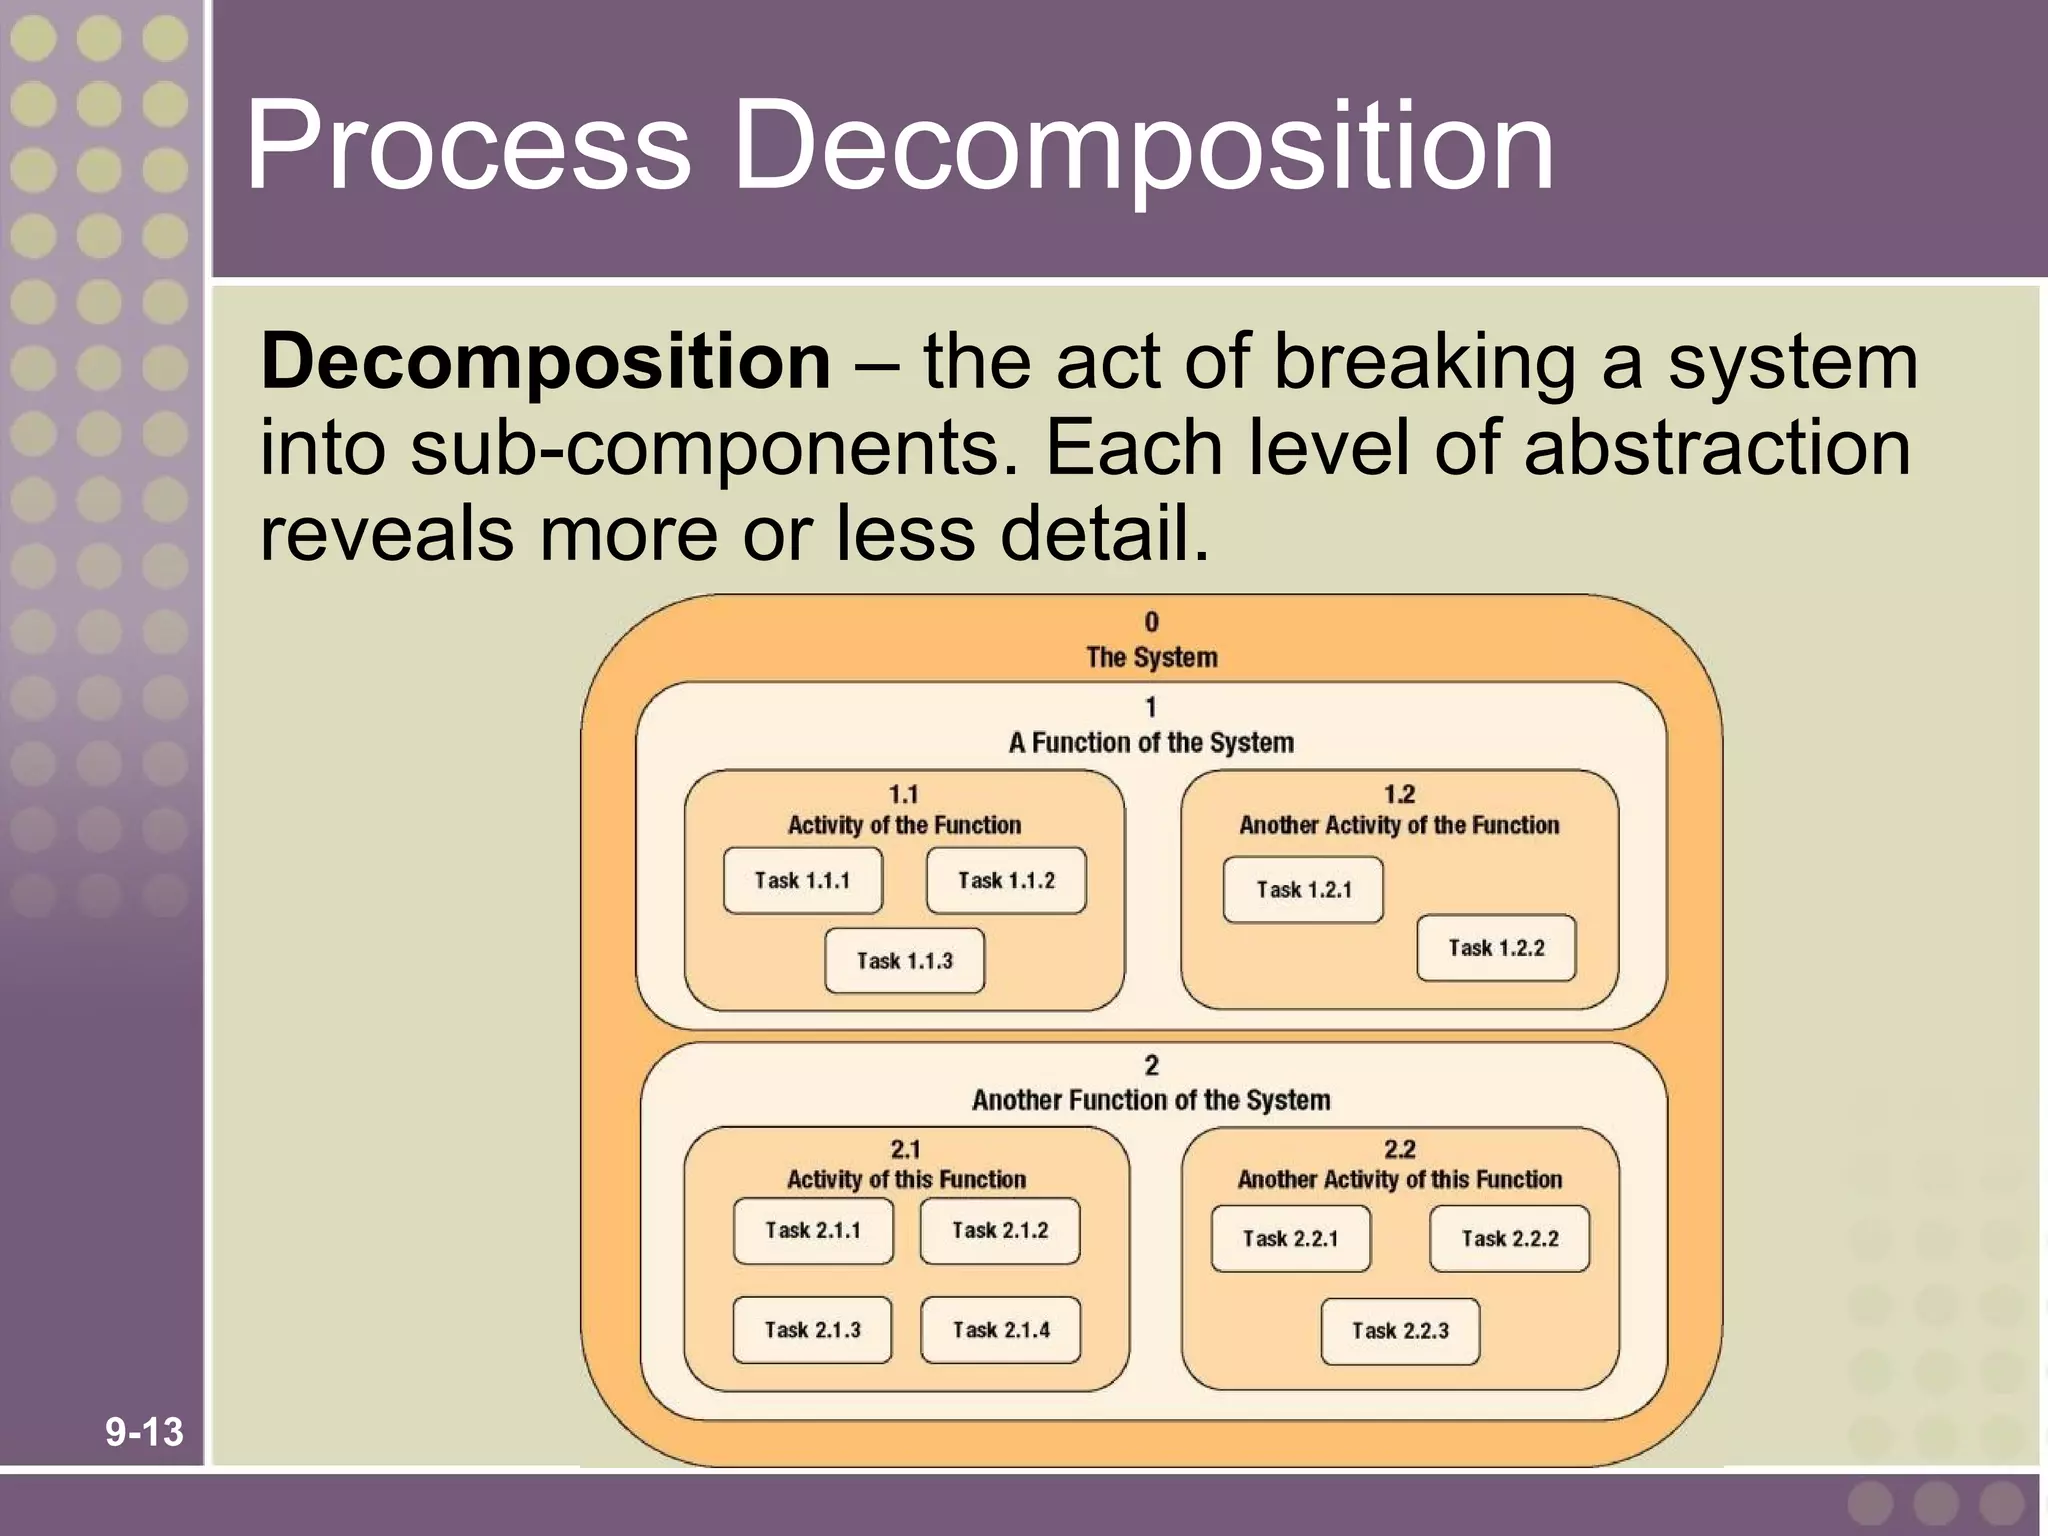
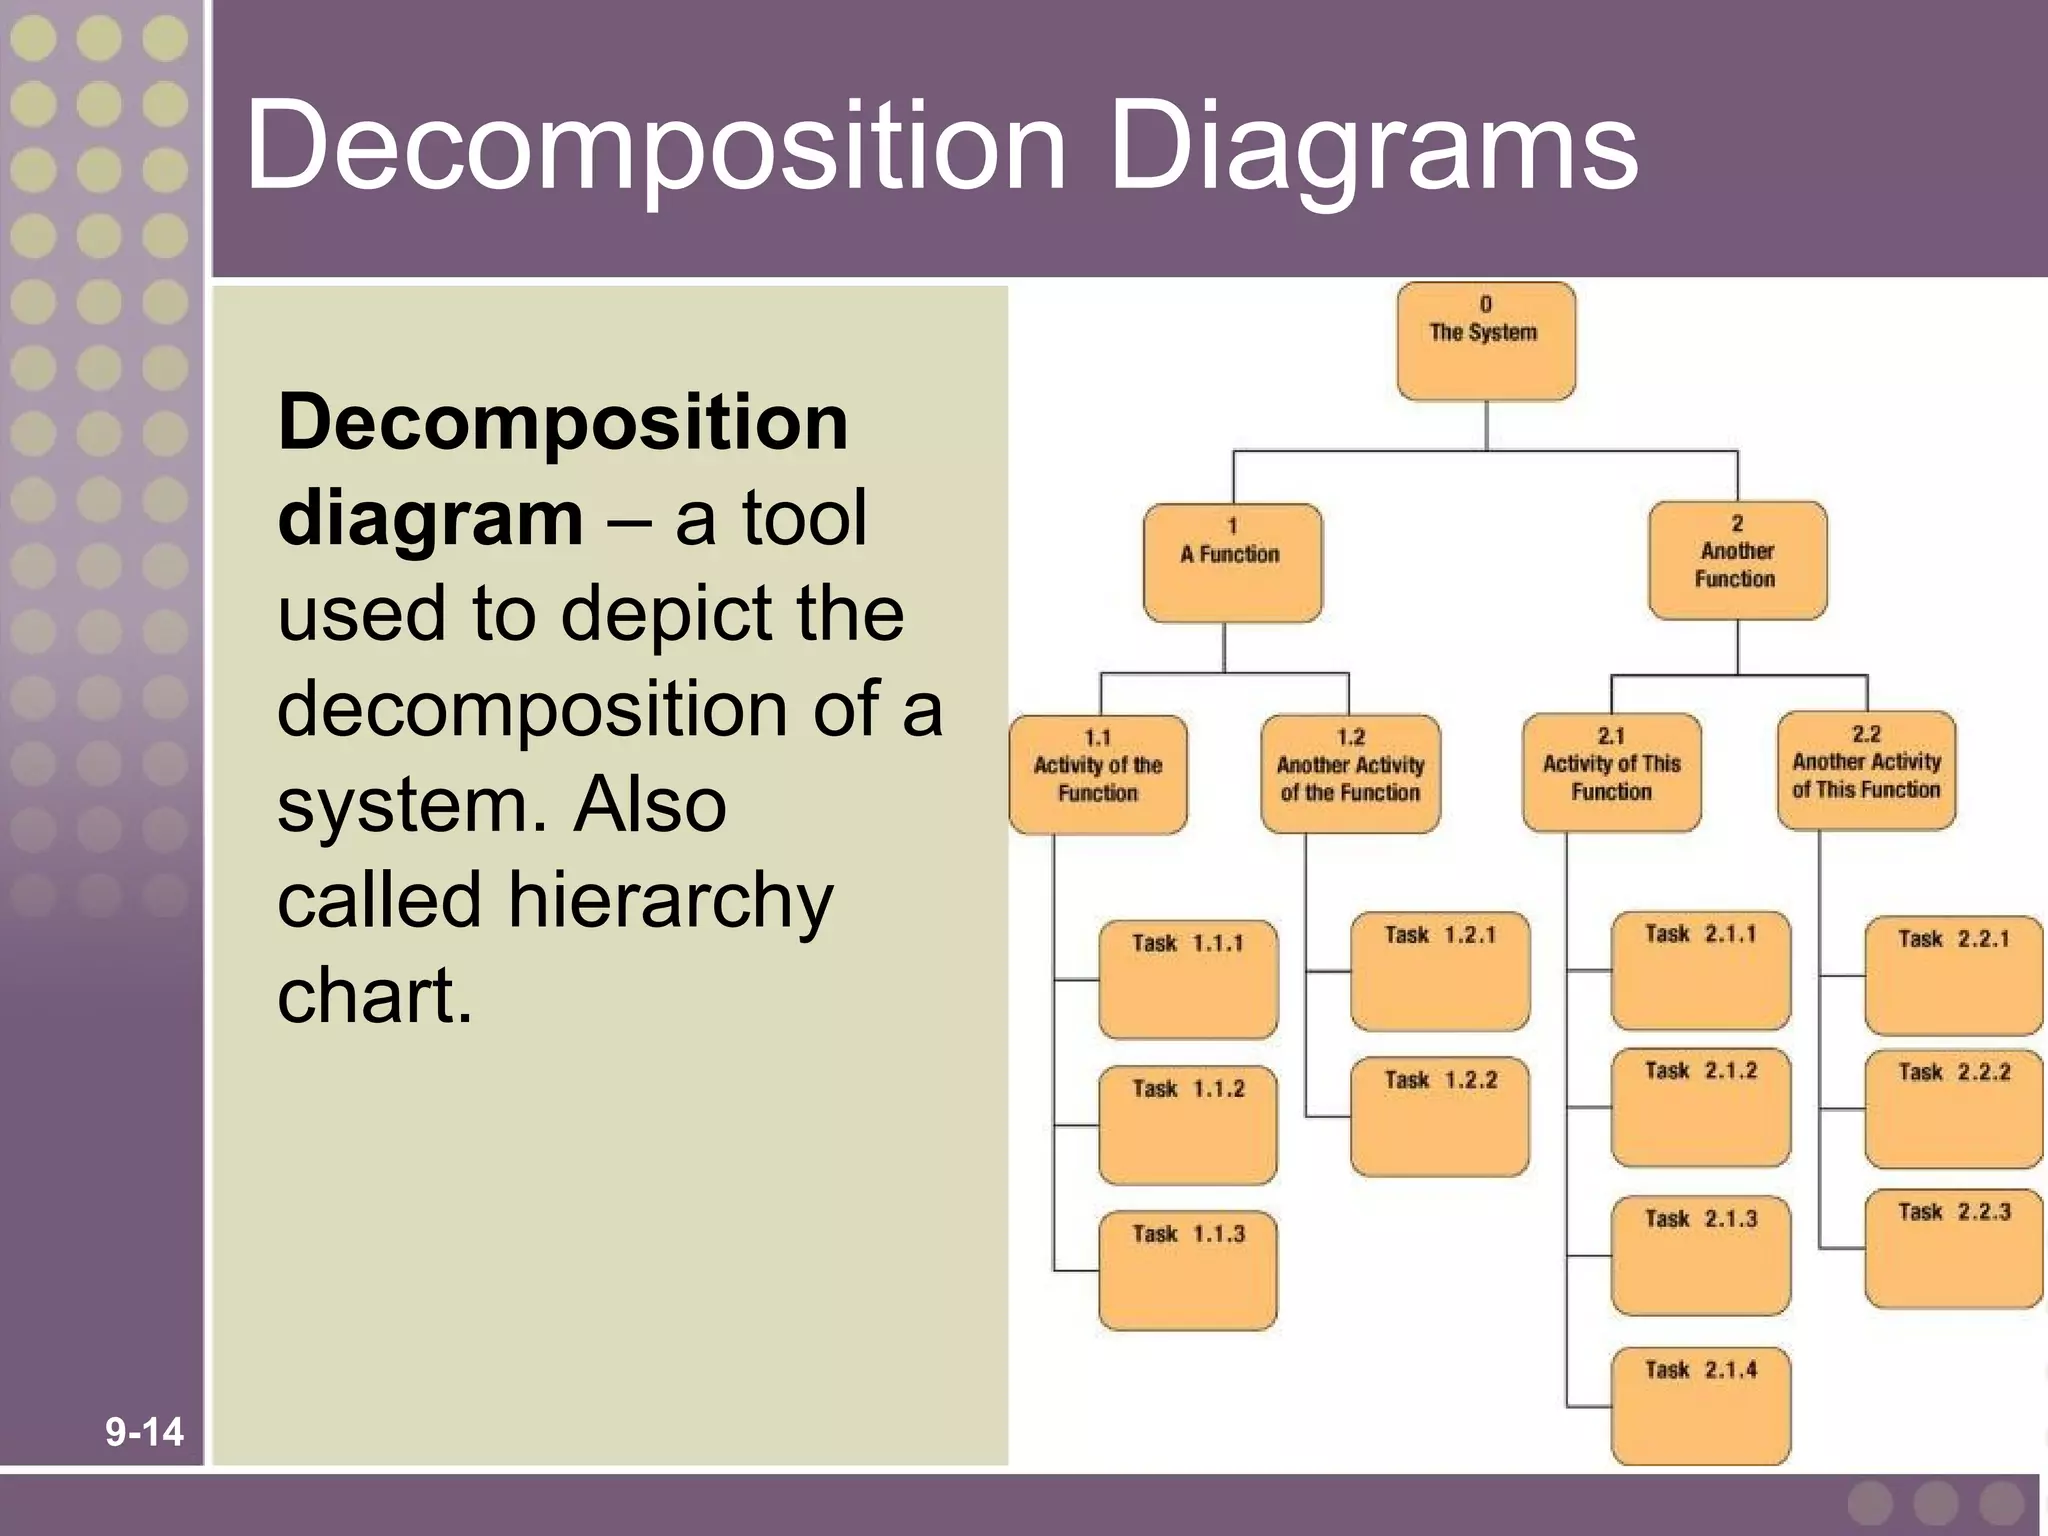
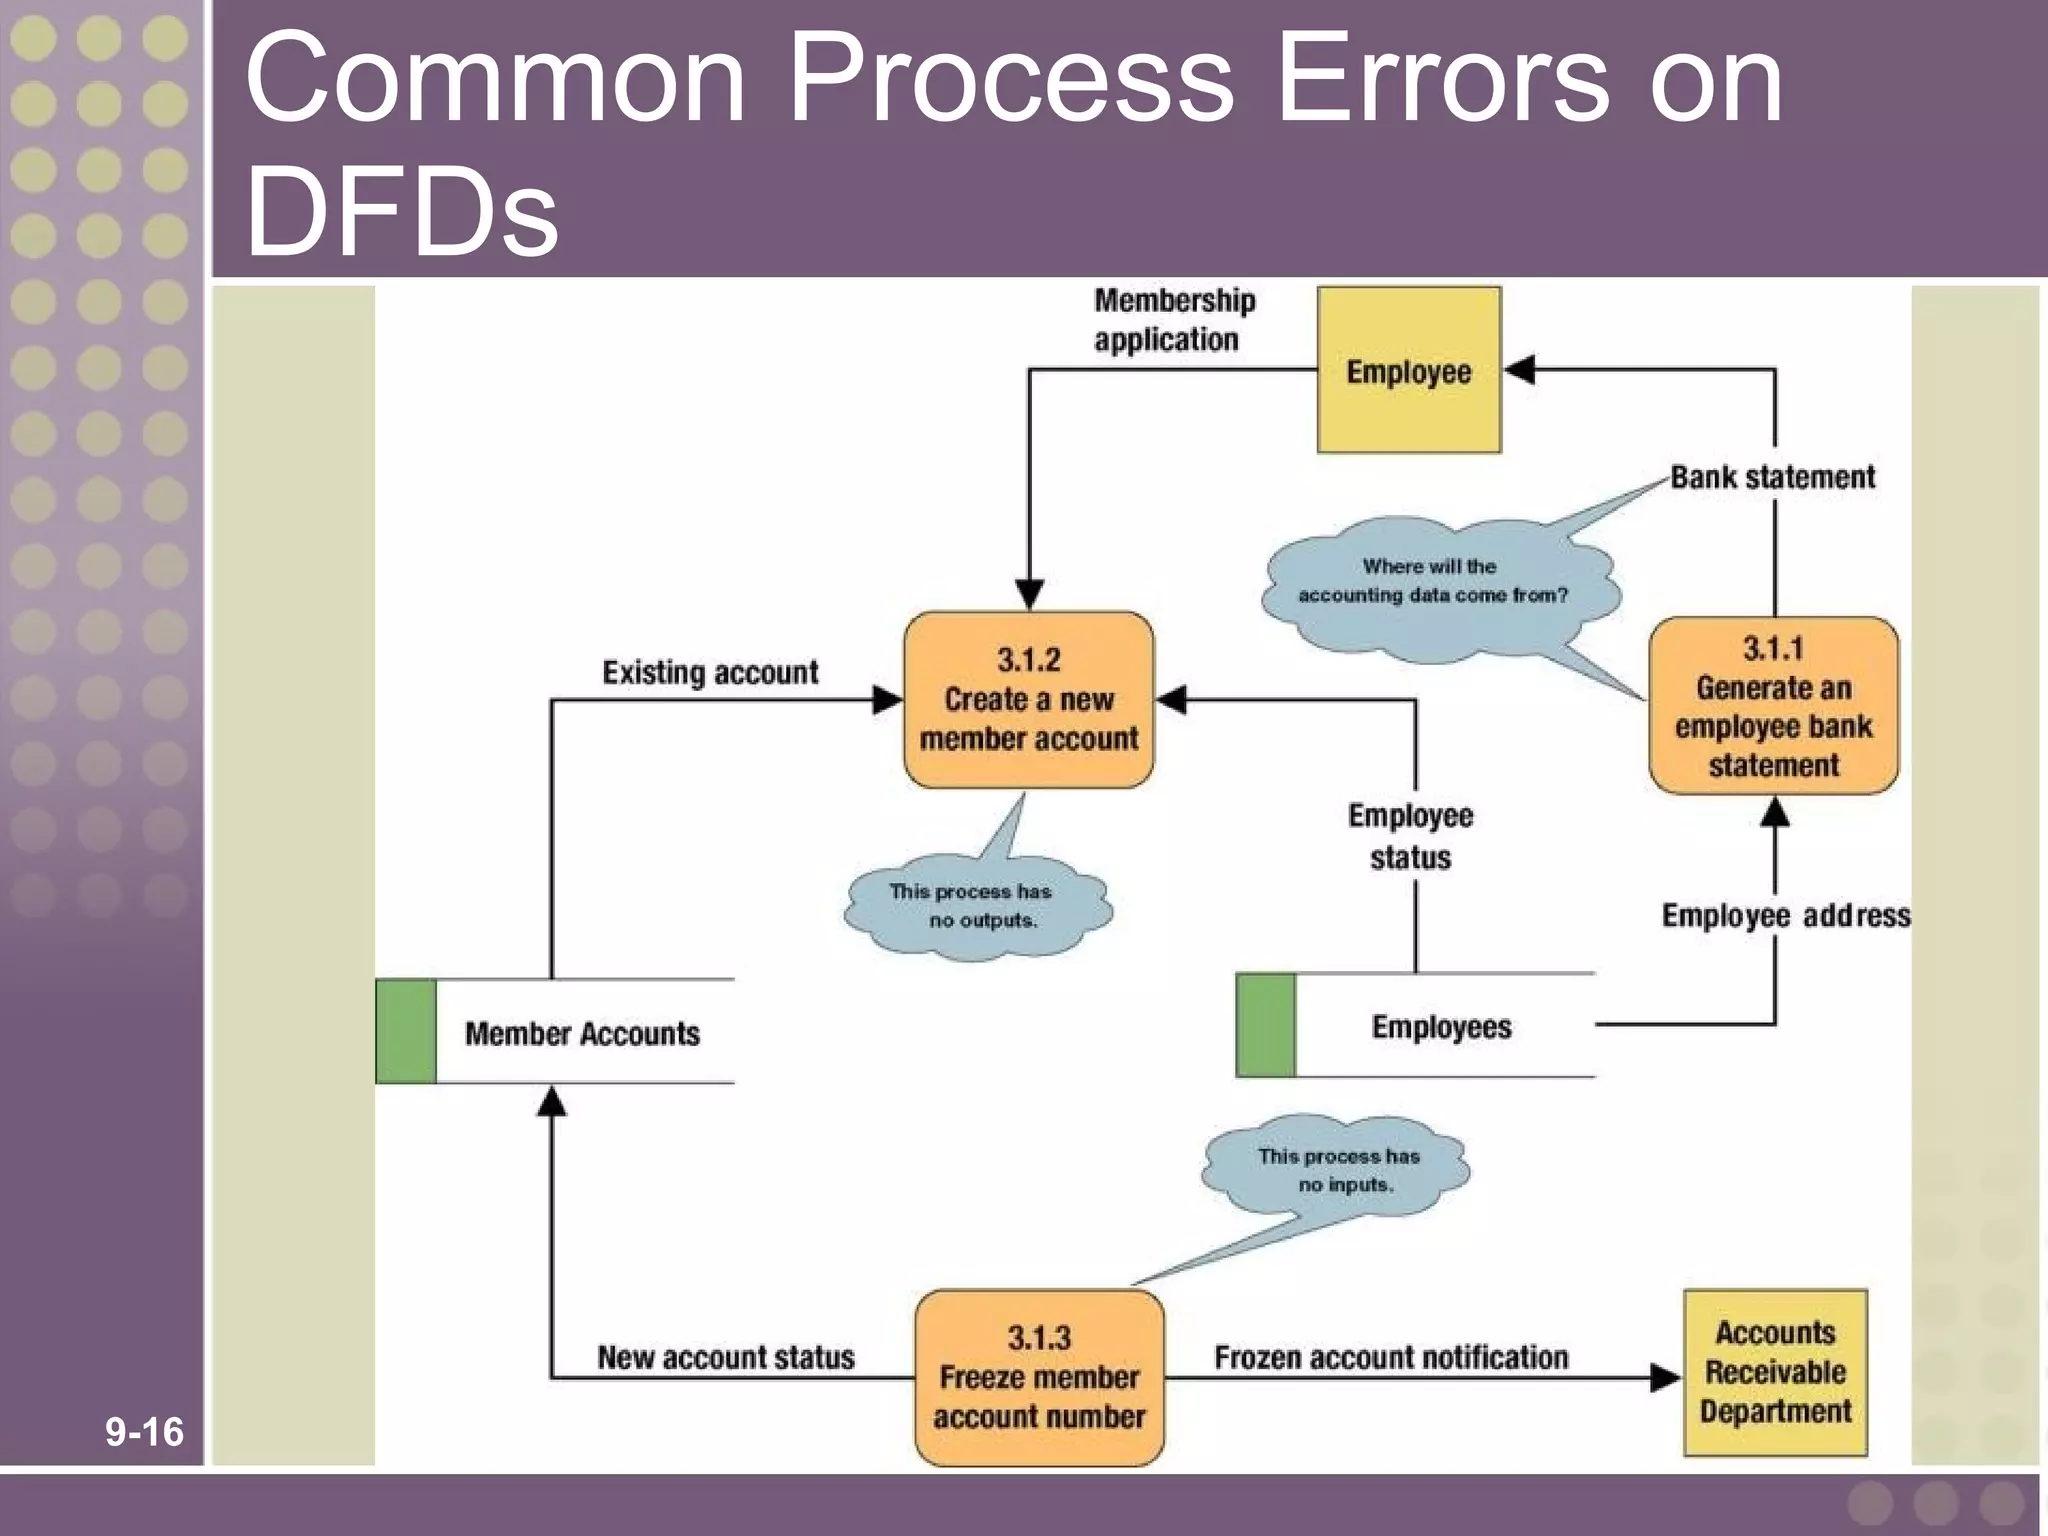
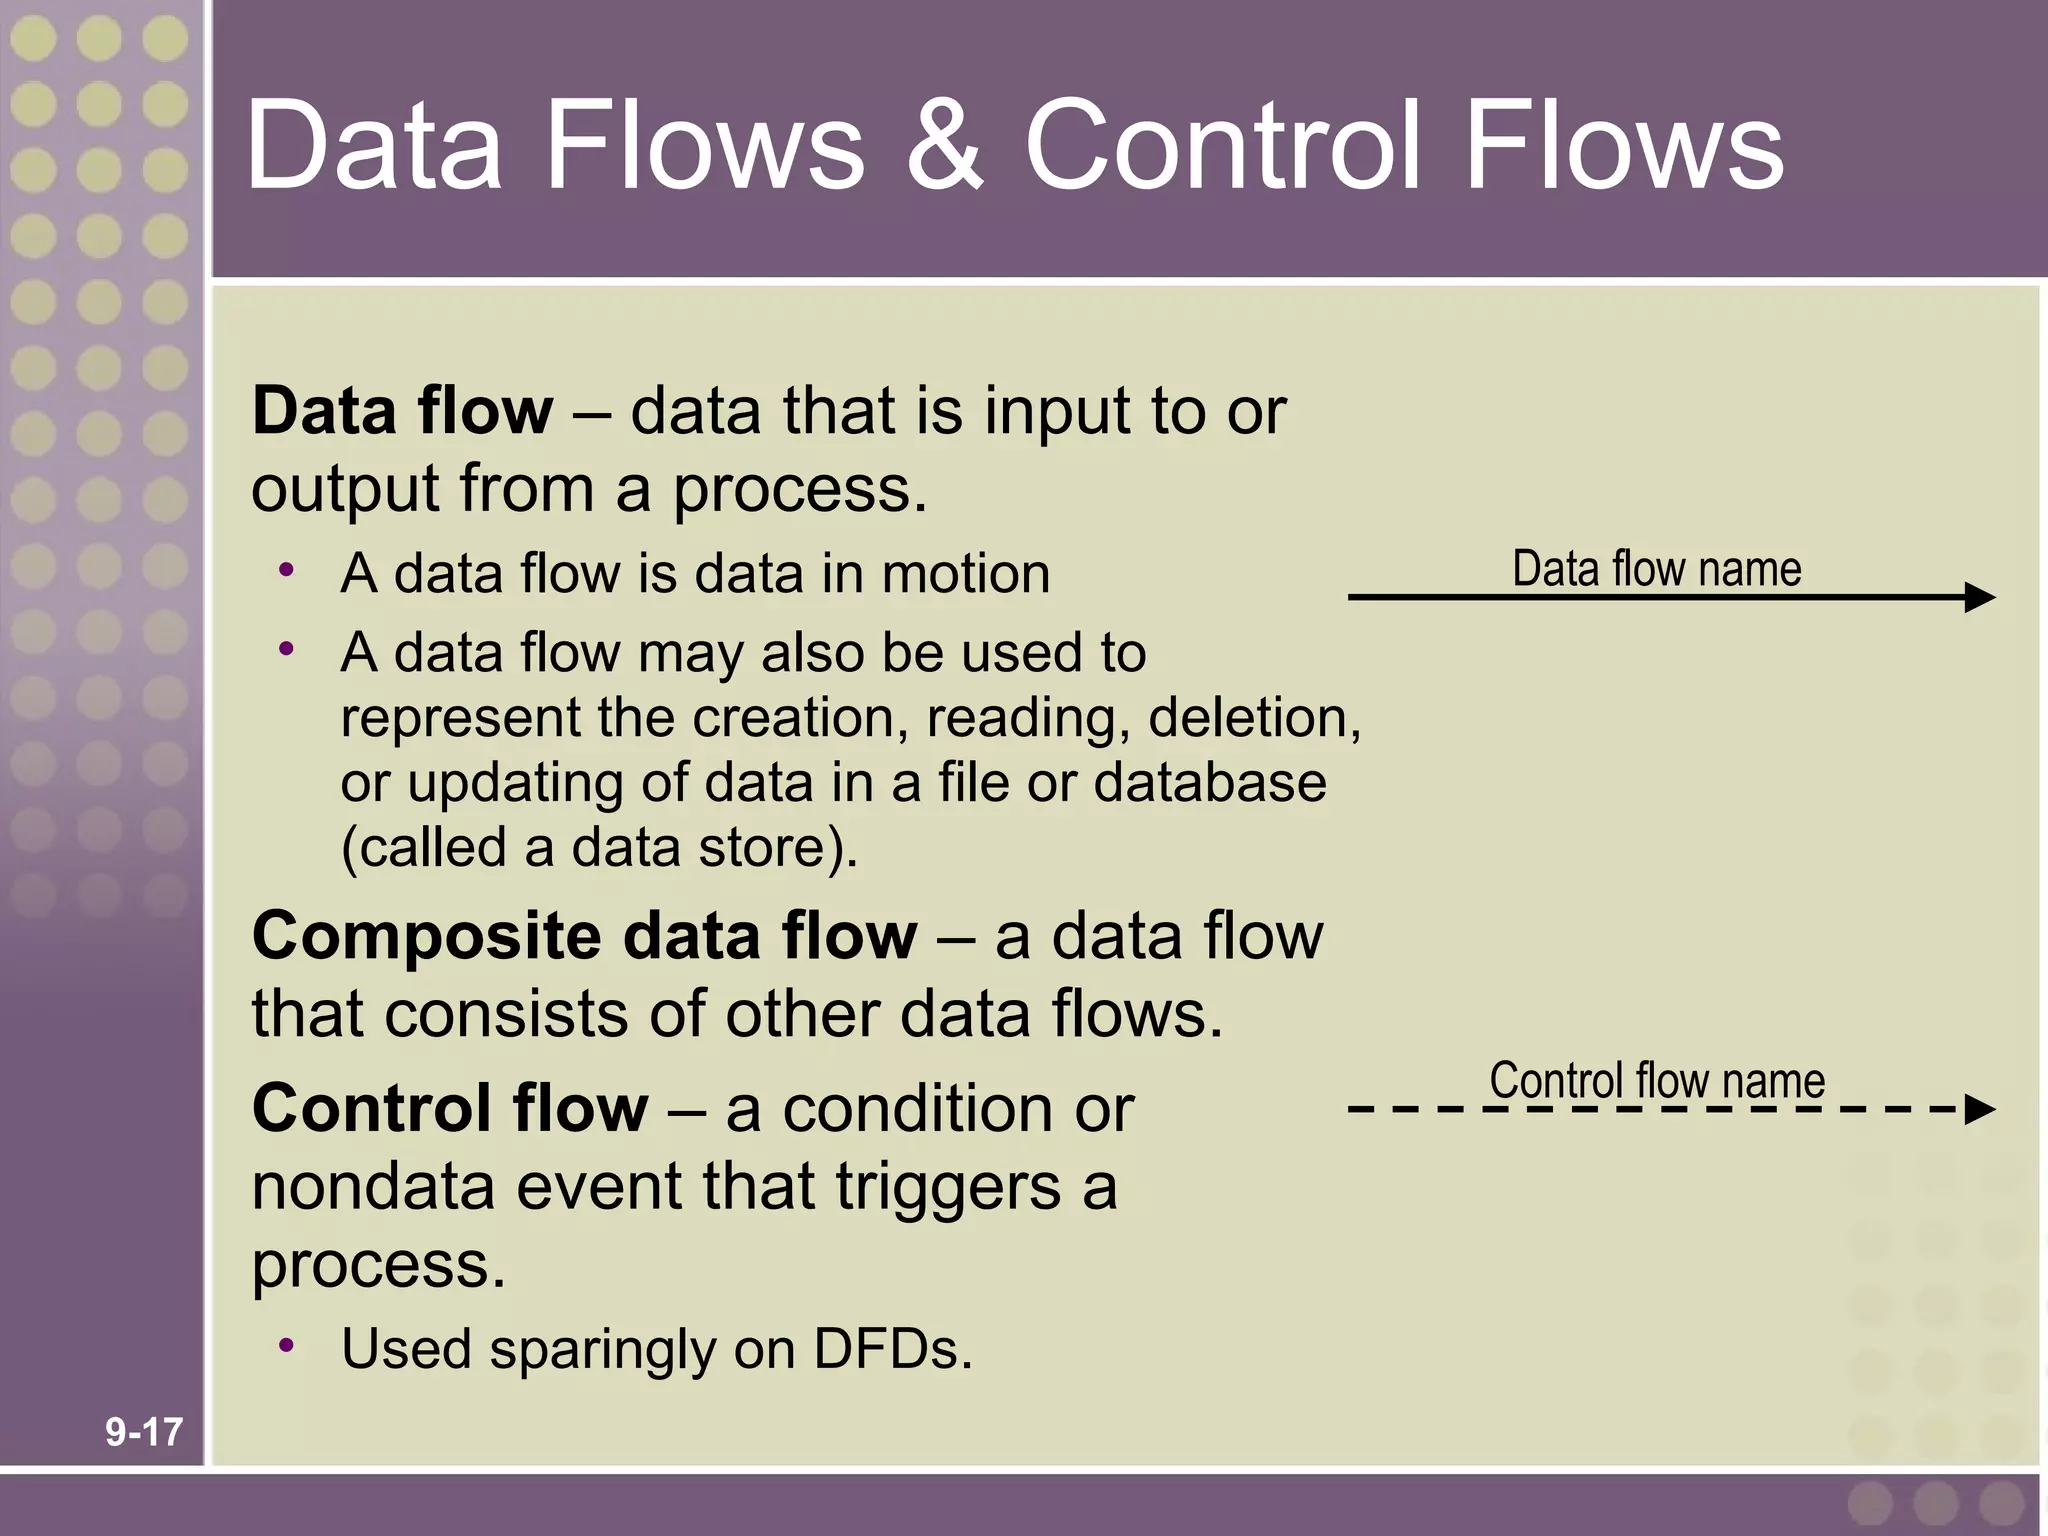
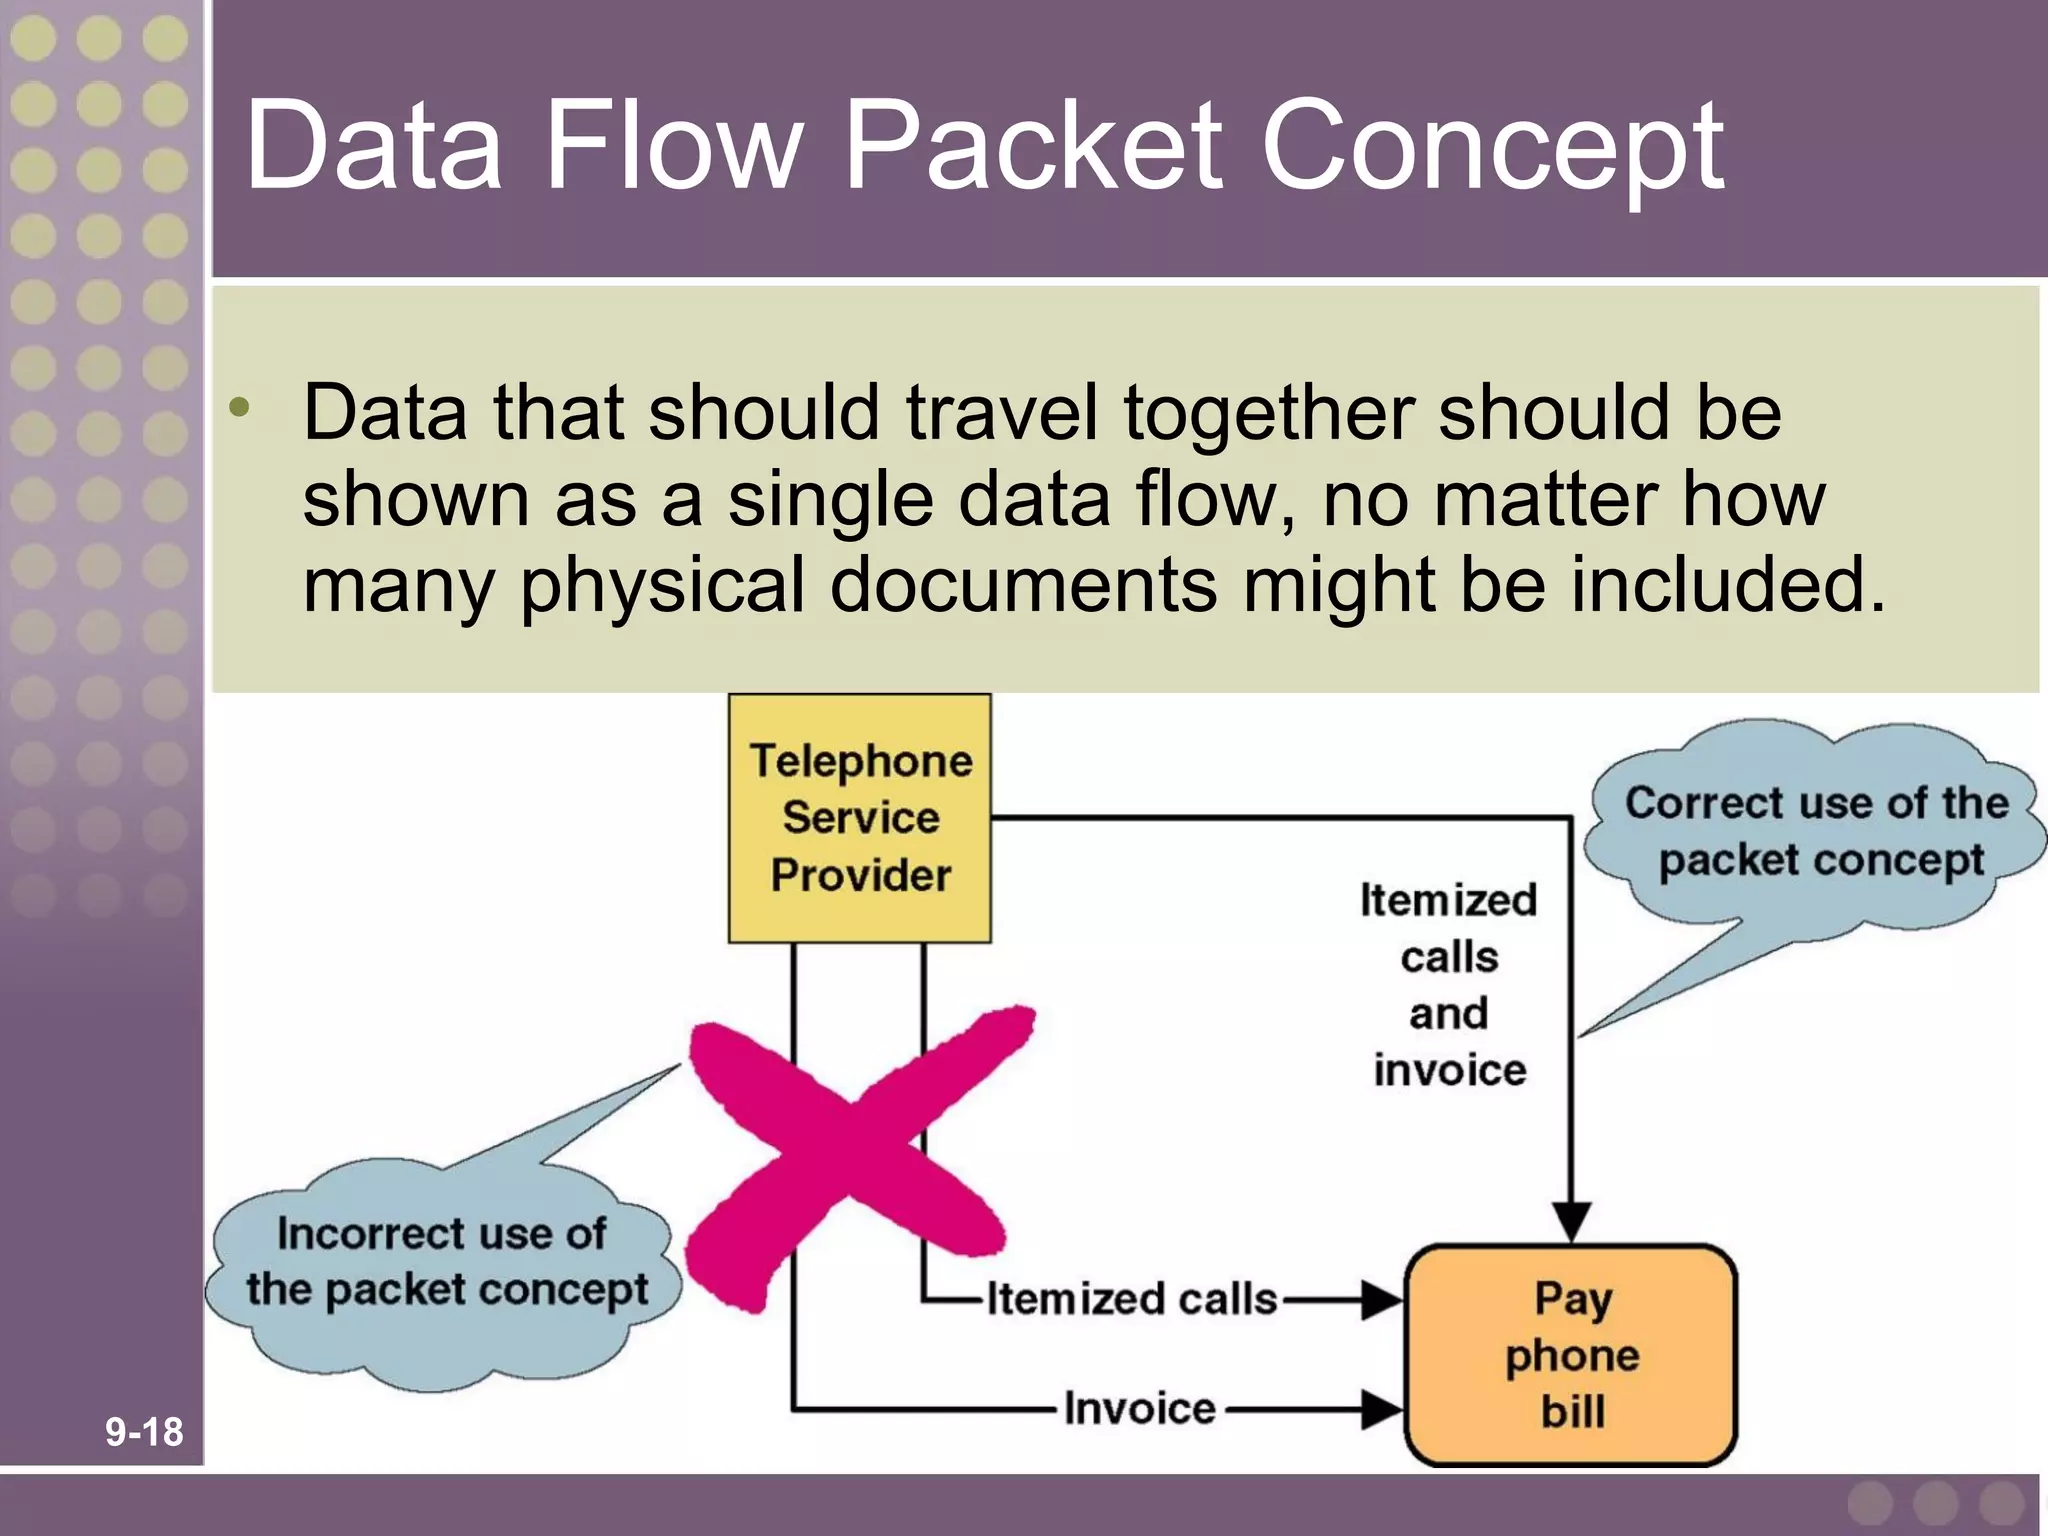
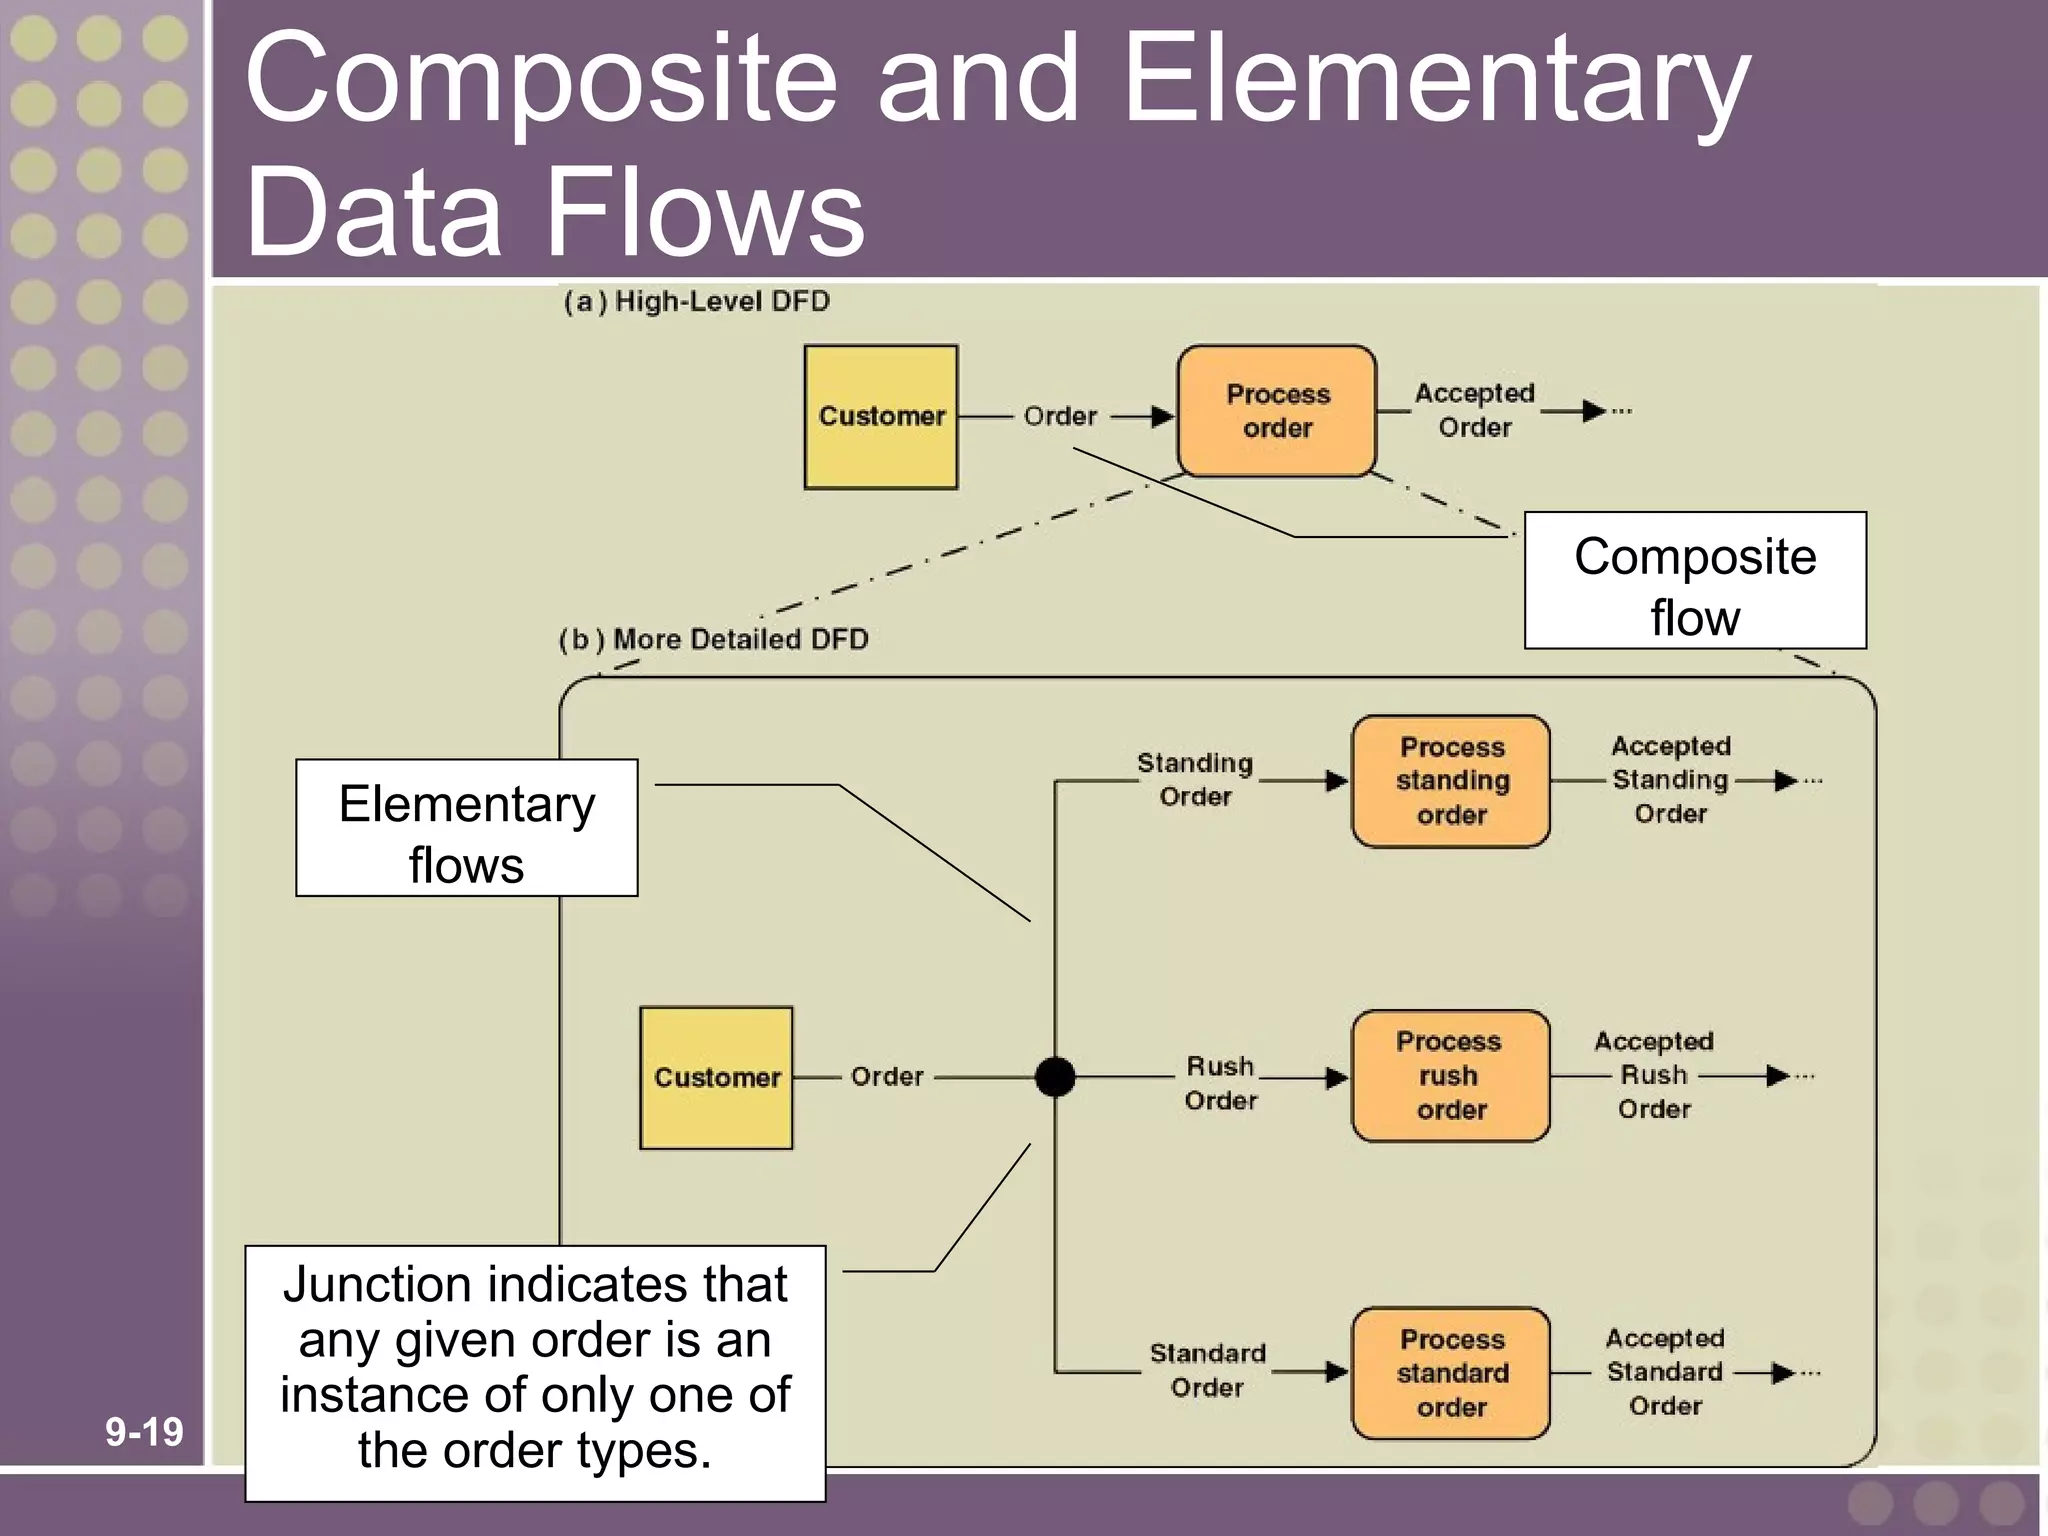
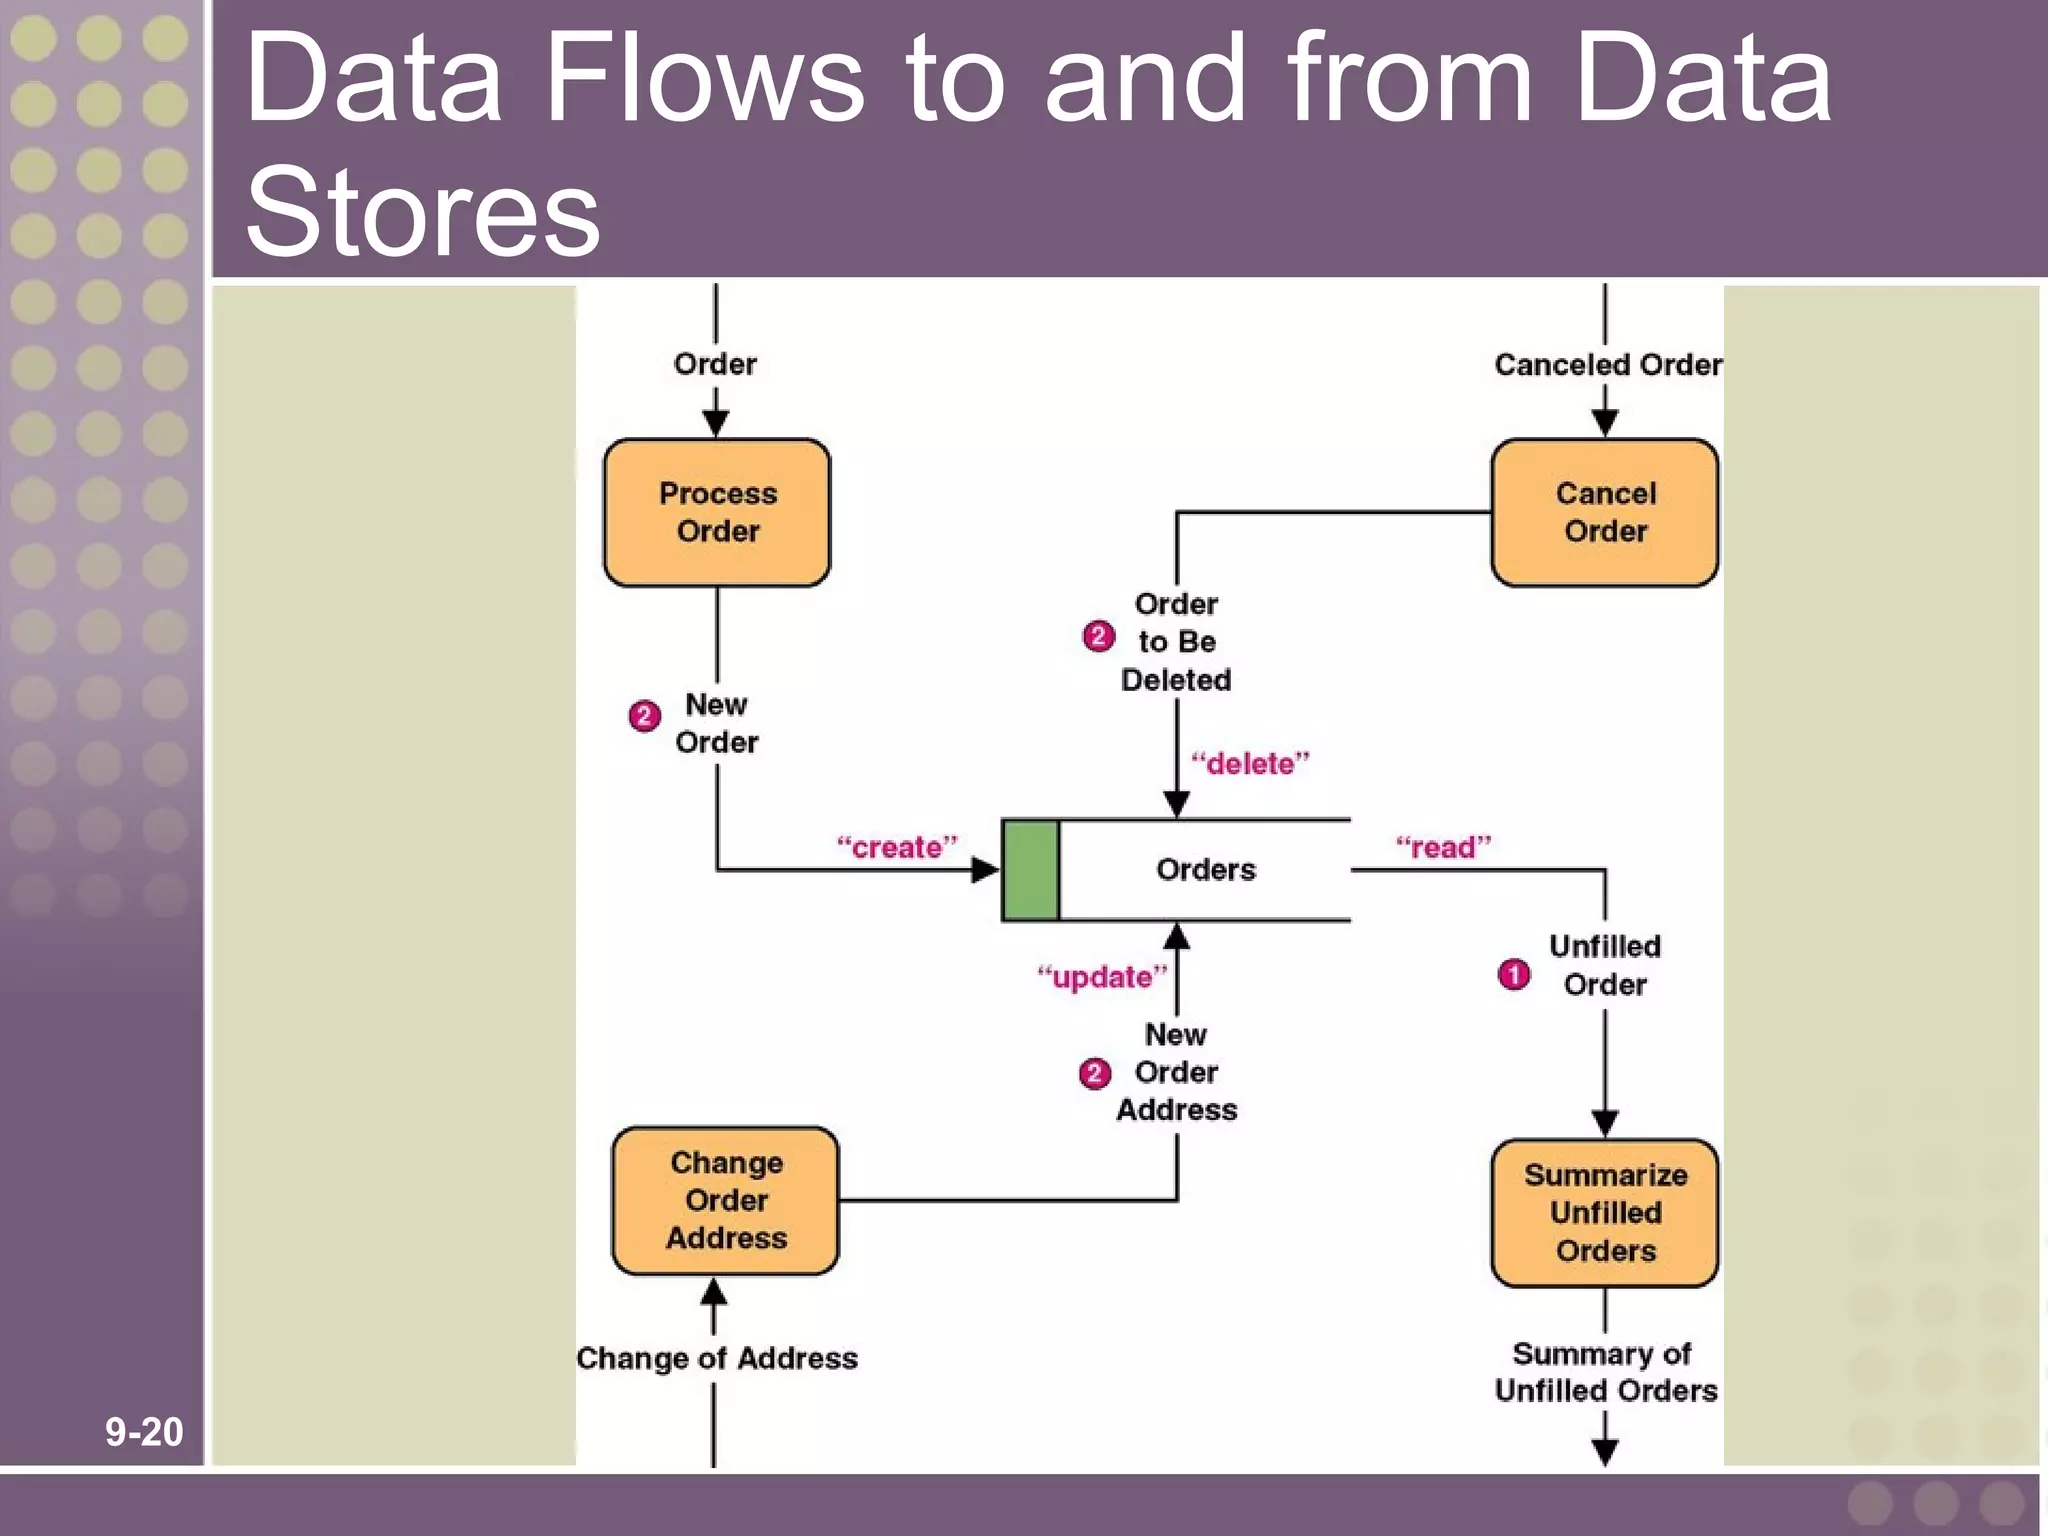
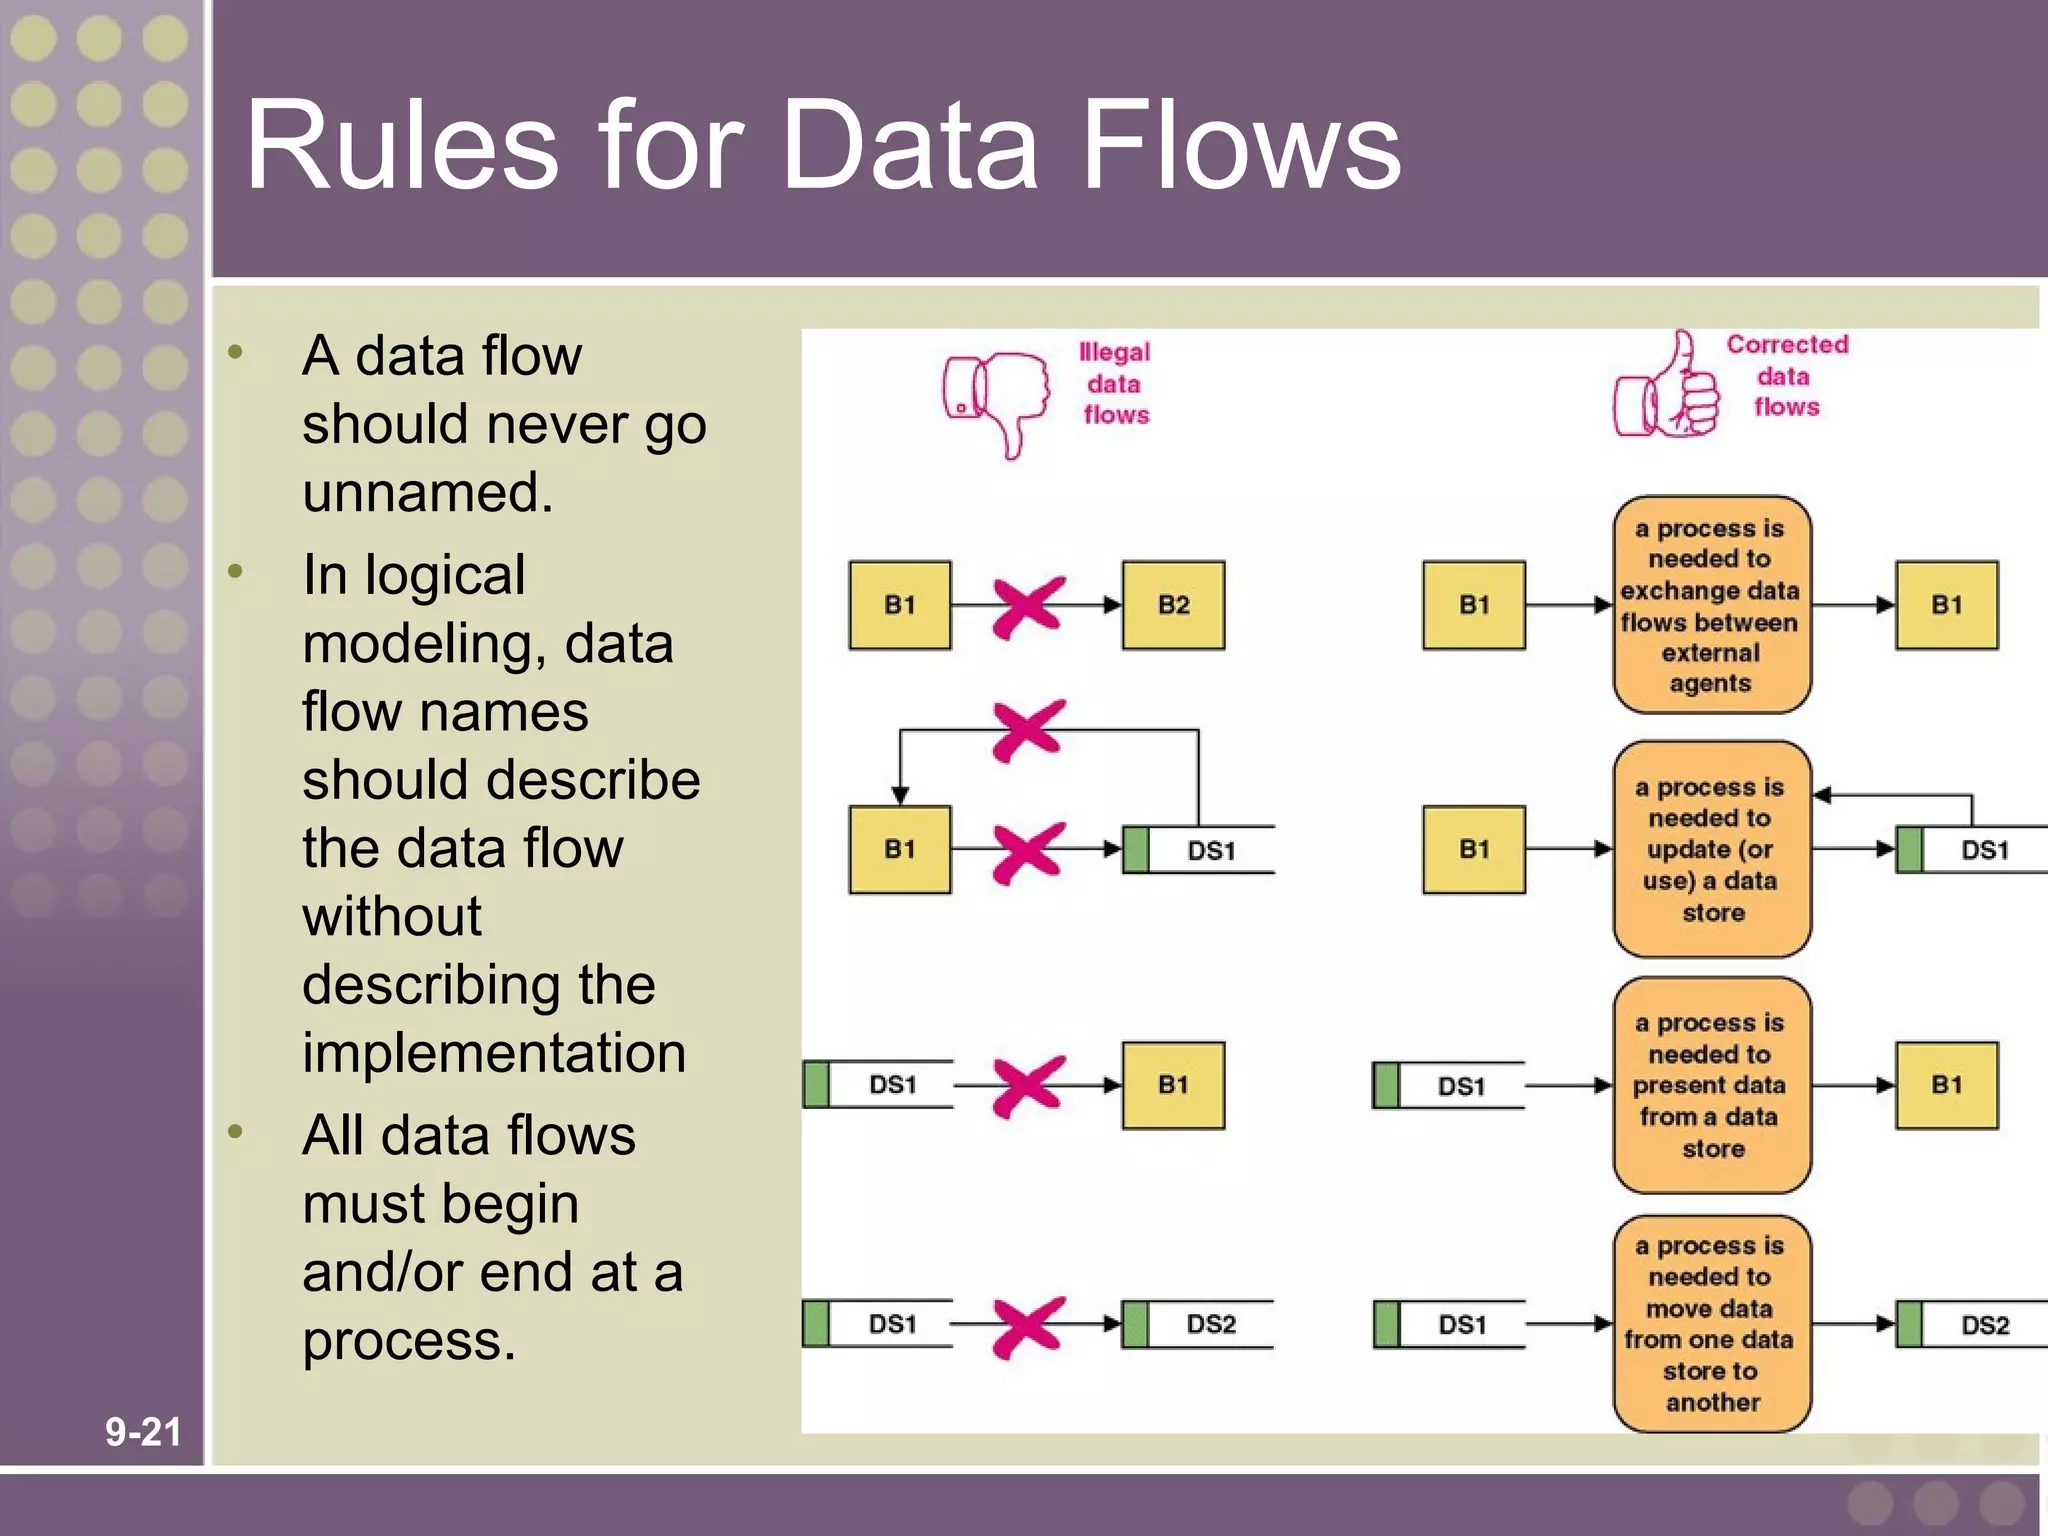
This document discusses process modeling and data flow diagrams (DFDs). It defines key concepts in process modeling like logical and physical models, processes, data flows, and data stores. It explains how to construct DFDs and the basic elements that make them up, including external entities, processes, and data flows between processes and data stores. The document provides guidance on decomposing processes, identifying different types of processes, and describing the data structures that make up data flows.
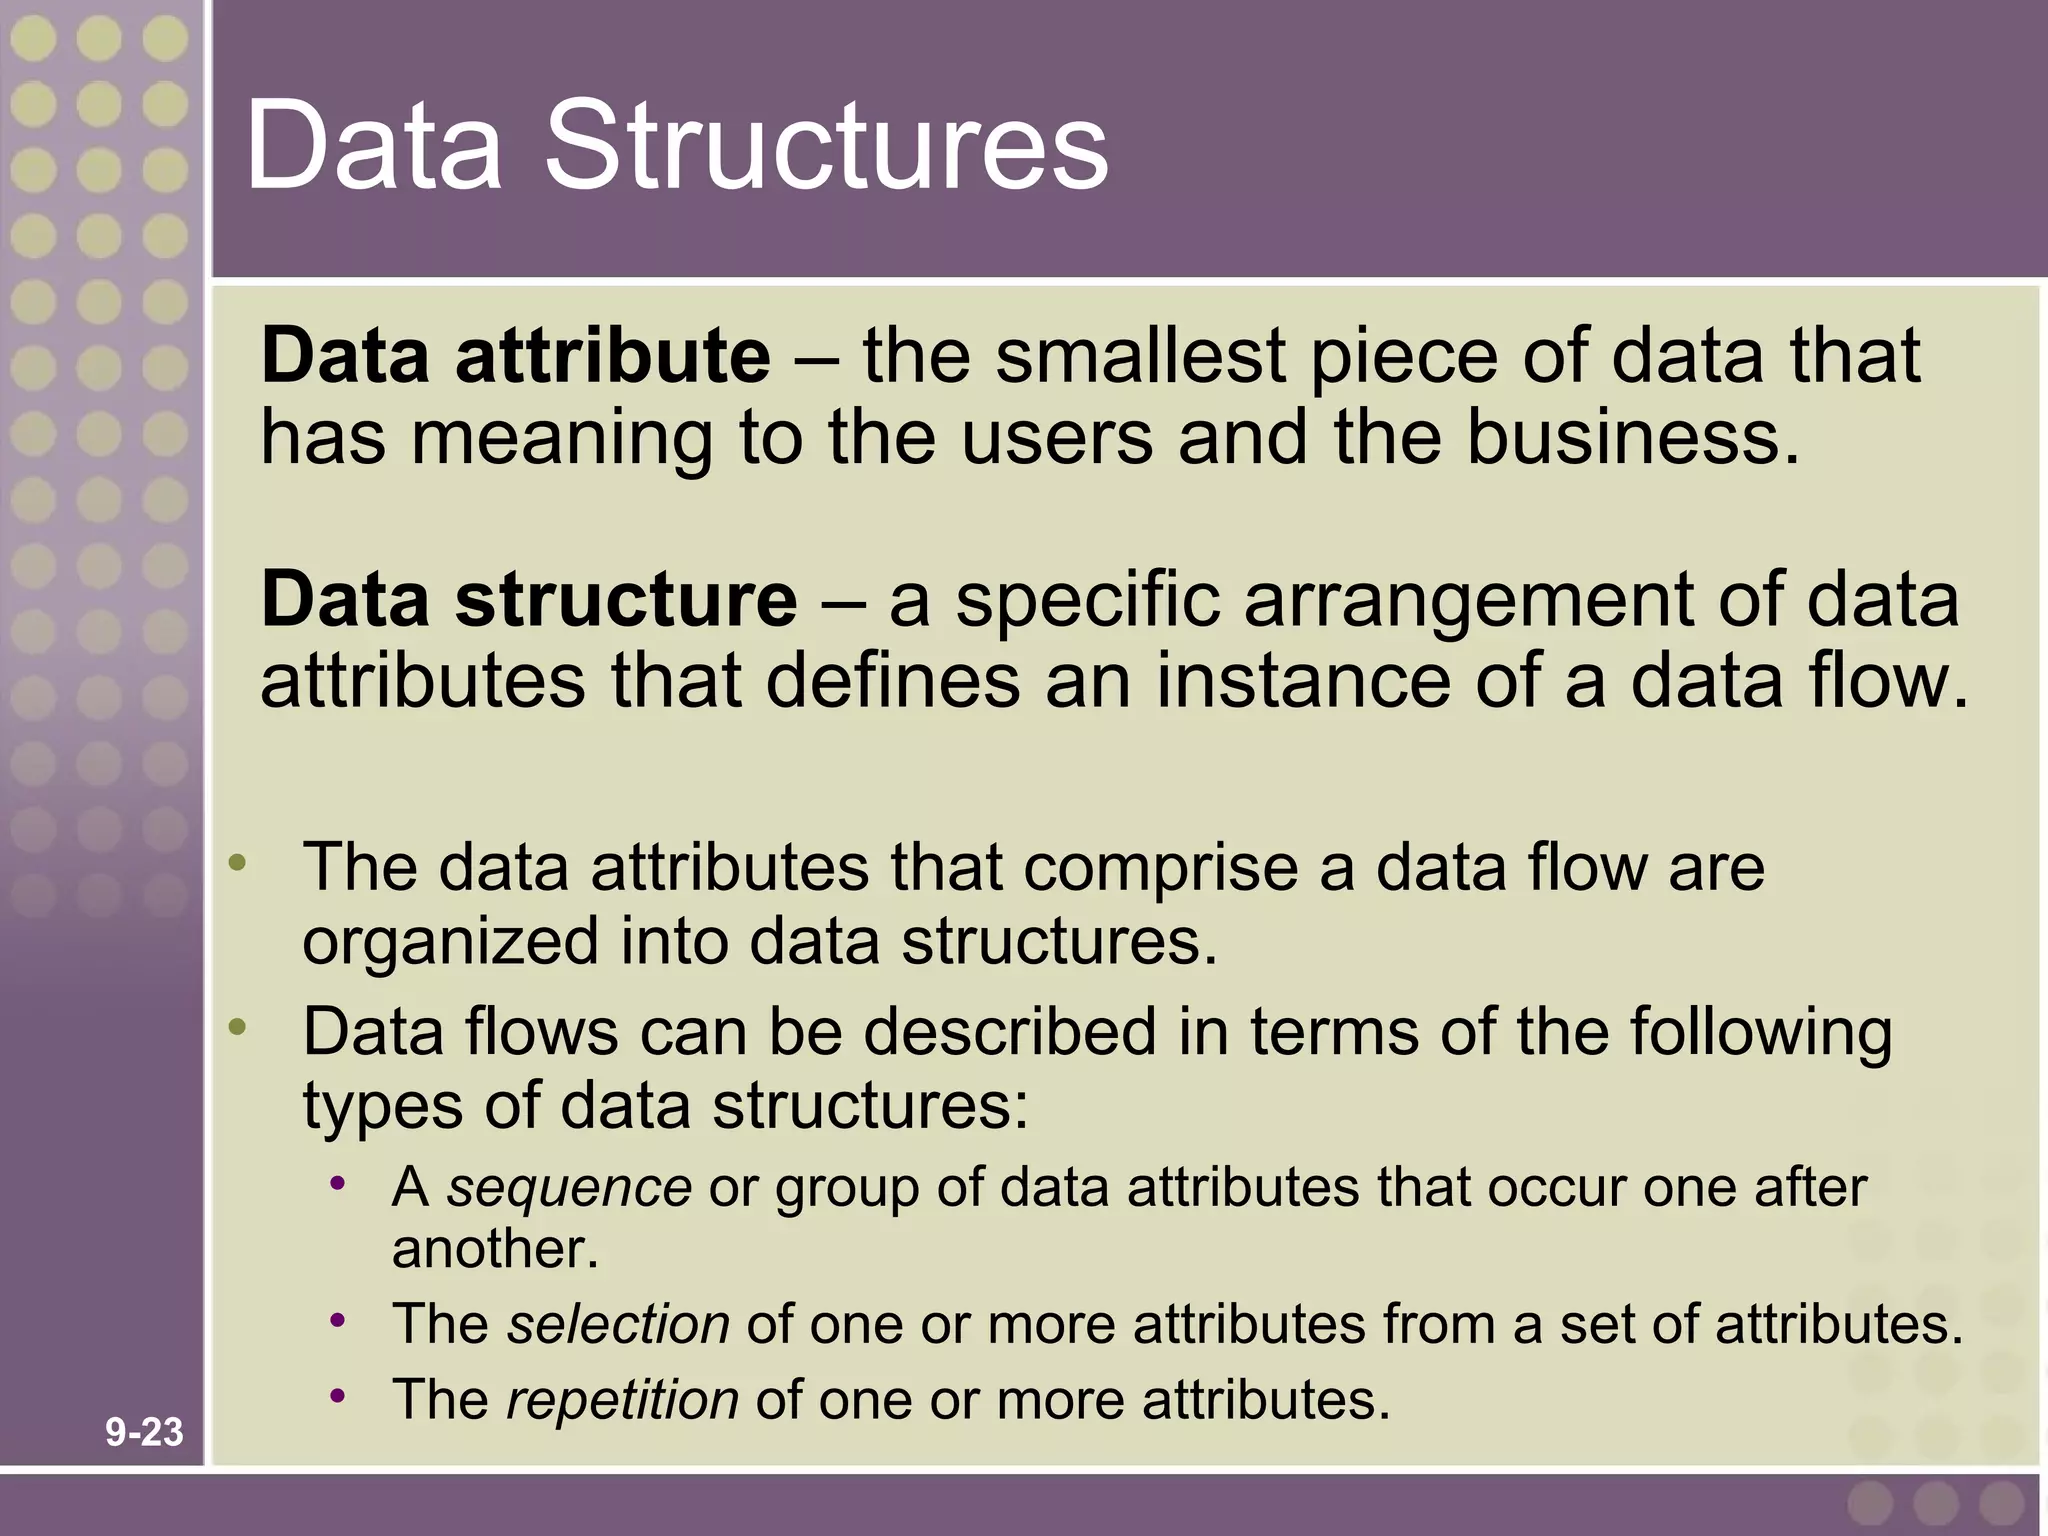
![Data Structure for a Data Flow
DATA STRUCTURE ENGLISH ENTERPRETATION
ORDER= An instance of ORDER consists of:
ORDER NUMBER + ORDER NUMBER and
ORDER DATE and
ORDER DATE+ Either PERSONAL CUSTOMER NUMBER
[ PERSONAL CUSTOMER NUMBER, or CORPORATE ACCOUNT
CORPORATE ACCOUNT NUMBER] NUMBER
+ and SHIPPING ADDRESS (which is
SHIPPING ADDRESS=ADDRESS+ equivalent to ADDRESS)
(BILLING ADDRESS=ADDRESS)+ and optionally: BILLING ADDRESS
1 {PRODUCT NUMBER+ (which is equivalent to
ADDRESS)
PRODUCT DESCRIPTION+ and one or more instances of:
QUANTITY ORDERED+ PRODUCT NUMBER and
PRODUCT PRICE+ PRODUCT DESCRIPTION and
PRODUCT PRICE SOURCE+ QUANTITY ORDERED and
EXTENDED PRICE } N+ PRODUCT PRICE and
SUM OF EXTENDED PRICES+ PRODUCT PRICE SOURCE and
PREPAID AMOUNT+ EXTENDED PRICE
and SUM OF EXTENDED PRICES and
(CREDIT CARD PREPAID AMOUNT and
NUMBER+EXPIRATION DATE) optionally: both CREDIT CARD NUMBER
(QUOTE NUMBER) and EXPIRATION DATE
ADDRESS= An instance of ADDRESS consists of:
(POST OFFICE BOX NUMBER)+ optionally: POST OFFICE BOX NUMBER
STREET ADDRESS+ and
STREET ADDRESS and
CITY+ CITY and
[STATE, MUNICIPALITY]+ Either STATE or MUNICIPALITY
(COUNTRY)+ and optionally: COUNTRY
9-24 POSTAL CODE and POSTAL CODE](https://image.slidesharecdn.com/chap09-120515161424-phpapp01/75/Chap09-24-2048.jpg)