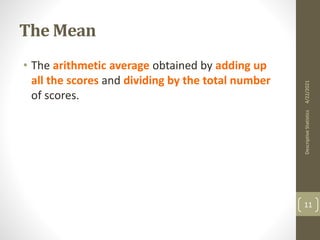
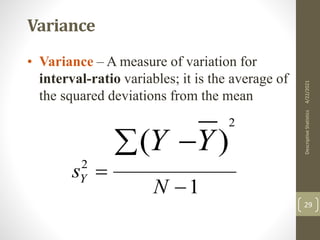
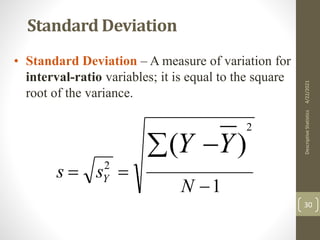
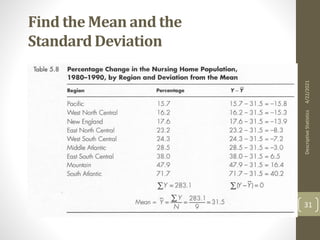
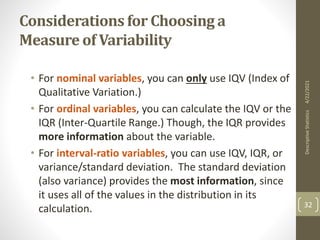
Descriptive Statistics
Maria Sharif
Biostatistician
Department of public health
Outline
• Definition of Descriptive Statistics
• Measures of Central Tendency
• Mean
• Median
• Mode
• Measures of Dispersion
• The Range
• IQR (Inter-Quartile Range)
• Variance
• Standard Deviation
• Introduction to Normal Distribution
4/22/2021
Descriptive
Statistics
2
MEASURES OF CENTRAL
TENDENCY
3
4/22/2021
Descriptive
Statistics
What is a measure of Central
Tendency?
• Numbers that describe what is average or
typical of the distribution
• You can think of this value as where the
middle of a distribution lies.
4/22/2021
Descriptive
Statistics
4
The Mode
• The category or score with the largest
frequency (or percentage) in the
distribution.
• The mode can be calculated for variables
with levels of measurement that are:
nominal, ordinal, or discrete quantitative.
4/22/2021
Descriptive
Statistics
5
The Mode: An Example
• Example: Number of Votes for Candidates for
Mayor. The mode, in this case, gives you the
“central” response of the voters: the most
popular candidate.
Candidate A – 11,769 votes The Mode:
Candidate B – 39,443 votes “Candidate C”
Candidate C – 78,331 votes
4/22/2021
Descriptive
Statistics
6
The Median
• The score that divides the distribution into two
equal parts, so that half the cases are above it
and half below it.
• The median is the middle score, or average of
middle scores in a distribution.
4/22/2021
Descriptive
Statistics
7
Median Exercise #1 (N is odd)
Calculate the median for this hypothetical
distribution:
Job Satisfaction Frequency
Very High 2
High 3
Moderate 5
Low 7
Very Low 4
TOTAL 21
4/22/2021
Descriptive
Statistics
8
Median Exercise #2 (N is even)
Calculate the median for this hypothetical
distribution:
Satisfaction with Health Frequency
Very High 5
High 7
Moderate 6
Low 7
Very Low 3
TOTAL 28
4/22/2021
Descriptive
Statistics
9
Finding the Median in
Grouped Data
w
f
Cf
N
L
Median 



)
5
(.
4/22/2021
Descriptive
Statistics
10
The Mean
• The arithmetic average obtained by adding up
all the scores and dividing by the total number
of scores.
4/22/2021
Descriptive
Statistics
11
4/22/2021
Descriptive
Statistics
12
Formula for the Mean
N
Y
Y


“Y bar” equals the sum of all the scores, Y, divided by the
number of scores, N.
4/22/2021
Descriptive
Statistics
13
Calculating the mean with grouped
scores
where: f Y = a score multiplied by its frequency
N
Y
f
Y


4/22/2021
Descriptive
Statistics
14
Mean: Grouped Scores
4/22/2021
Descriptive
Statistics
15
Mean: Grouped Scores
4/22/2021
Descriptive
Statistics
16
4/22/2021
Descriptive
Statistics
17
Grouped Data: the Mean &
Median
Number of People Age 18 or older living in a U.S. Household in
1996 (GSS 1996)
Number of People Frequency
1 190
2 316
3 54
4 17
5 2
6 2
TOTAL 581
Calculate the median and mean for the grouped
frequency below.
4/22/2021
Descriptive
Statistics
18
Shape of the Distribution
• Symmetrical (mean is about equal to
median)
• Skewed
• Negatively (example: years of education)
mean < median
• Positively (example: income)
mean > median
• Bimodal (two distinct modes)
• Multi-modal (more than 2 distinct modes)
4/22/2021
Descriptive
Statistics
19
Distribution Shape
4/22/2021
Descriptive
Statistics
20
Considerations for Choosing a
Measure of Central Tendency
• For a nominal variable, the mode is the only
measure that can be used.
• For ordinal variables, the mode and the median
may be used. The median provides more
information (taking into account the ranking of
categories.)
• For interval-ratio variables, the mode, median,
and mean may all be calculated. The mean
provides the most information about the
distribution, but the median is preferred if the
distribution is skewed.
4/22/2021
Descriptive
Statistics
21
Central Tendency
4/22/2021
Descriptive
Statistics
22
MEASURES OF VARIABILITY
4/22/2021
Descriptive
Statistics
23
The Importance of
Measuring Variability
• Central tendency - Numbers that describe what is typical or
average (central) in a distribution
• Measures of Variability - Numbers that describe diversity or
variability in the distribution.
These two types of measures together help us to sum up a
distribution of scores without looking at each and every
score. Measures of central tendency tell you about typical
(or central) scores. Measures of variation reveal how far
from the typical or central score that the distribution tends
to vary.
4/22/2021
Descriptive
Statistics
24
Notice that both distributions have the same mean,
yet they are shaped differently
4/22/2021
Descriptive
Statistics
25
The Range
Range = highest score - lowest score
• Range – A measure of variation in interval-ratio
variables. It is the difference between the
highest (maximum) and the lowest (minimum)
scores in the distribution.
4/22/2021
Descriptive
Statistics
26
Inter-Quartile Range
• Inter-Quartile Range (IQR) – A measure of
variation for interval-ratio data. It indicates the
width of the middle 50 percent of the
distribution and is defined as the difference
between the lower and upper quartiles (Q1 and
Q3.)
• IQR = Q3 – Q1
4/22/2021
Descriptive
Statistics
27
The difference between the
Range and IQR
Shows greater
variability
These values
fall together
closely
Yet the ranges are
equal!
Importance of the
IQR
4/22/2021
Descriptive
Statistics
28
Variance
• Variance – A measure of variation for
interval-ratio variables; it is the average of
the squared deviations from the mean
1
)
(
2
2


 
N
s
Y
Y
Y
4/22/2021
Descriptive
Statistics
29
Standard Deviation
• Standard Deviation – A measure of variation for
interval-ratio variables; it is equal to the square
root of the variance.
1
)
(
2
2



 
N
s
s
Y
Y
Y
4/22/2021
Descriptive
Statistics
30
Find the Mean and the
Standard Deviation
4/22/2021
Descriptive
Statistics
31
Considerations for Choosing a
Measure of Variability
• For nominal variables, you can only use IQV (Index of
Qualitative Variation.)
• For ordinal variables, you can calculate the IQV or the
IQR (Inter-Quartile Range.) Though, the IQR provides
more information about the variable.
• For interval-ratio variables, you can use IQV, IQR, or
variance/standard deviation. The standard deviation
(also variance) provides the most information, since
it uses all of the values in the distribution in its
calculation.
4/22/2021
Descriptive
Statistics
32
NORMAL DISTRIBUTION
(INTRODUCTION)
4/22/2021
Descriptive
Statistics
33
Normal Distribution
Why are normal distributions so important?
• Many dependent variables are commonly
assumed to be normally distributed in the
population
• If a variable is approximately normally
distributed we can make inferences about values
of that variable
• Example: Sampling distribution of the mean
4/22/2021
Descriptive
Statistics
34
Normal Distribution
• Symmetrical, bell-shaped curve
• Also known as Gaussian distribution
• Point of inflection = 1 standard deviation from
mean
• Mathematical formula
f(X) 
1
 2
(e)

(X )2
2 2
4/22/2021
Descriptive
Statistics
35
• Since we know the shape of the curve, we can
calculate the area under the curve
• The percentage of that area can be used to
determine the probability that a given value
could be pulled from a given distribution
• The area under the curve tells us about the
probability- in other words we can obtain a p-value for
our result (data) by treating it as a normally distributed
data set.
4/22/2021
Descriptive
Statistics
36
Key Areas under the Curve
• For normal distributions
+ 1 SD ~ 68%
+ 2 SD ~ 95%
+ 3 SD ~ 99.9%
4/22/2021 Descriptive Statistics 37
Example IQ mean = 100 s = 15
4/22/2021
Descriptive
Statistics
38
Normal Probability
Distributions
StandardNormalDistribution–N(0,1)
• We agree to use the
standard normal
distribution
• Bell shaped
• =0
• =1
• Note: not all bell
shaped distributions are
normal distributions
4/22/2021 Descriptive Statistics 39
Normal Probability
Distribution
• Can take on an infinite
number of possible
values.
• The probability of any
one of those values
occurring is essentially
zero.
• Curve has area or
probability = 1
4/22/2021 Descriptive Statistics 40
What you have learned today
1. Calculate the mean, median, mode
2. Calculate standard deviation, variance, IQR
3. Know when to use each
4. Understand what normal distribution is
4/22/2021
Descriptive
Statistics
41
QUESTIONS?
4/22/2021
Descriptive
Statistics
42

2 descriptive statistics

  • 1.
  • 2.
    Outline • Definition ofDescriptive Statistics • Measures of Central Tendency • Mean • Median • Mode • Measures of Dispersion • The Range • IQR (Inter-Quartile Range) • Variance • Standard Deviation • Introduction to Normal Distribution 4/22/2021 Descriptive Statistics 2
  • 3.
  • 4.
    What is ameasure of Central Tendency? • Numbers that describe what is average or typical of the distribution • You can think of this value as where the middle of a distribution lies. 4/22/2021 Descriptive Statistics 4
  • 5.
    The Mode • Thecategory or score with the largest frequency (or percentage) in the distribution. • The mode can be calculated for variables with levels of measurement that are: nominal, ordinal, or discrete quantitative. 4/22/2021 Descriptive Statistics 5
  • 6.
    The Mode: AnExample • Example: Number of Votes for Candidates for Mayor. The mode, in this case, gives you the “central” response of the voters: the most popular candidate. Candidate A – 11,769 votes The Mode: Candidate B – 39,443 votes “Candidate C” Candidate C – 78,331 votes 4/22/2021 Descriptive Statistics 6
  • 7.
    The Median • Thescore that divides the distribution into two equal parts, so that half the cases are above it and half below it. • The median is the middle score, or average of middle scores in a distribution. 4/22/2021 Descriptive Statistics 7
  • 8.
    Median Exercise #1(N is odd) Calculate the median for this hypothetical distribution: Job Satisfaction Frequency Very High 2 High 3 Moderate 5 Low 7 Very Low 4 TOTAL 21 4/22/2021 Descriptive Statistics 8
  • 9.
    Median Exercise #2(N is even) Calculate the median for this hypothetical distribution: Satisfaction with Health Frequency Very High 5 High 7 Moderate 6 Low 7 Very Low 3 TOTAL 28 4/22/2021 Descriptive Statistics 9
  • 10.
    Finding the Medianin Grouped Data w f Cf N L Median     ) 5 (. 4/22/2021 Descriptive Statistics 10
  • 11.
    The Mean • Thearithmetic average obtained by adding up all the scores and dividing by the total number of scores. 4/22/2021 Descriptive Statistics 11
  • 12.
  • 13.
    Formula for theMean N Y Y   “Y bar” equals the sum of all the scores, Y, divided by the number of scores, N. 4/22/2021 Descriptive Statistics 13
  • 14.
    Calculating the meanwith grouped scores where: f Y = a score multiplied by its frequency N Y f Y   4/22/2021 Descriptive Statistics 14
  • 15.
  • 16.
  • 17.
  • 18.
    Grouped Data: theMean & Median Number of People Age 18 or older living in a U.S. Household in 1996 (GSS 1996) Number of People Frequency 1 190 2 316 3 54 4 17 5 2 6 2 TOTAL 581 Calculate the median and mean for the grouped frequency below. 4/22/2021 Descriptive Statistics 18
  • 19.
    Shape of theDistribution • Symmetrical (mean is about equal to median) • Skewed • Negatively (example: years of education) mean < median • Positively (example: income) mean > median • Bimodal (two distinct modes) • Multi-modal (more than 2 distinct modes) 4/22/2021 Descriptive Statistics 19
  • 20.
  • 21.
    Considerations for Choosinga Measure of Central Tendency • For a nominal variable, the mode is the only measure that can be used. • For ordinal variables, the mode and the median may be used. The median provides more information (taking into account the ranking of categories.) • For interval-ratio variables, the mode, median, and mean may all be calculated. The mean provides the most information about the distribution, but the median is preferred if the distribution is skewed. 4/22/2021 Descriptive Statistics 21
  • 22.
  • 23.
  • 24.
    The Importance of MeasuringVariability • Central tendency - Numbers that describe what is typical or average (central) in a distribution • Measures of Variability - Numbers that describe diversity or variability in the distribution. These two types of measures together help us to sum up a distribution of scores without looking at each and every score. Measures of central tendency tell you about typical (or central) scores. Measures of variation reveal how far from the typical or central score that the distribution tends to vary. 4/22/2021 Descriptive Statistics 24
  • 25.
    Notice that bothdistributions have the same mean, yet they are shaped differently 4/22/2021 Descriptive Statistics 25
  • 26.
    The Range Range =highest score - lowest score • Range – A measure of variation in interval-ratio variables. It is the difference between the highest (maximum) and the lowest (minimum) scores in the distribution. 4/22/2021 Descriptive Statistics 26
  • 27.
    Inter-Quartile Range • Inter-QuartileRange (IQR) – A measure of variation for interval-ratio data. It indicates the width of the middle 50 percent of the distribution and is defined as the difference between the lower and upper quartiles (Q1 and Q3.) • IQR = Q3 – Q1 4/22/2021 Descriptive Statistics 27
  • 28.
    The difference betweenthe Range and IQR Shows greater variability These values fall together closely Yet the ranges are equal! Importance of the IQR 4/22/2021 Descriptive Statistics 28
  • 29.
    Variance • Variance –A measure of variation for interval-ratio variables; it is the average of the squared deviations from the mean 1 ) ( 2 2     N s Y Y Y 4/22/2021 Descriptive Statistics 29
  • 30.
    Standard Deviation • StandardDeviation – A measure of variation for interval-ratio variables; it is equal to the square root of the variance. 1 ) ( 2 2      N s s Y Y Y 4/22/2021 Descriptive Statistics 30
  • 31.
    Find the Meanand the Standard Deviation 4/22/2021 Descriptive Statistics 31
  • 32.
    Considerations for Choosinga Measure of Variability • For nominal variables, you can only use IQV (Index of Qualitative Variation.) • For ordinal variables, you can calculate the IQV or the IQR (Inter-Quartile Range.) Though, the IQR provides more information about the variable. • For interval-ratio variables, you can use IQV, IQR, or variance/standard deviation. The standard deviation (also variance) provides the most information, since it uses all of the values in the distribution in its calculation. 4/22/2021 Descriptive Statistics 32
  • 33.
  • 34.
    Normal Distribution Why arenormal distributions so important? • Many dependent variables are commonly assumed to be normally distributed in the population • If a variable is approximately normally distributed we can make inferences about values of that variable • Example: Sampling distribution of the mean 4/22/2021 Descriptive Statistics 34
  • 35.
    Normal Distribution • Symmetrical,bell-shaped curve • Also known as Gaussian distribution • Point of inflection = 1 standard deviation from mean • Mathematical formula f(X)  1  2 (e)  (X )2 2 2 4/22/2021 Descriptive Statistics 35
  • 36.
    • Since weknow the shape of the curve, we can calculate the area under the curve • The percentage of that area can be used to determine the probability that a given value could be pulled from a given distribution • The area under the curve tells us about the probability- in other words we can obtain a p-value for our result (data) by treating it as a normally distributed data set. 4/22/2021 Descriptive Statistics 36
  • 37.
    Key Areas underthe Curve • For normal distributions + 1 SD ~ 68% + 2 SD ~ 95% + 3 SD ~ 99.9% 4/22/2021 Descriptive Statistics 37
  • 38.
    Example IQ mean= 100 s = 15 4/22/2021 Descriptive Statistics 38
  • 39.
    Normal Probability Distributions StandardNormalDistribution–N(0,1) • Weagree to use the standard normal distribution • Bell shaped • =0 • =1 • Note: not all bell shaped distributions are normal distributions 4/22/2021 Descriptive Statistics 39
  • 40.
    Normal Probability Distribution • Cantake on an infinite number of possible values. • The probability of any one of those values occurring is essentially zero. • Curve has area or probability = 1 4/22/2021 Descriptive Statistics 40
  • 41.
    What you havelearned today 1. Calculate the mean, median, mode 2. Calculate standard deviation, variance, IQR 3. Know when to use each 4. Understand what normal distribution is 4/22/2021 Descriptive Statistics 41
  • 42.