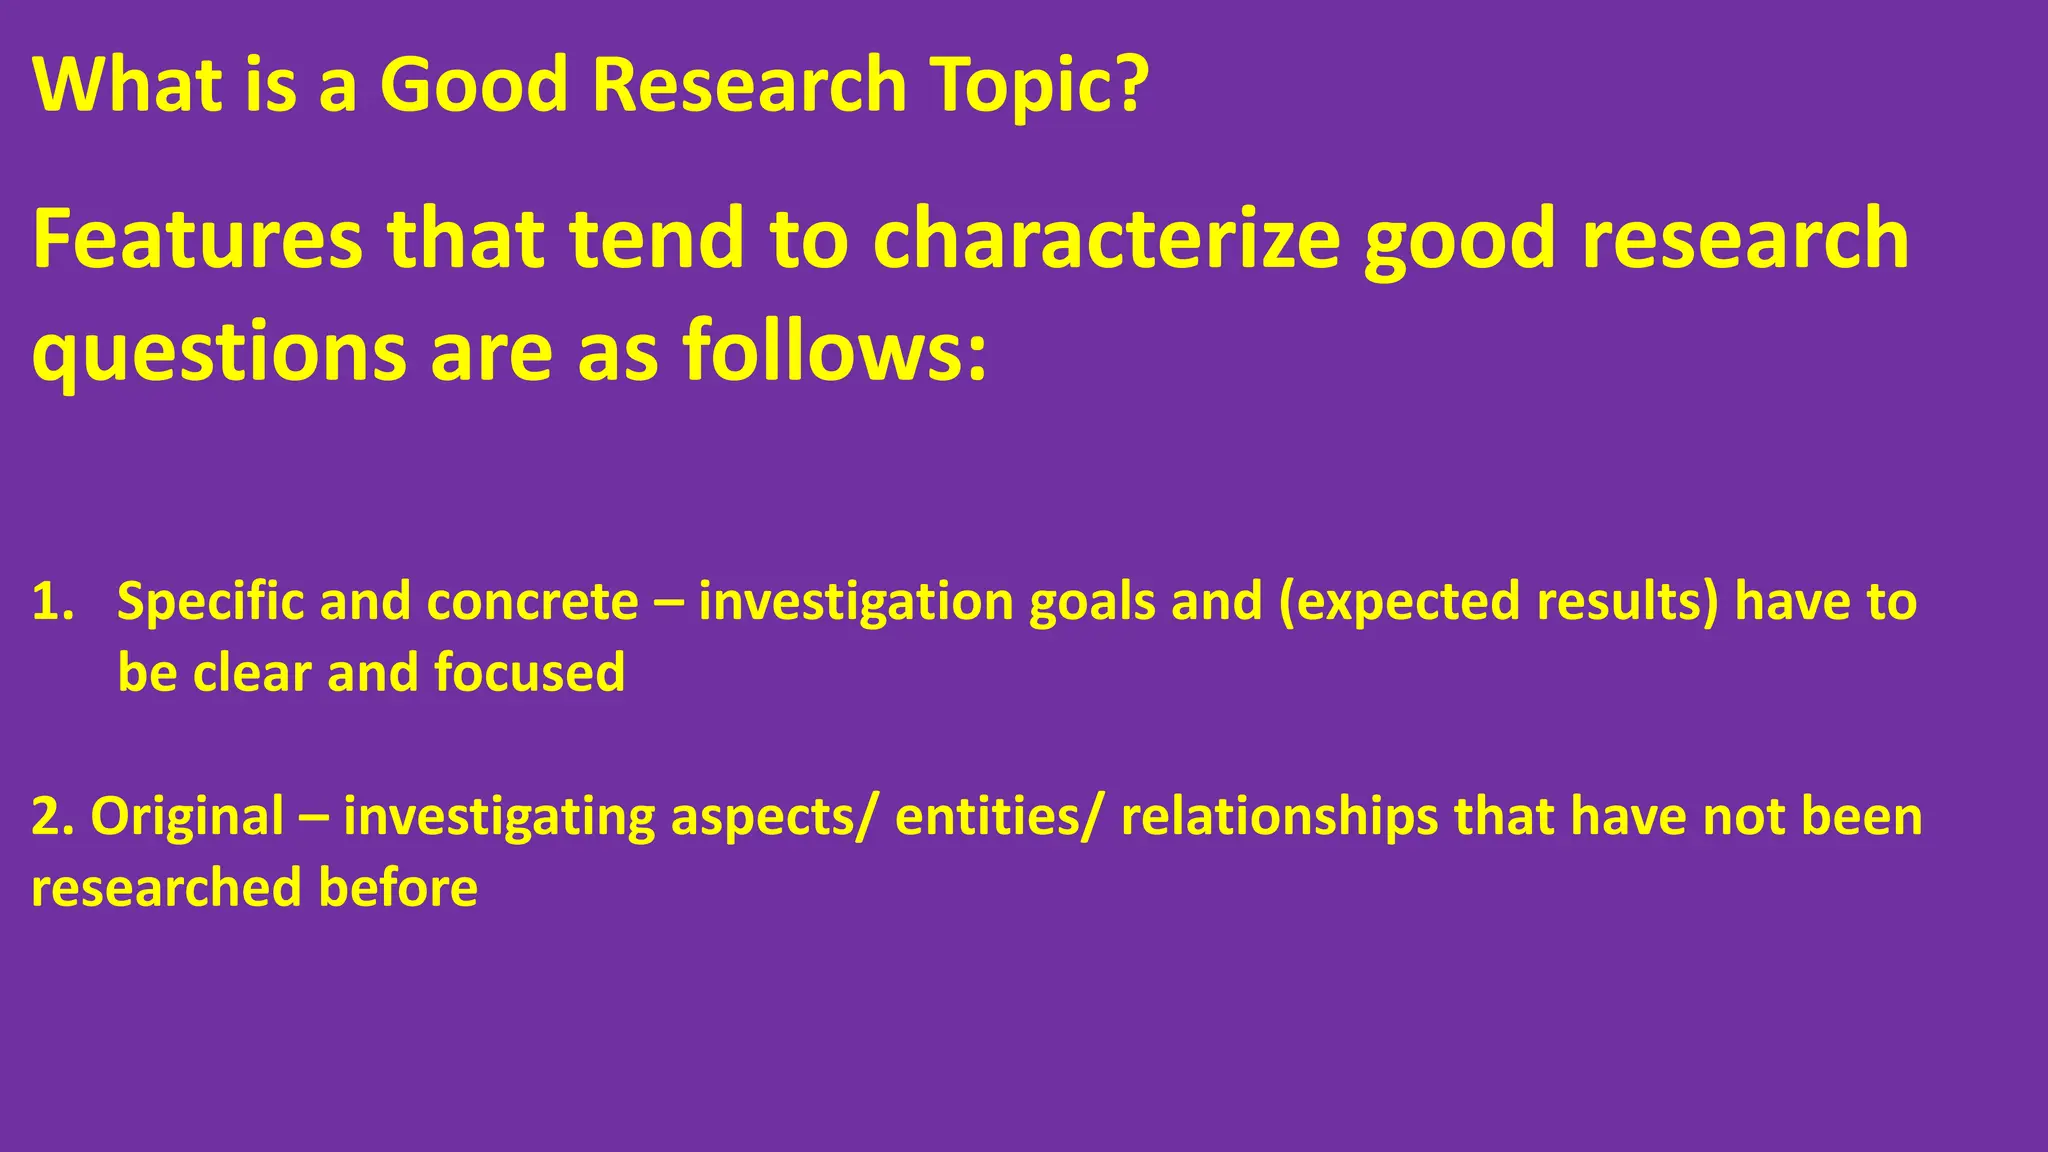
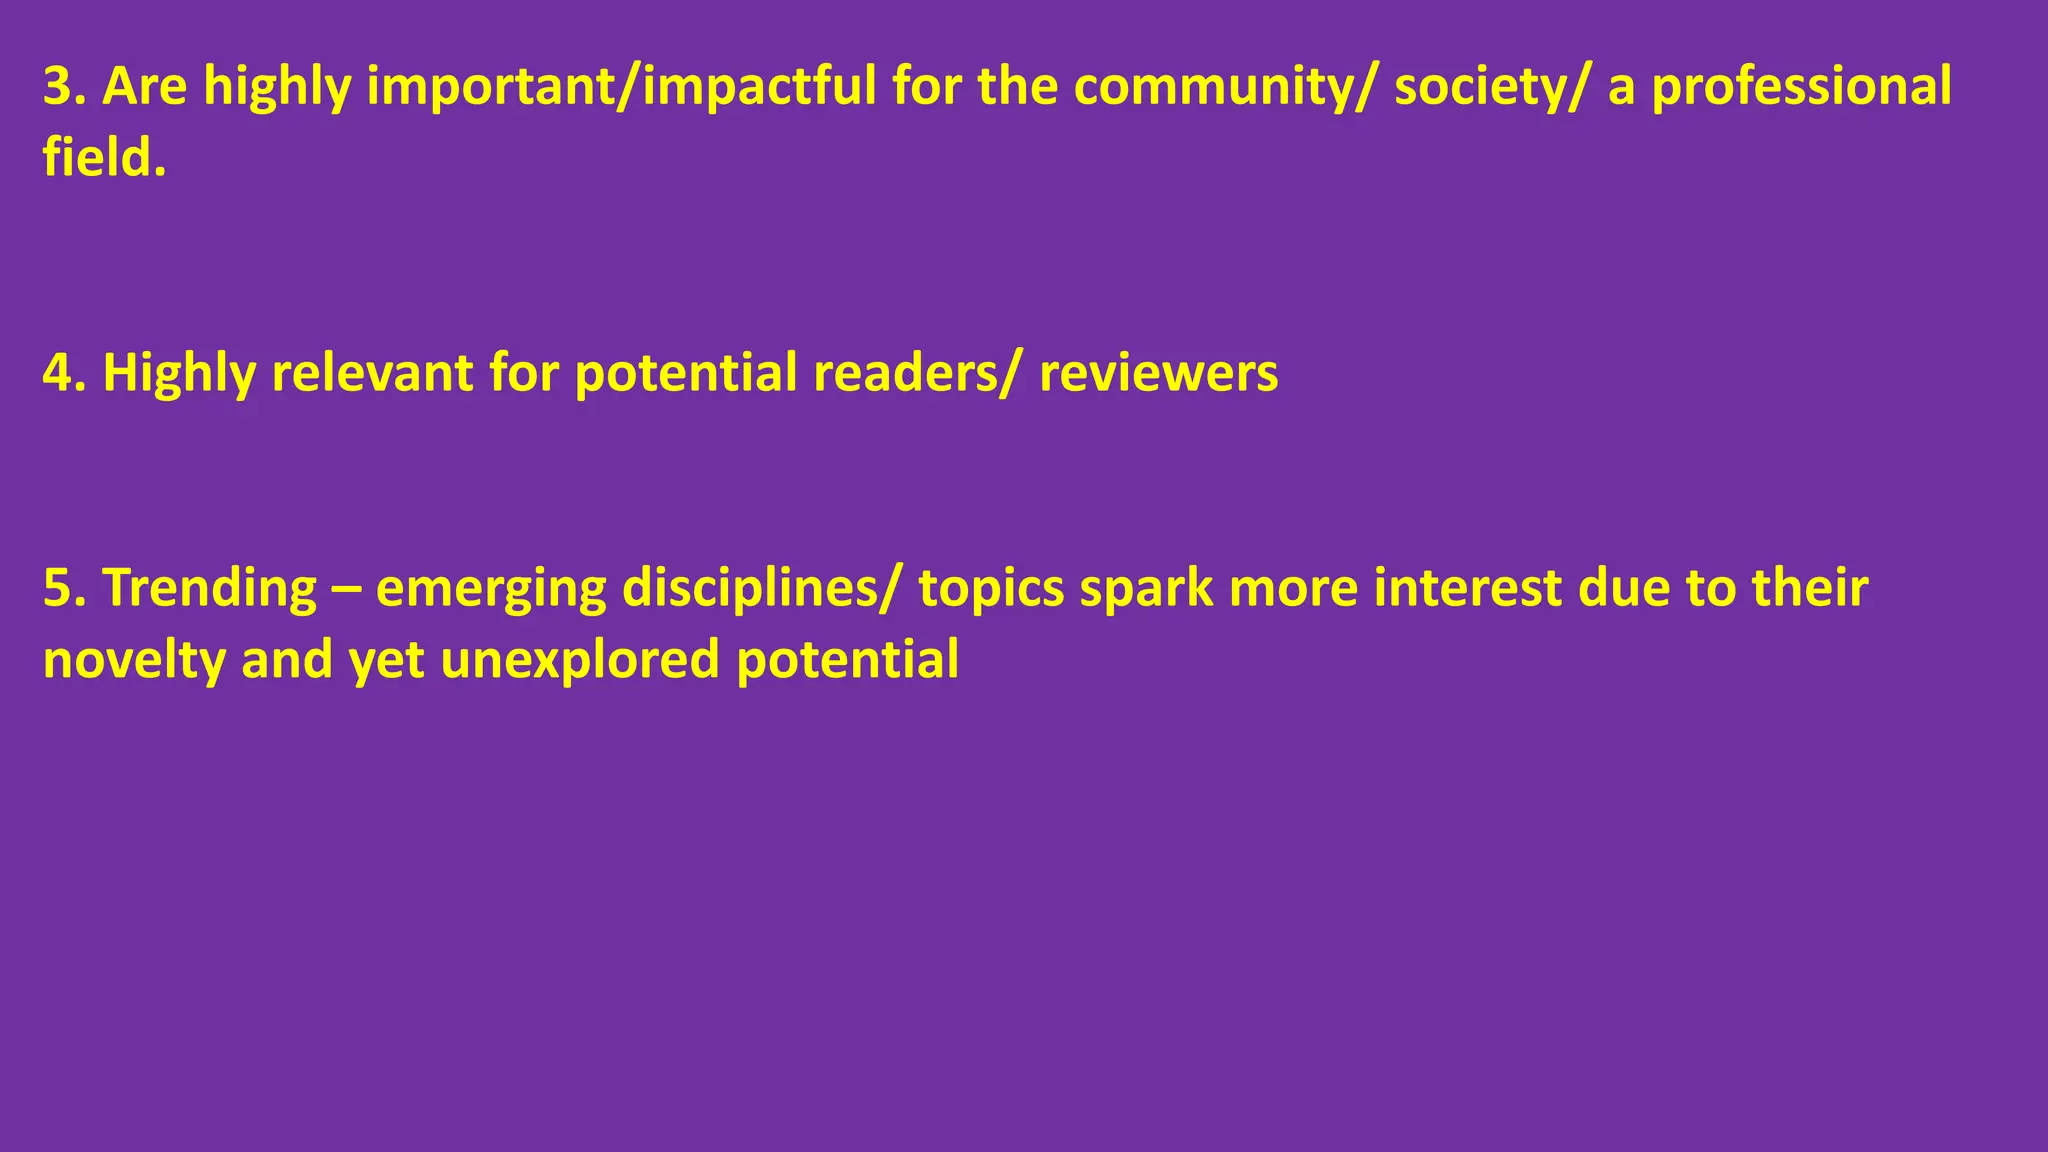
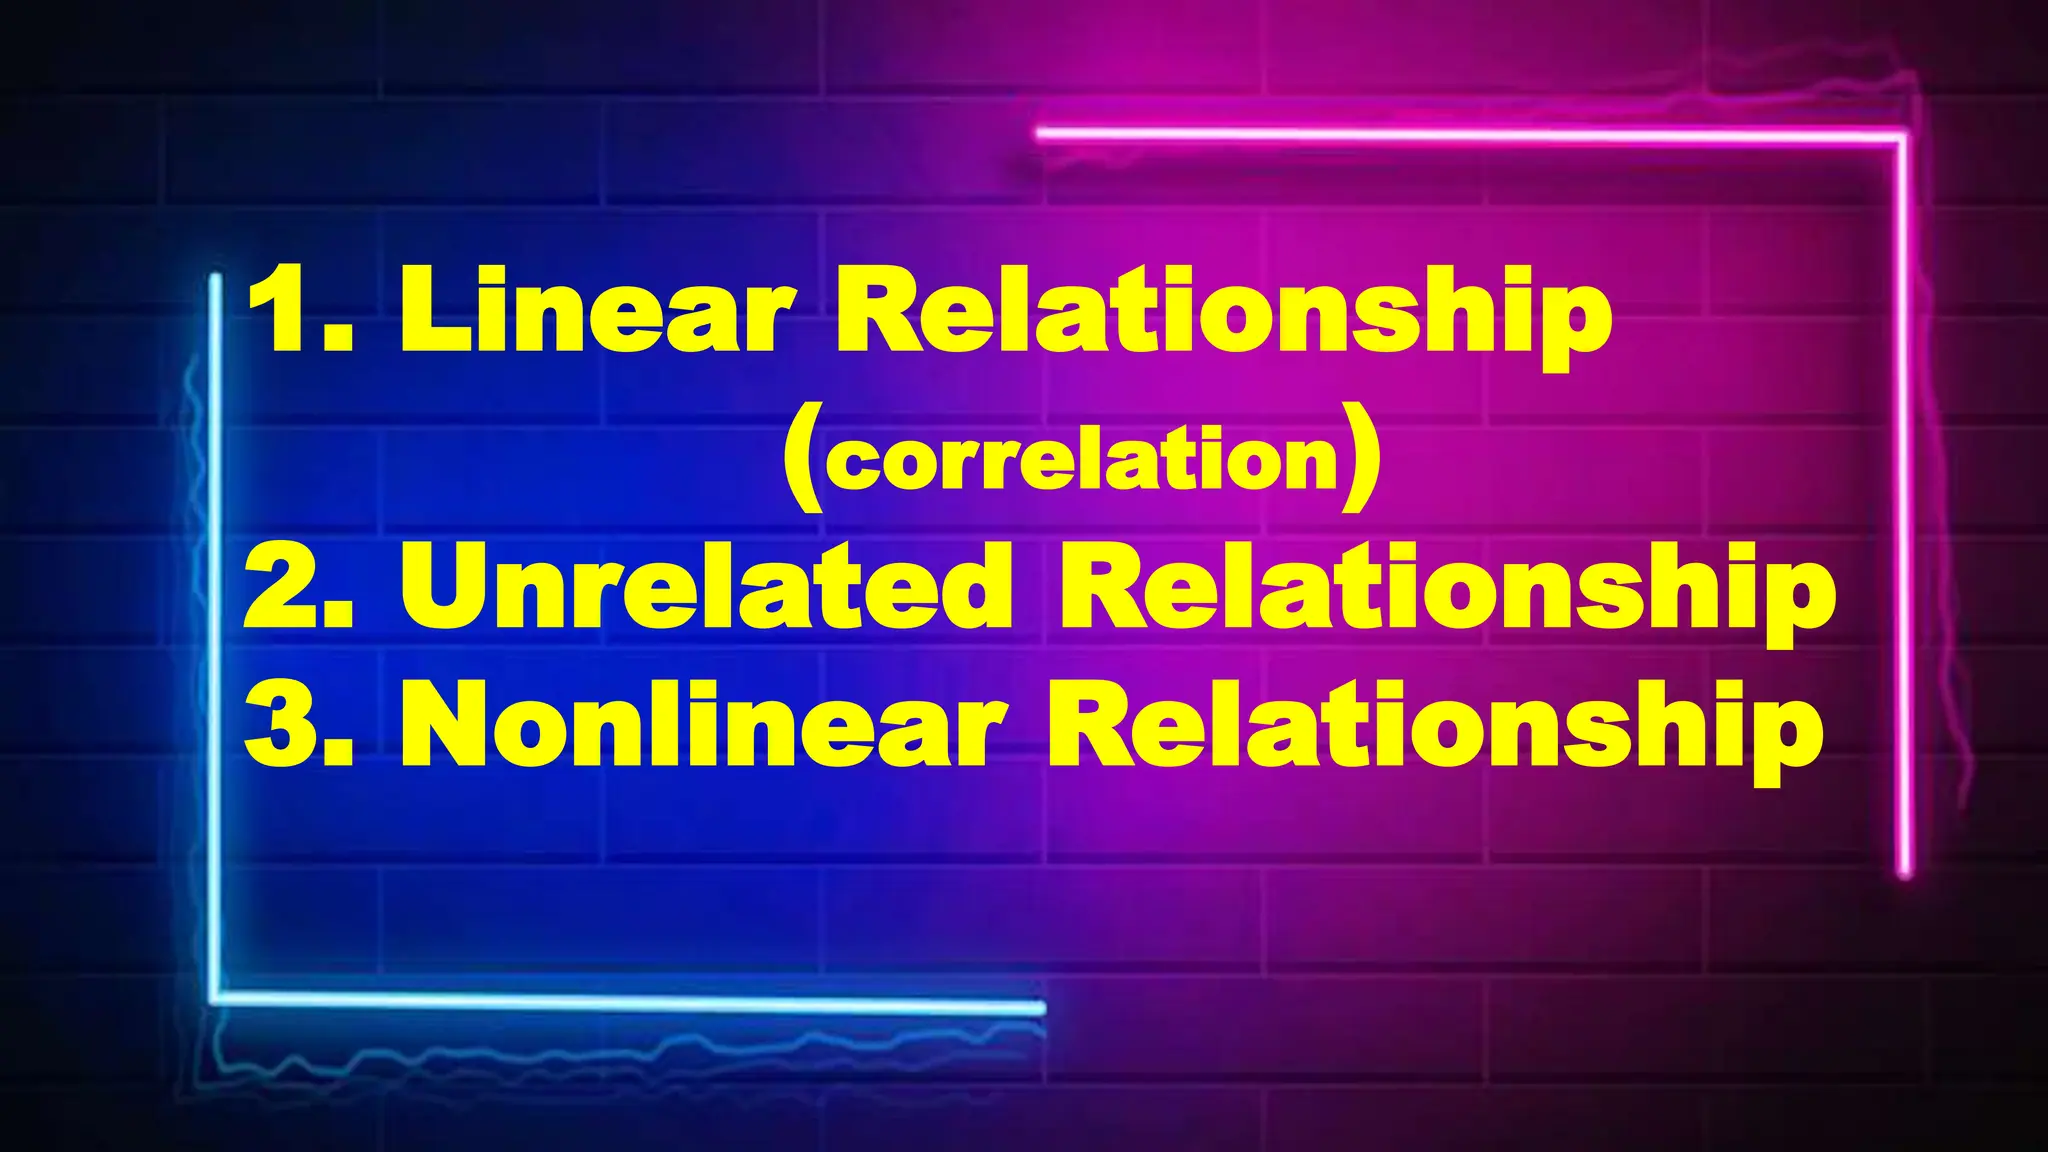
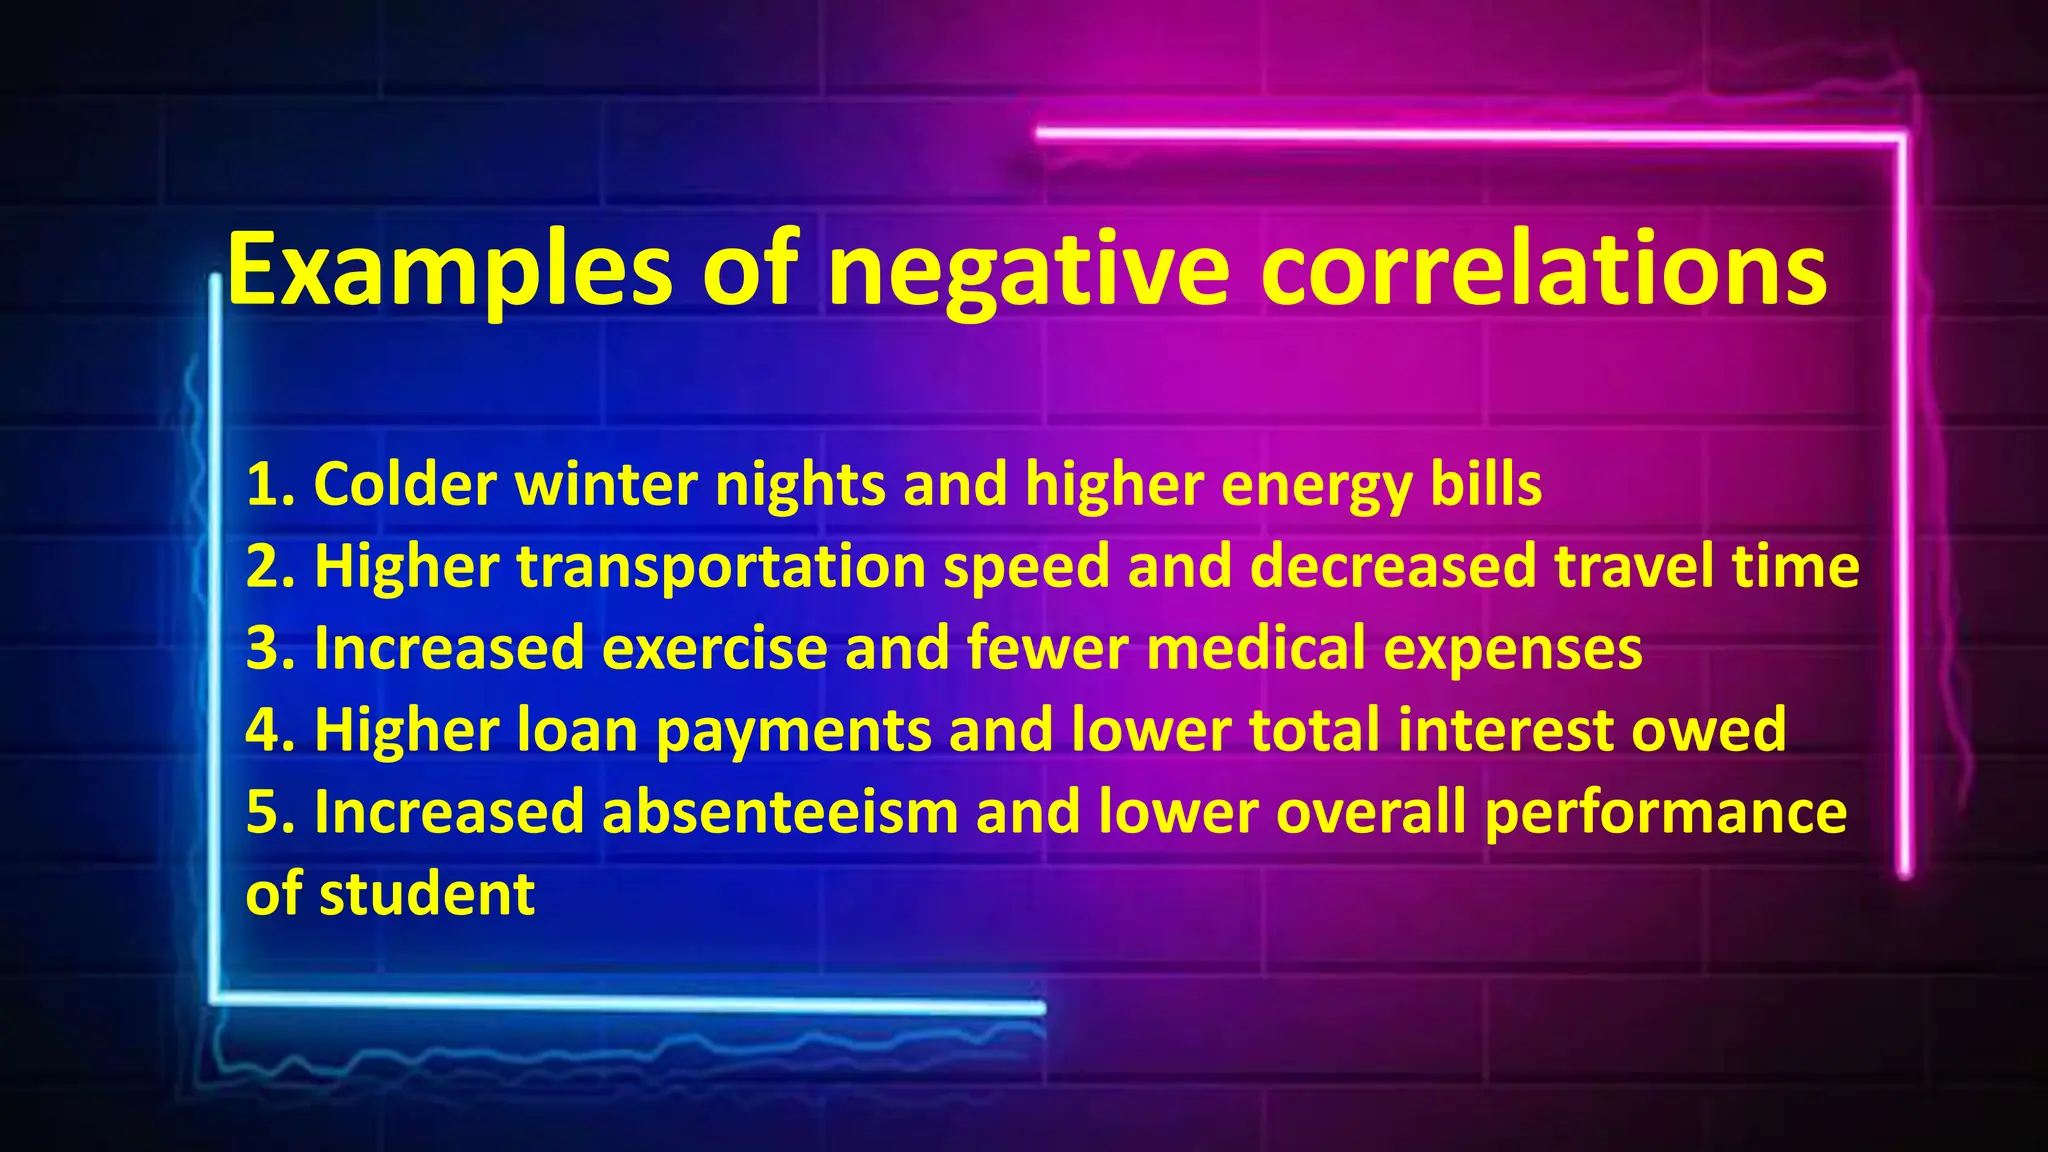
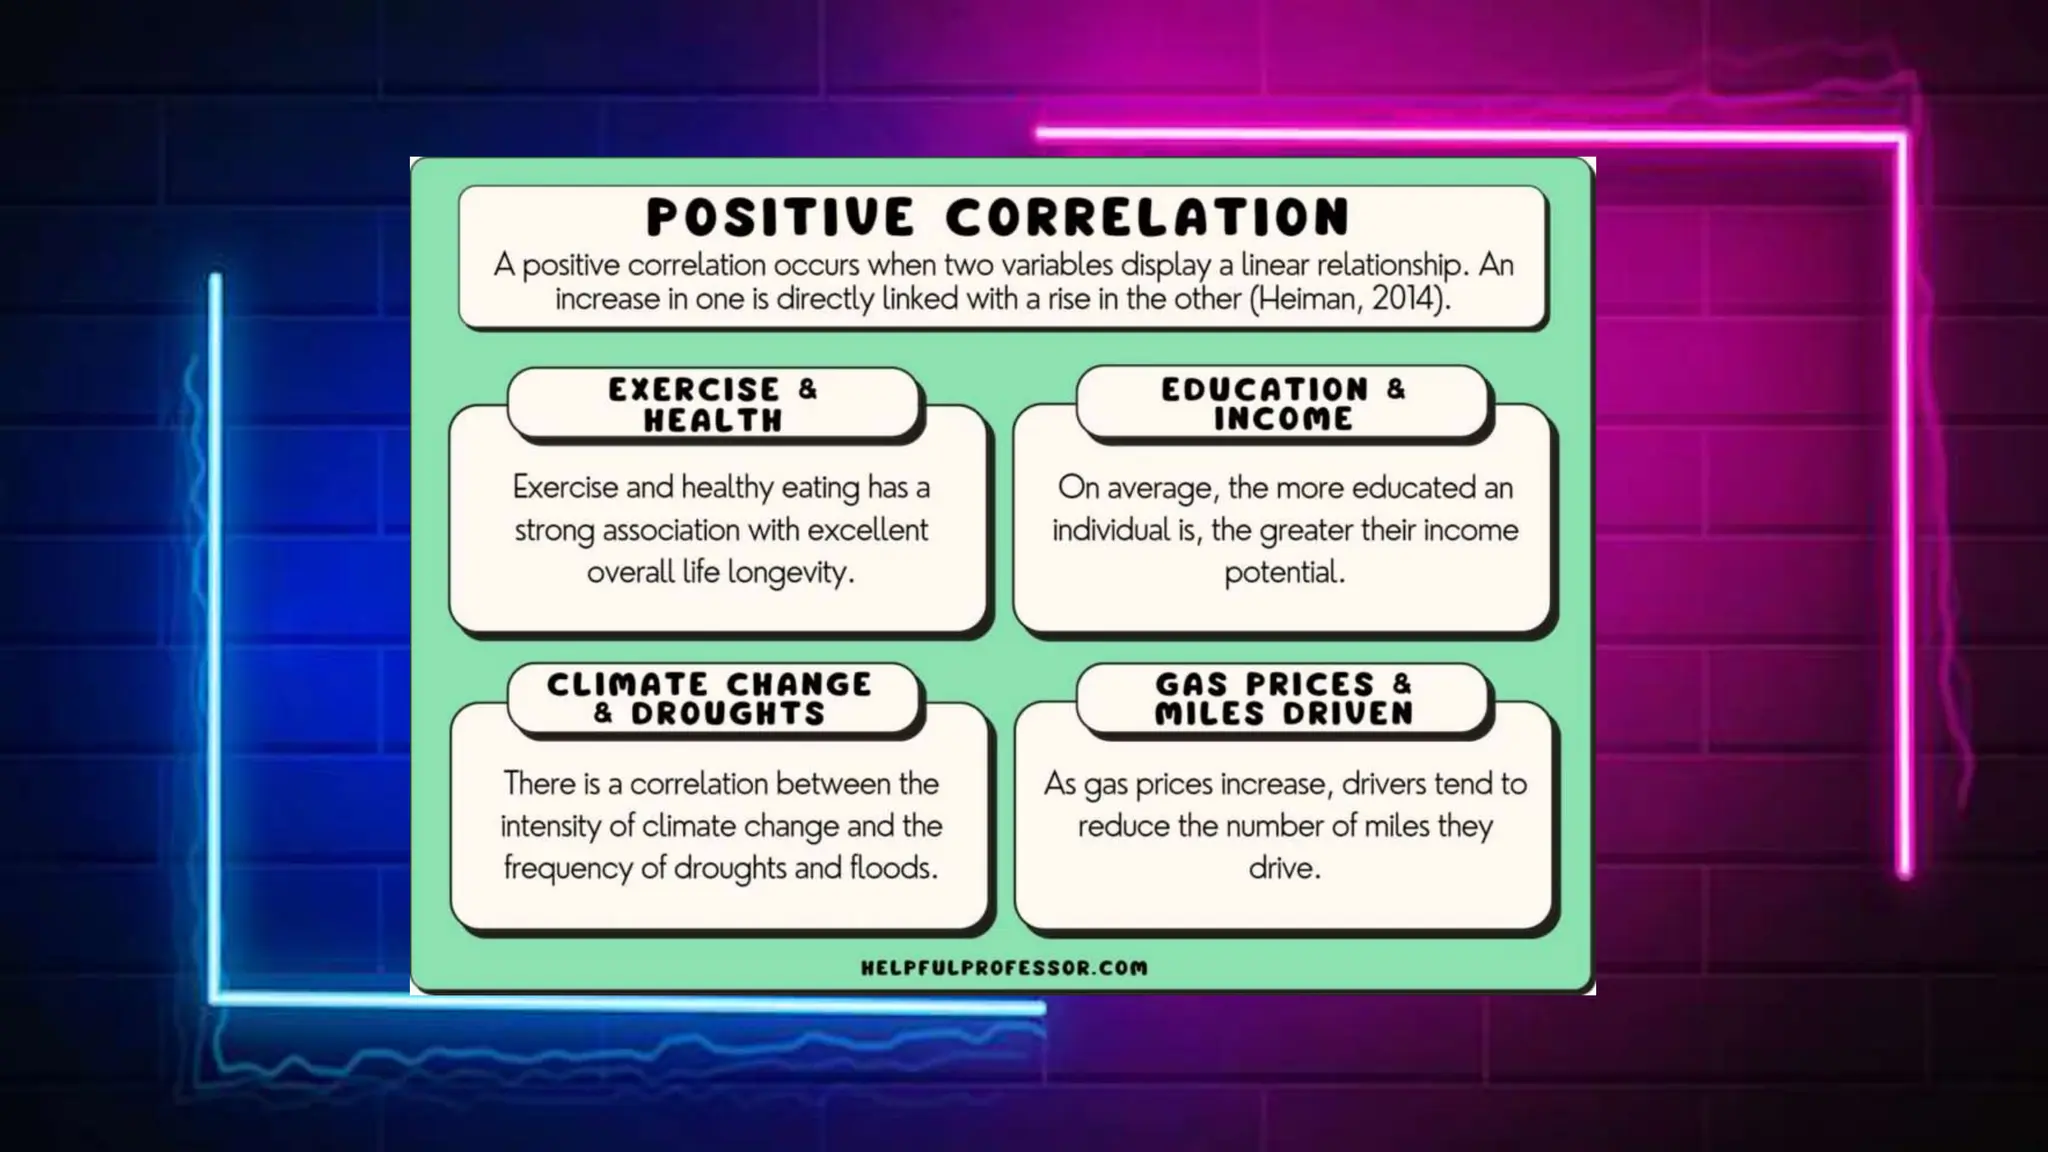
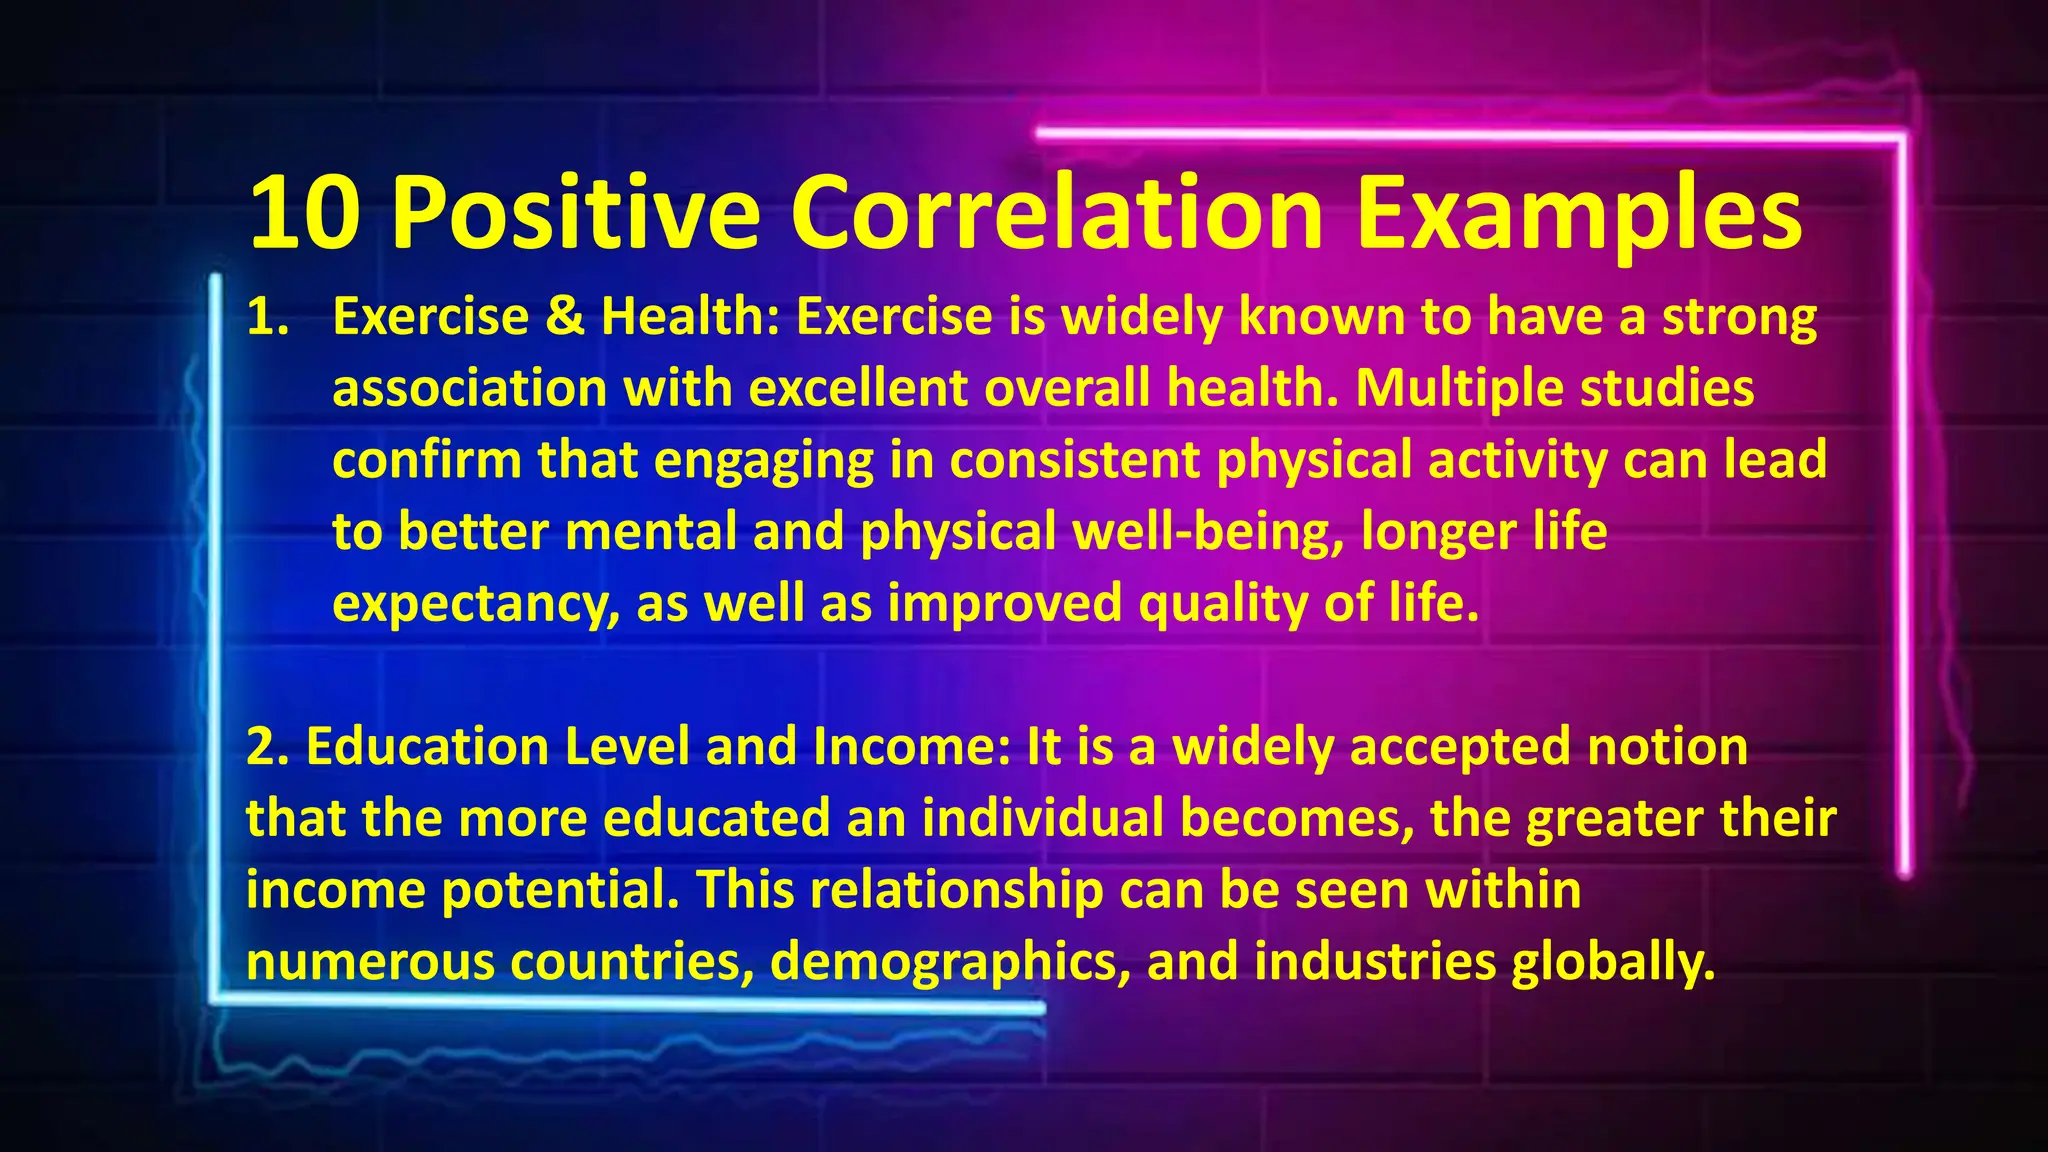
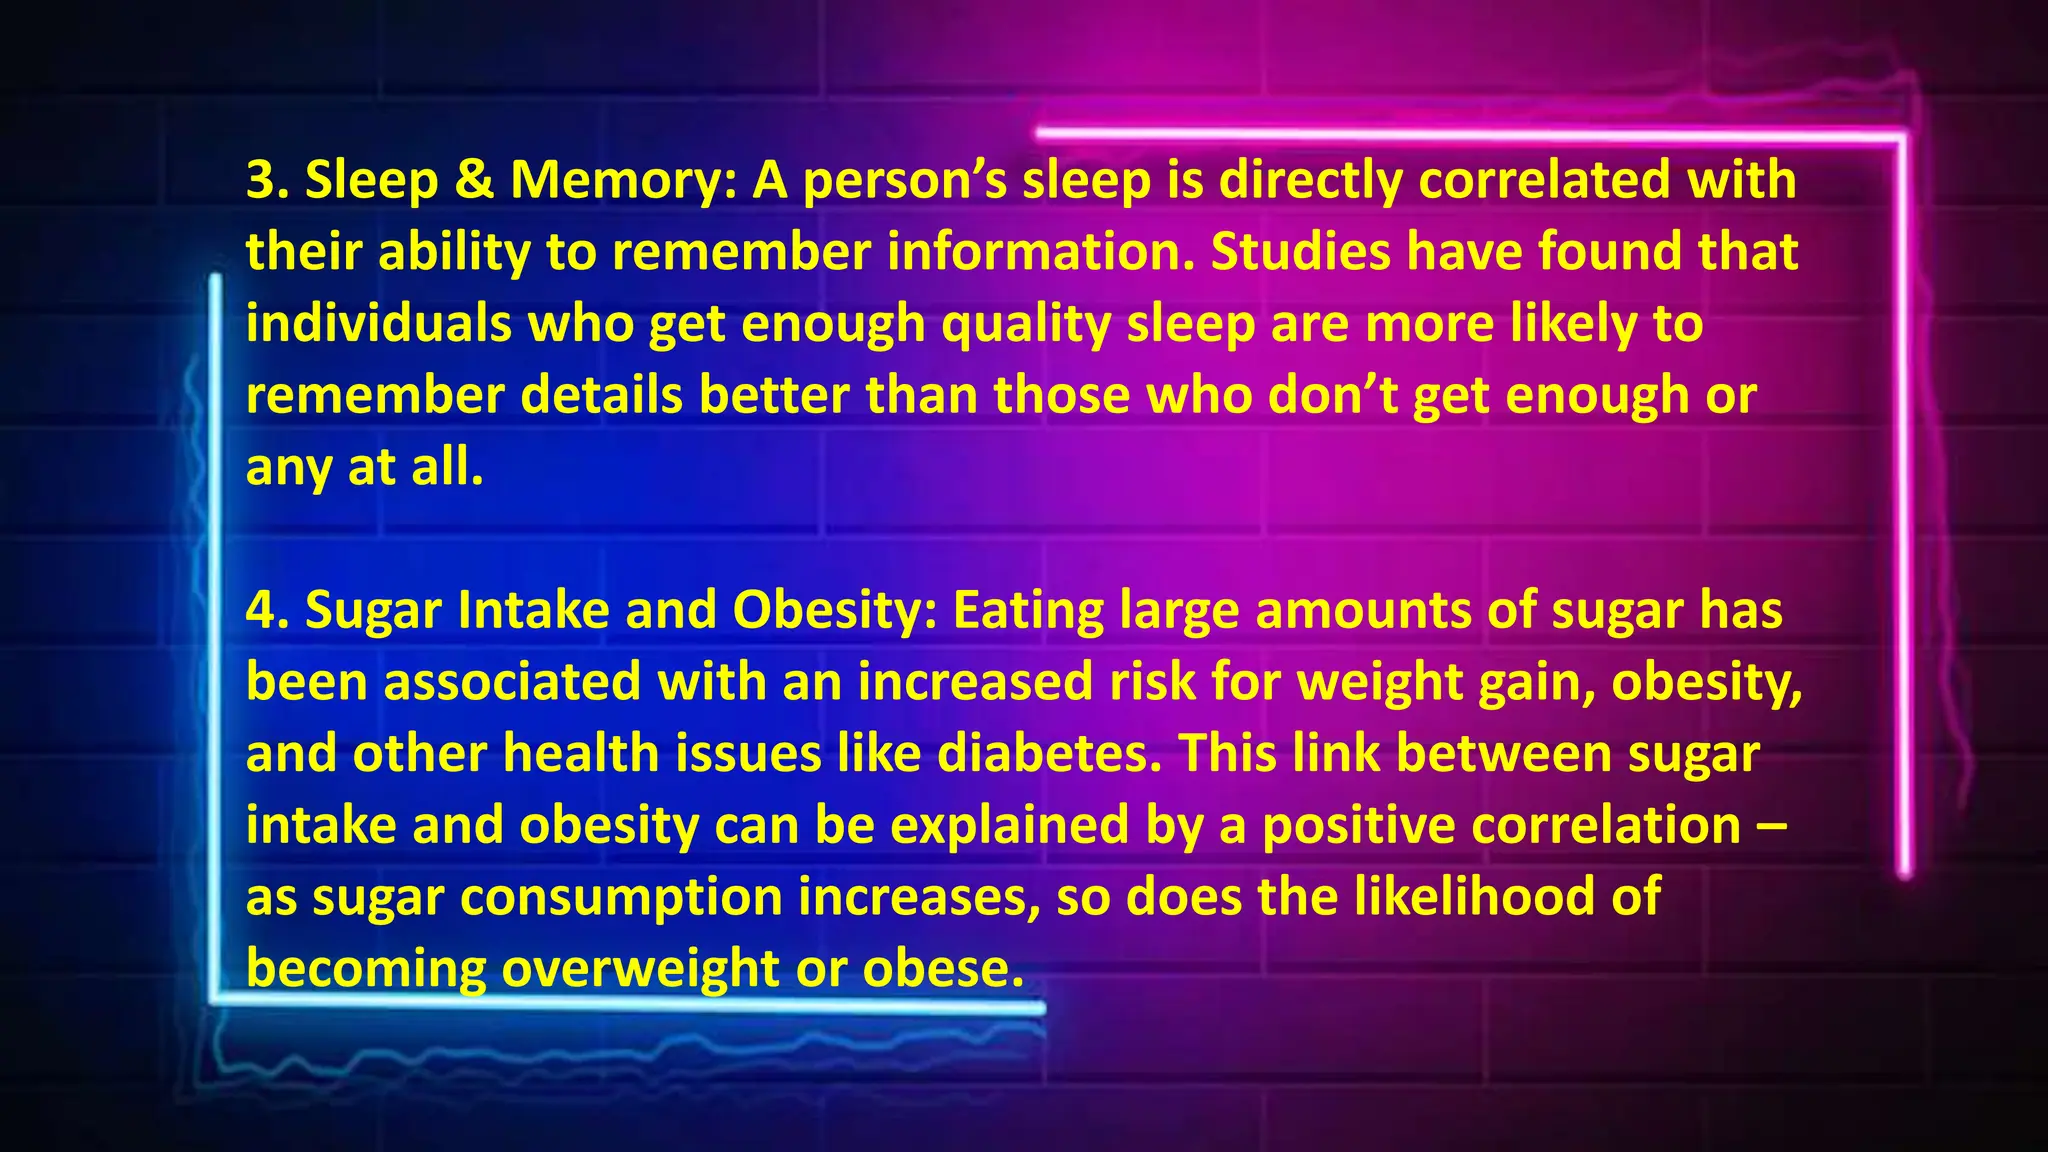
Research Topic
What is a Good Research Topic?
Features that tend to characterize good research
questions are as follows:
1. Specific and concrete – investigation goals and (expected results) have to
be clear and focused
2. Original – investigating aspects/ entities/ relationships that have not been
researched before
3. Are highly important/impactful for the community/ society/ a professional
field.
4. Highly relevant for potential readers/ reviewers
5. Trending – emerging disciplines/ topics spark more interest due to their
novelty and yet unexplored potential
Relationship Between
Variables
1. Linear Relationship
(correlation)
2. Unrelated Relationship
3. Nonlinear Relationship
Linear Relationship Definition
It best describes the relationship between
two variables (independent and dependent)
commonly represented by x and y. In the
field of statistics, it is one of the most
straightforward concepts to understand.
For a linear relationship, the variables
must give a straight line on a graph every
time the values of x and y are put
together. With this method, it is possible
to understand how variation between
two factors can affect the result and how
they relate to one another.
Linear relationships apply in day-to-day
situations where one factor relies on
another, such as an increase in the price
of goods, lowering their demand. In any
case, it considers only up to two
variables to get an outcome.
Example:
Let us take a real-world example of a grocery store,
where its budget is the independent variable
and items to be stocked are the dependent variable.
Consider the budget as $2,000, and the grocery items
are 12 snack brands ($1-$2 per pack), 12 cold drink
brands ($2-$4 per bottle), 5 cereal brands ($5-$7 per
pack), and 40 personal care brands ($3-$30 per product).
Because of budget constraints and varying prices,
purchasing more of one will require purchasing lesser of
the other.
Equation of Linear Relationship
With Graph
Whether graphically or mathematically, y’s value is
dependent on x, which gives a straight line on the graph.
Here is a quick formula to understand the linear
correlation
between variables.
Positive Correlations-
exists when two variables operate in
unison so that when one variable rises
or falls, the other does the same
Linear relationships
A negative correlation –
is when two variables move opposite
one another so that when one
variable rises, the other falls.
Linear relationships
Positive correlations
If one set of information increases when
the other increases, that is a positive
correlation. If you plot your data on a
graph, a positive correlation would
typically show a line extending from the
lower-left corner of your chart toward
the top right.
Negative correlations
If one set of information decreases when the
other increases, it is a negative correlation.
Why are correlations important?
Finding correlations between data sets can help you make
informed decisions in the workplace. It is often important to know
whether two collections of information relate to one another or
form an observable pattern. It's often also valuable to know to
what degree they relate.
Remember that observing a correlation between two data sets
doesn't always mean that changes in one cause changes in the
other. The helpful phrase "correlation does not equal causation" is
a valuable tool. This phrase says that just because two variables
appear to act in tandem, outside influences affect the pattern,
making certain conclusions less reliable.
Examples of positive correlations
1. Savings and financial security
2. Overtime worked and total income
3. Employee benefits and workplace morale
4. Salary and work satisfaction
5. Increased moisture and crop production
Examples of negative correlations
1. Colder winter nights and higher energy bills
2. Higher transportation speed and decreased travel time
3. Increased exercise and fewer medical expenses
4. Higher loan payments and lower total interest owed
5. Increased absenteeism and lower overall performance
of student
Let us determine the relationship:
Supply and demand
Economists observe a negative correlation
between the price of a product and the demand
for it. Many know this as the law of demand.
1. The more time you spend running on a
treadmill, the more calories you will burn.
2. The longer your hair grows, the more
shampoo you will need.
3. The more money you save, the more
financially secure you feel.
4. As the temperature goes up, ice cream
sales also go up.
10 Positive Correlation Examples
1. Exercise & Health: Exercise is widely known to have a strong
association with excellent overall health. Multiple studies
confirm that engaging in consistent physical activity can lead
to better mental and physical well-being, longer life
expectancy, as well as improved quality of life.
2. Education Level and Income: It is a widely accepted notion
that the more educated an individual becomes, the greater their
income potential. This relationship can be seen within
numerous countries, demographics, and industries globally.
3. Sleep & Memory: A person’s sleep is directly correlated with
their ability to remember information. Studies have found that
individuals who get enough quality sleep are more likely to
remember details better than those who don’t get enough or
any at all.
4. Sugar Intake and Obesity: Eating large amounts of sugar has
been associated with an increased risk for weight gain, obesity,
and other health issues like diabetes. This link between sugar
intake and obesity can be explained by a positive correlation –
as sugar consumption increases, so does the likelihood of
becoming overweight or obese.
5. Price Point & Quality: For many products, there is a positive
correlation between price point and product quality—the higher
the price you pay for something, the better its quality will
typically be compared to similar products at lower prices.
6. Temperature and Sunscreen Use: As air temperature rises, so
does sunscreen use—people understand that when it’s hot
outside, it’s important to wear sunscreen to protect yourself
from UV rays and potential skin damage from sunburns or
cancerous moles developing on your skin from prolonged
exposure without protection from ultraviolet radiation.
.
7. Age & Technical Knowledge: It’s no secret that younger generations are
more tech-savvy than older generations due to how much technology has
evolved in recent years. A strong positive correlation between age and
technical knowledge can explain this difference. Older people tend to have
less experience when it comes to using new technology (like smartphones
or computers) compared to younger people who grow up surrounded by
modern technology from birth onward.
8. Diet and Exercise Habits & Mental Health Outcomes: A diet rich in whole
foods (vegetables, fruits, lean proteins) combined with regular physical
activity have both been linked to improved mental health outcomes like
reduced stress levels, decreased symptoms of depression/anxiety, etc. This
connection could be partially explained through a positive correlation –
when one increases (diet/exercise habits), so does the other (mental
health).
9. Climate Change & Frequency of Droughts: Global warming impacts
weather worldwide, making droughts common occurrences during hot
summers. There is a correlation between the intensity of climate change
and the frequency of droughts due to warmer air temperatures drying out
soils faster than usual, leading to water tables depleting quicker than
before, thus causing droughts more often.
10. School Attendance & Academic Performance: It’s widely accepted that
there is a direct link between school attendance rates and academic
performance. Students who attend school regularly are more likely to do
better academically than those who do not. This connection can be
described through a strong positive correlation in which an increase in one
results in an increase in the other (school attendance resulting in improved
academic performance)
Here are some examples of negatively
correlating variables:
The more it rains, the less you can water the garden.
The more you cook at home, the less you might eat out.
The lower the temperature, the more clothes you may
wear.
The more money you spend, the less you might have.
Time Spent Running vs. Body Fat
The more time an individual spends running, the
lower their body fat tends to be. In other words, the
variable running time and the variable body fat have
a negative correlation. As time spent running
increases, body fat decreases
Time Spent Watching TV vs. Exam
Scores
The more time a student spends watching TV, the
lower their exam scores tend to be. In other words,
the variable time spent watching TV and the variable
exam score have a negative correlation. As time spent
watching TV increases, exam scores decrease.
Example 1: Coffee Consumption vs. Intelligence
The amount of coffee that individuals consume and thei
IQ level has a correlation of zero. In other words,
knowing how much coffee an individual drinks doesn’t
give us an idea of what their IQ level might be.
Examples: Temperature vs. Ice Cream
Sales
:Shoe Size vs. Movies Watched
https://www.statology.org/correlation-examples-in-real-life/
https://explorable.com/relationship-between-variables

Describing Relationship between Variables

  • 1.
  • 2.
    What is aGood Research Topic? Features that tend to characterize good research questions are as follows: 1. Specific and concrete – investigation goals and (expected results) have to be clear and focused 2. Original – investigating aspects/ entities/ relationships that have not been researched before
  • 3.
    3. Are highlyimportant/impactful for the community/ society/ a professional field. 4. Highly relevant for potential readers/ reviewers 5. Trending – emerging disciplines/ topics spark more interest due to their novelty and yet unexplored potential
  • 4.
  • 5.
    1. Linear Relationship (correlation) 2.Unrelated Relationship 3. Nonlinear Relationship
  • 6.
    Linear Relationship Definition Itbest describes the relationship between two variables (independent and dependent) commonly represented by x and y. In the field of statistics, it is one of the most straightforward concepts to understand.
  • 7.
    For a linearrelationship, the variables must give a straight line on a graph every time the values of x and y are put together. With this method, it is possible to understand how variation between two factors can affect the result and how they relate to one another.
  • 8.
    Linear relationships applyin day-to-day situations where one factor relies on another, such as an increase in the price of goods, lowering their demand. In any case, it considers only up to two variables to get an outcome.
  • 9.
    Example: Let us takea real-world example of a grocery store, where its budget is the independent variable and items to be stocked are the dependent variable. Consider the budget as $2,000, and the grocery items are 12 snack brands ($1-$2 per pack), 12 cold drink brands ($2-$4 per bottle), 5 cereal brands ($5-$7 per pack), and 40 personal care brands ($3-$30 per product). Because of budget constraints and varying prices, purchasing more of one will require purchasing lesser of the other.
  • 10.
    Equation of LinearRelationship With Graph Whether graphically or mathematically, y’s value is dependent on x, which gives a straight line on the graph. Here is a quick formula to understand the linear correlation between variables.
  • 11.
    Positive Correlations- exists whentwo variables operate in unison so that when one variable rises or falls, the other does the same Linear relationships
  • 12.
    A negative correlation– is when two variables move opposite one another so that when one variable rises, the other falls. Linear relationships
  • 13.
    Positive correlations If oneset of information increases when the other increases, that is a positive correlation. If you plot your data on a graph, a positive correlation would typically show a line extending from the lower-left corner of your chart toward the top right.
  • 14.
    Negative correlations If oneset of information decreases when the other increases, it is a negative correlation.
  • 15.
    Why are correlationsimportant? Finding correlations between data sets can help you make informed decisions in the workplace. It is often important to know whether two collections of information relate to one another or form an observable pattern. It's often also valuable to know to what degree they relate. Remember that observing a correlation between two data sets doesn't always mean that changes in one cause changes in the other. The helpful phrase "correlation does not equal causation" is a valuable tool. This phrase says that just because two variables appear to act in tandem, outside influences affect the pattern, making certain conclusions less reliable.
  • 16.
    Examples of positivecorrelations 1. Savings and financial security 2. Overtime worked and total income 3. Employee benefits and workplace morale 4. Salary and work satisfaction 5. Increased moisture and crop production
  • 17.
    Examples of negativecorrelations 1. Colder winter nights and higher energy bills 2. Higher transportation speed and decreased travel time 3. Increased exercise and fewer medical expenses 4. Higher loan payments and lower total interest owed 5. Increased absenteeism and lower overall performance of student
  • 18.
    Let us determinethe relationship: Supply and demand
  • 19.
    Economists observe anegative correlation between the price of a product and the demand for it. Many know this as the law of demand.
  • 20.
    1. The moretime you spend running on a treadmill, the more calories you will burn. 2. The longer your hair grows, the more shampoo you will need.
  • 21.
    3. The moremoney you save, the more financially secure you feel. 4. As the temperature goes up, ice cream sales also go up.
  • 23.
    10 Positive CorrelationExamples 1. Exercise & Health: Exercise is widely known to have a strong association with excellent overall health. Multiple studies confirm that engaging in consistent physical activity can lead to better mental and physical well-being, longer life expectancy, as well as improved quality of life. 2. Education Level and Income: It is a widely accepted notion that the more educated an individual becomes, the greater their income potential. This relationship can be seen within numerous countries, demographics, and industries globally.
  • 24.
    3. Sleep &Memory: A person’s sleep is directly correlated with their ability to remember information. Studies have found that individuals who get enough quality sleep are more likely to remember details better than those who don’t get enough or any at all. 4. Sugar Intake and Obesity: Eating large amounts of sugar has been associated with an increased risk for weight gain, obesity, and other health issues like diabetes. This link between sugar intake and obesity can be explained by a positive correlation – as sugar consumption increases, so does the likelihood of becoming overweight or obese.
  • 25.
    5. Price Point& Quality: For many products, there is a positive correlation between price point and product quality—the higher the price you pay for something, the better its quality will typically be compared to similar products at lower prices. 6. Temperature and Sunscreen Use: As air temperature rises, so does sunscreen use—people understand that when it’s hot outside, it’s important to wear sunscreen to protect yourself from UV rays and potential skin damage from sunburns or cancerous moles developing on your skin from prolonged exposure without protection from ultraviolet radiation. .
  • 26.
    7. Age &Technical Knowledge: It’s no secret that younger generations are more tech-savvy than older generations due to how much technology has evolved in recent years. A strong positive correlation between age and technical knowledge can explain this difference. Older people tend to have less experience when it comes to using new technology (like smartphones or computers) compared to younger people who grow up surrounded by modern technology from birth onward. 8. Diet and Exercise Habits & Mental Health Outcomes: A diet rich in whole foods (vegetables, fruits, lean proteins) combined with regular physical activity have both been linked to improved mental health outcomes like reduced stress levels, decreased symptoms of depression/anxiety, etc. This connection could be partially explained through a positive correlation – when one increases (diet/exercise habits), so does the other (mental health).
  • 27.
    9. Climate Change& Frequency of Droughts: Global warming impacts weather worldwide, making droughts common occurrences during hot summers. There is a correlation between the intensity of climate change and the frequency of droughts due to warmer air temperatures drying out soils faster than usual, leading to water tables depleting quicker than before, thus causing droughts more often. 10. School Attendance & Academic Performance: It’s widely accepted that there is a direct link between school attendance rates and academic performance. Students who attend school regularly are more likely to do better academically than those who do not. This connection can be described through a strong positive correlation in which an increase in one results in an increase in the other (school attendance resulting in improved academic performance)
  • 28.
    Here are someexamples of negatively correlating variables: The more it rains, the less you can water the garden. The more you cook at home, the less you might eat out. The lower the temperature, the more clothes you may wear. The more money you spend, the less you might have.
  • 29.
    Time Spent Runningvs. Body Fat The more time an individual spends running, the lower their body fat tends to be. In other words, the variable running time and the variable body fat have a negative correlation. As time spent running increases, body fat decreases
  • 30.
    Time Spent WatchingTV vs. Exam Scores The more time a student spends watching TV, the lower their exam scores tend to be. In other words, the variable time spent watching TV and the variable exam score have a negative correlation. As time spent watching TV increases, exam scores decrease.
  • 31.
    Example 1: CoffeeConsumption vs. Intelligence The amount of coffee that individuals consume and thei IQ level has a correlation of zero. In other words, knowing how much coffee an individual drinks doesn’t give us an idea of what their IQ level might be.
  • 32.
    Examples: Temperature vs.Ice Cream Sales :Shoe Size vs. Movies Watched https://www.statology.org/correlation-examples-in-real-life/ https://explorable.com/relationship-between-variables