Downloaded 368 times

![Tiers
Tiers 3 and 4 are intended for internal use at
individual sites.
Quantification is measured through use of the
Process Safety Event (PSE) rate, which is
calculated as follows:
PSE Rate = [Total PSE Count x 200,000] / Total
Workforce Hours
Each Tier has its own PSE rate.](https://image.slidesharecdn.com/definingkpi-unsafeactsandconditionsandnearmiss2-130521064400-phpapp02/75/Defining-kpi-in-terms-of-unsafe-acts-conditions-and-near-miss-22-2048.jpg)
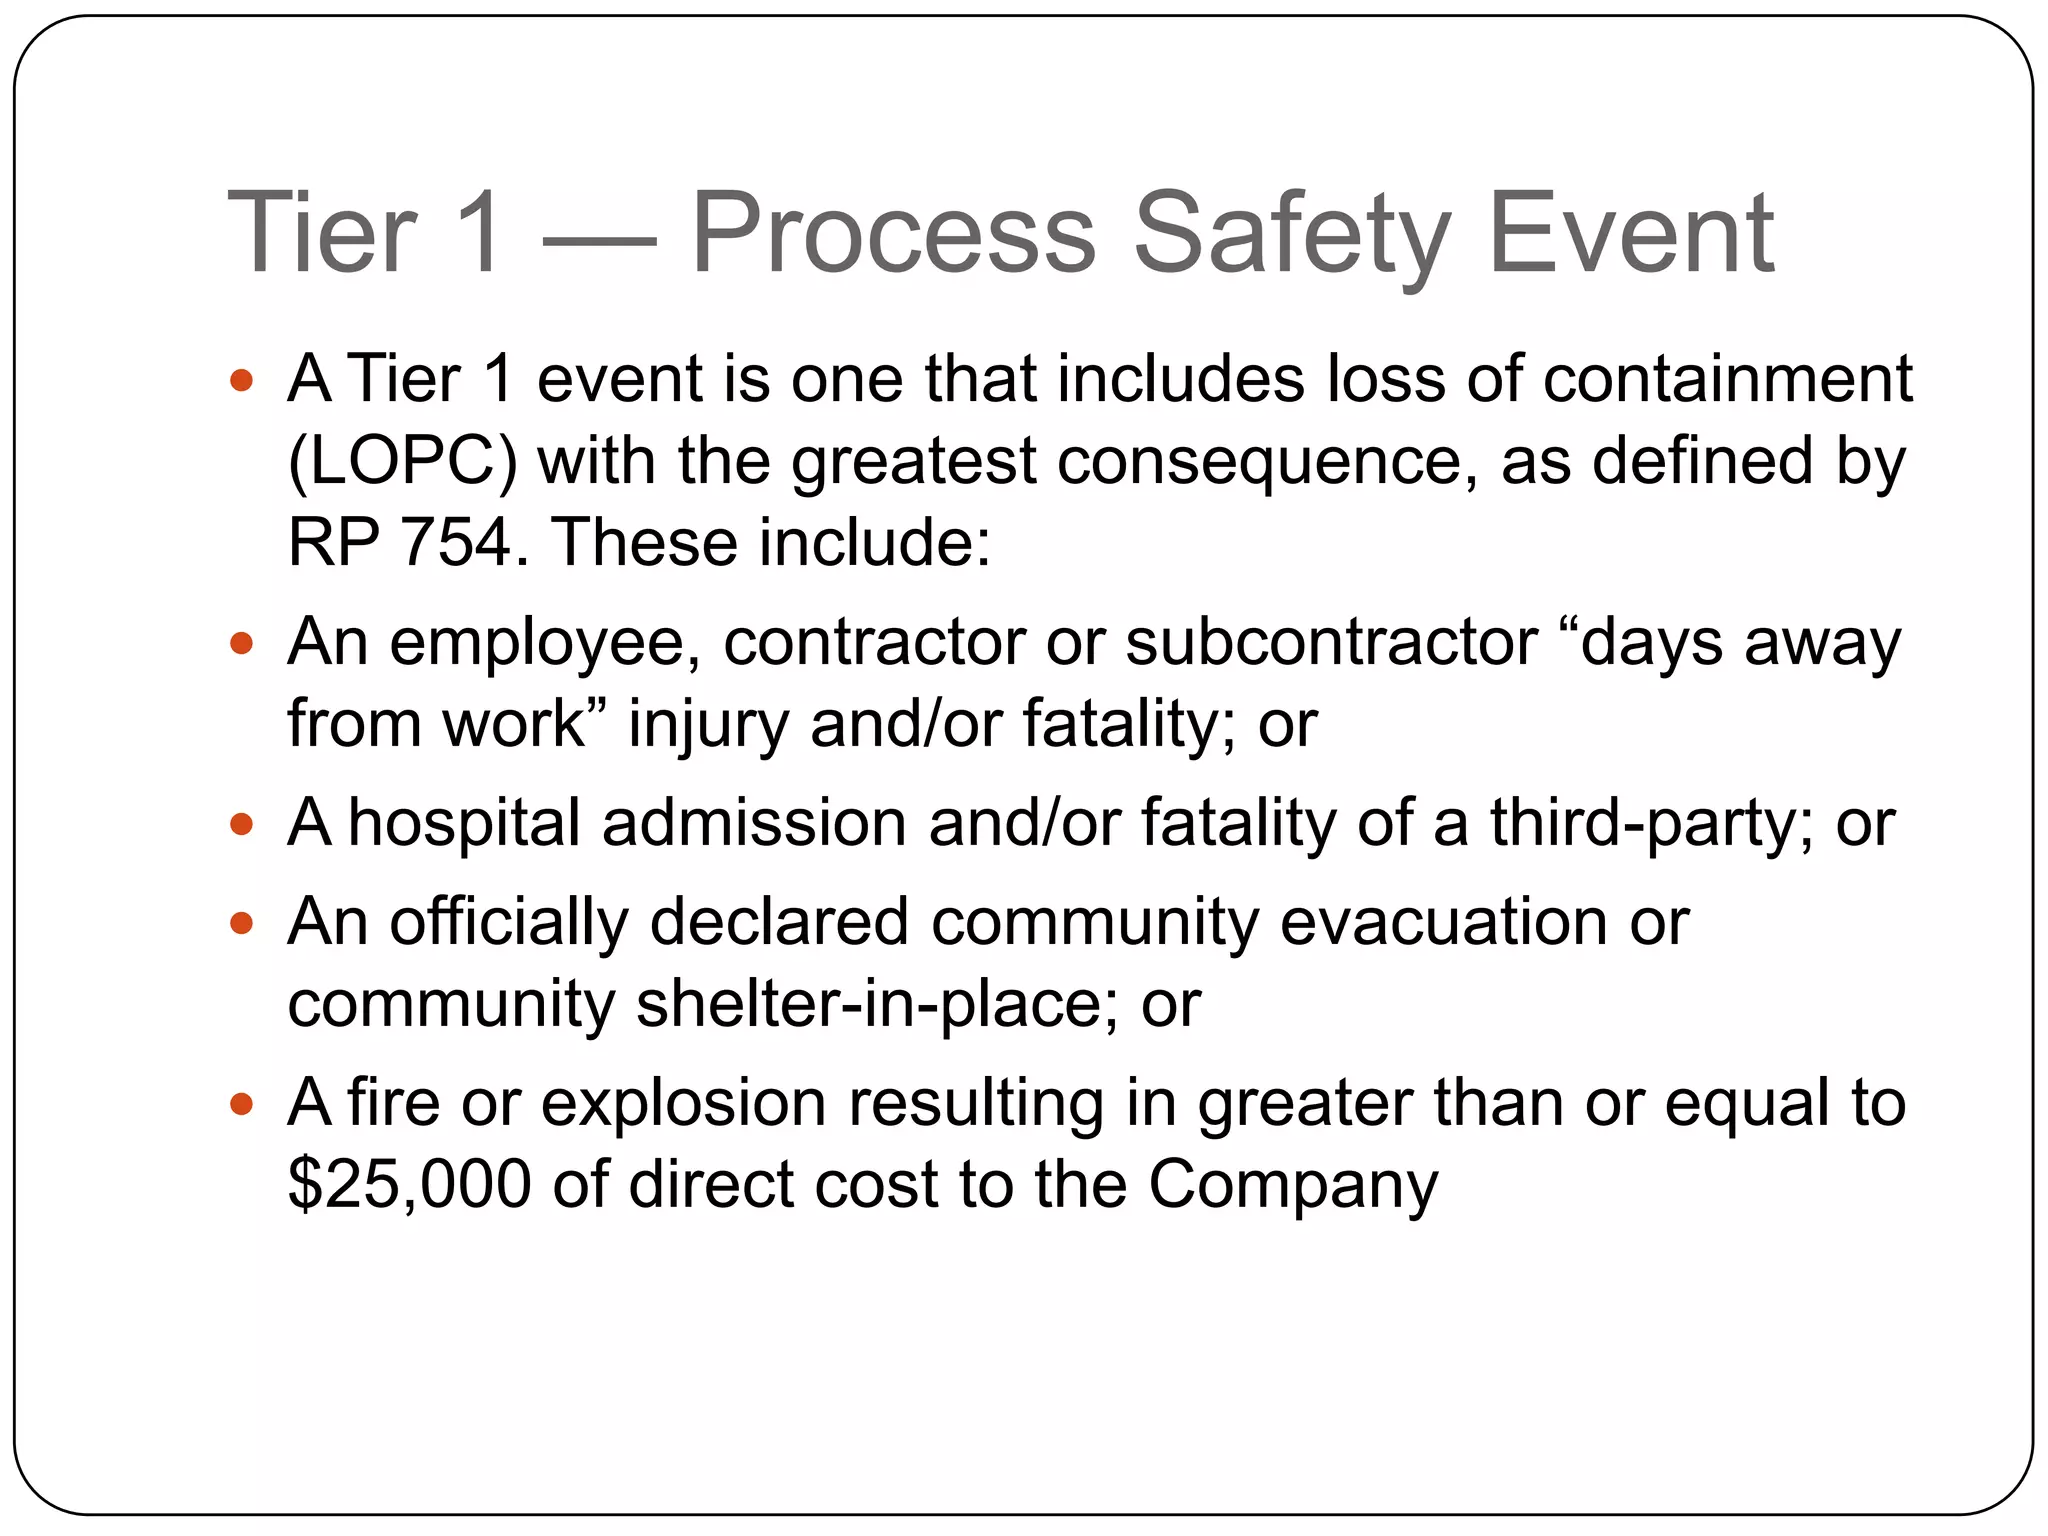


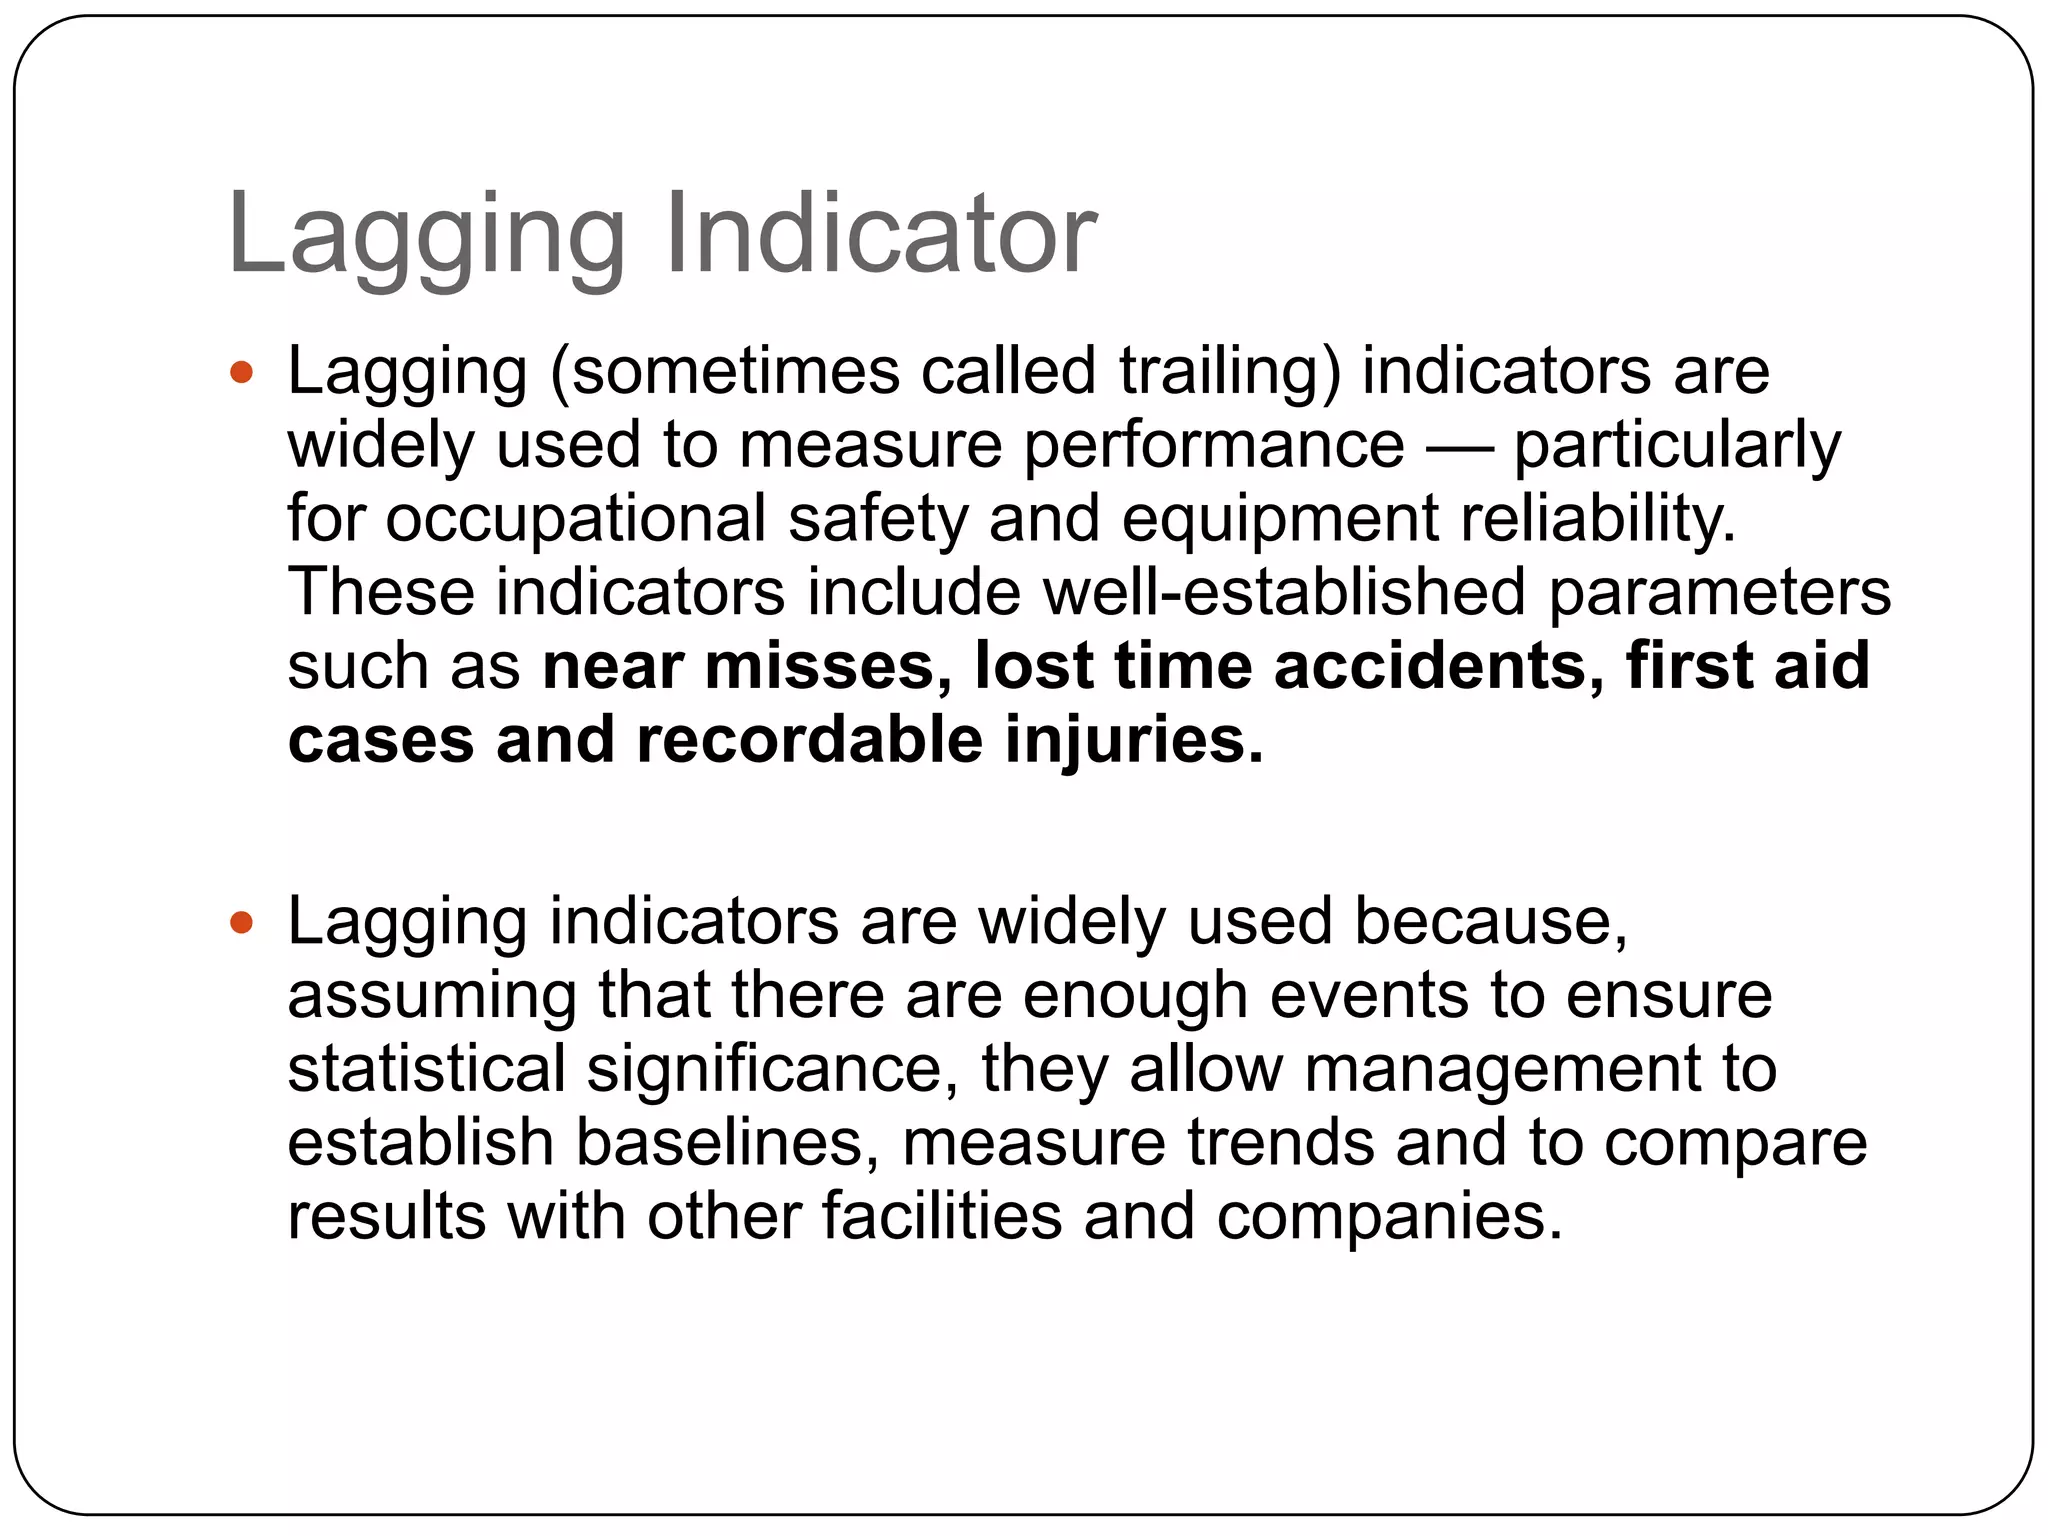
This document discusses key performance indicators (KPIs) for measuring safety performance, including lagging and leading indicators. It describes lagging indicators like recordable injuries and spills that measure past performance, as well as leading indicators like safety inspections and trainings that predict future safety. The document outlines a tiered framework from API RP 754 for indicators, ranging from infrequent Tier 1 events with highest consequences to more common Tier 4 measures of management system performance. Selection of the right mix of lagging and leading KPIs is important for continuous safety improvement.


