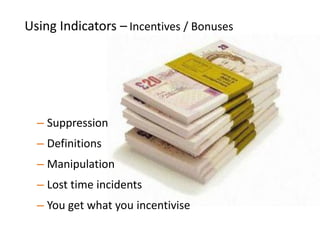
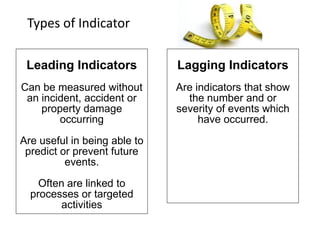
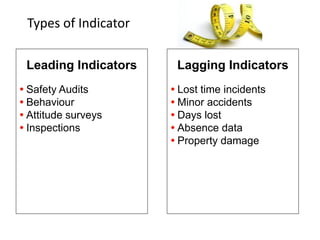
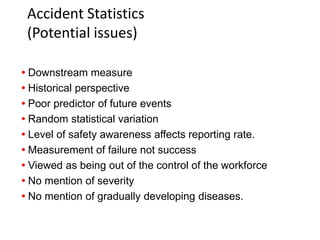
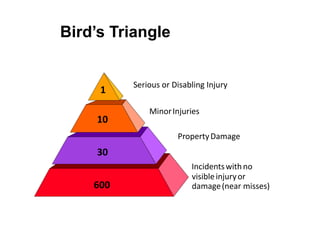
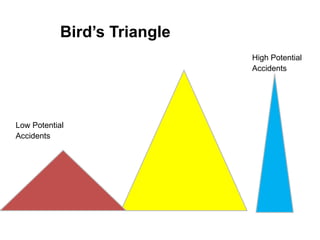
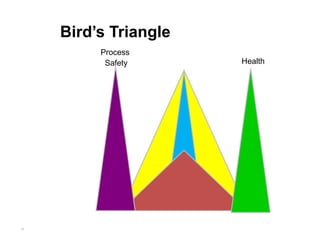
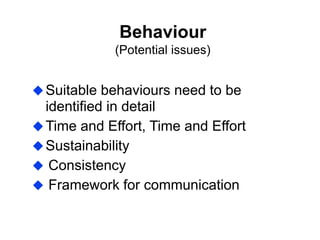
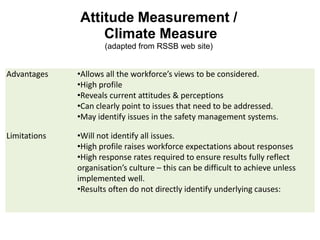
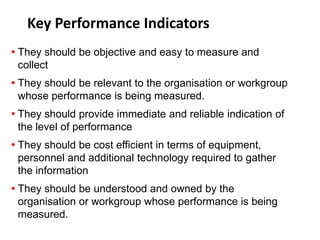
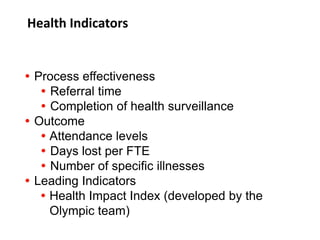
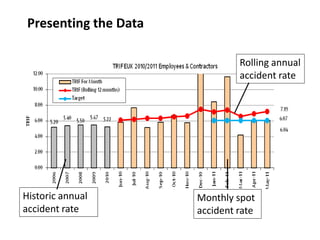
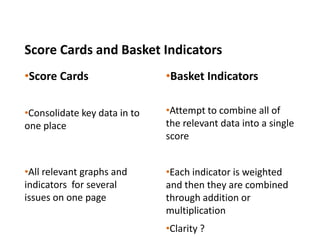
1
Indicators of Performance in
Health and Safety Management
Professor Neil Budworth
EHS Director EMEA Houghton International
What is to come
– Why bother with indicators
– what use are they ?
– The main types of indicators
– Pros and cons of some well known indicators
– Presenting data and benchmarking
– Health and Process Safety
– Summary
But Before I start
Where is North ?
What are Indicators of Performance for ?
- Why Bother ?
– to monitor how well the business is performing (to show
the right direction)
– to raise awareness or to focus attention on a particular
issue
– to be used as part of an incentive programme
– to educate staff
Each of these purposes will
require different characteristics
Using Indicators - Monitoring
– Linked to activities
– Looking for trends
– Moving annual totals
– Rates
– Yardstick – good or bad
Using Indicators
Creating Awareness / Focus
– Frequency of report
– Focusing a spotlight on an issue
– Comparison
– Understand ability
6
What would you estimate
the top ten insurance issues
to be for an Engineering
Company ?
Costs No of Cases Cost per Case
Deafness 2500 6 417
Cuts 9421 10 942
Slips Trips and Falls 82394 32 2575
Trapping 37893 14 2707
Burn 32979 8 4122
Dermatitis 59530 11 5412
Asthma 38250 5 7650
Manual Handling 146629 16 9164
Group Issues
0
100,000
200,000
300,000
400,000
500,000
600,000
700,000
800,000
ULD Slips/ Trips Machinery
Injury
Dermatitis Struck By
Total Insurance Costs By Category
ALSO, THE BRIDGE IS OUT AHEAD
Getting the Priorities Right !
– Suppression
– Definitions
– Manipulation
– Lost time incidents
– You get what you incentivise
Using Indicators – Incentives / Bonuses
Using Indicators - Education
–Relevance to audience
–Sufficient detail
–Prevention
Types of Indicator
Leading Indicators
Can be measured without
an incident, accident or
property damage
occurring
Are useful in being able to
predict or prevent future
events.
Often are linked to
processes or targeted
activities
Lagging Indicators
Are indicators that show
the number and or
severity of events which
have occurred.
Types of Indicator
Leading Indicators
 Safety Audits
 Behaviour
 Attitude surveys
 Inspections
Lagging Indicators
 Lost time incidents
 Minor accidents
 Days lost
 Absence data
 Property damage
How Many Accidents, Near
Misses and Unsafe Behaviours in
this Clip ?
How Many ?
What does this illustrate ?
What is the Ideal Indicator?
 Leading Indicator
 Be under the control of individuals
 Be positive
 Be easily understood
 Be relatively easy to collect.
 Consist of a large volume of data which
can be fed back
 Reflect the current situation not historic
ones
The Most Common Measure
of Performance
ACCIDENT
DATA !
Absolute measure of performance
Relatively easy to collect
Allows Benchmarking
Reporting rate can be verified
Easily understood
Focus for discussion
Provide a basis for improvement
Help to identify trends
Accident Statistics
(Positive points)
Potential Pitfalls of
Benchmarking
Example Lost Time Incident Frequency Rate (LTIF)
Most Common
Definition in UK
Accidents per 100,000
hours worked
Approximately
accidents in a working
lifetime
OHSA Definition in
US
Accidents per 200,000
hours worked
Approximately 100
employees working for
a year
Other Common
Definition
Accidents per 200,000
hours worked
If your rate is expressed as Accidents per 100,000 hrs
 Downstream measure
 Historical perspective
 Poor predictor of future events
 Random statistical variation
 Level of safety awareness affects reporting rate.
 Measurement of failure not success
 Viewed as being out of the control of the workforce
 No mention of severity
 No mention of gradually developing diseases.
Accident Statistics
(Potential issues)
1
10
30
600
Serious or Disabling Injury
MinorInjuries
PropertyDamage
Incidentswithno
visibleinjuryor
damage(near misses)
Bird’s Triangle
Texas City
Bird’s Triangle
High Potential
Accidents
Low Potential
Accidents
30
Bird’s Triangle
Process
Safety Health
Did this intervention Work ?
0
5
10
15
20
25
93/94 94/95 95/96
Accident Data 93-96
Accident Statistics
0
2
4
6
8
10
12
14
16
93/94 94/95 95/96
Minor
Lost Time
Reportable
0
20
40
60
80
100
120
140
94 95 96
Working Days Lost
Number of Days Lost Due to
Accidents
Cross Checking Reporting Rates
 First aid supplies
 Anonymous surveys
 Comparing Severity Rates (days lost per accident)
 Comparing accident triangles
‘Subjects each area of an
organisation’s
activities to a systematic critical
examination with the objective
of minimising loss.
Every component of the total system is
included’
Stranks and Dewis
Safety Audit
Safety Audits
(Positive points)
Leading indicator (Before an incident
occurs)
Compared to standard so variation obvious
Selected items can be used in personal
appraisals
Comprehensive (covers all of management
system)
Visible show of commitment
Companies familiar with other audits
Safety Audits
(Potential issues)
If used too frequently can lose impact
No reds culture
Organisations face many audits
(financial, quality etc...)
Reports can sound negative
Not easy to benchmark
Do audits adequately address the human factor?
Do audits correlate well with actual performance?
Inspections/ Sampling
(Positive points)
 Workforce involvement helps ownership
 Visibility
 Provide snap shot of current status
 Quantifiable
(Potential Issues)
 Items of strategic importance ?
 Sufficient time allowed ?
 Consistency
Training of inspectors
– What to look for
– Agree consistency
– Strategic items
– Taking responsibility – not walking past issues
– Soft Skills
•How to get below the surface
•Asking, not just looking
•What to ask
•How to ask it
How Can Inspections be Improved
Soft Skills
Using Behaviour to Improve
Safety
Measure
Behaviour
Give Positive
Feedback to
individual
Give Positive
Feedback to
Group
Train Staff
and Observers Staff Set
Targets
Results of UMIST/HSE Study
75.00
80.00
85.00
90.00
95.00
100.00 Pre Intervention
Post Intervention
Housekeeping
Scaffolding Access to
Heights
PPE Plant
81.1
84.9
88.6
85
88.4
79.1
84
86.6
88.8
84.1
Behaviour
(Positive points)
 Good predictor of safety performance
 Perceived to be controllable
 Motivational (goal setting and feedback)
 Large volume of data
 Shows commitment
 Helps change attitudes ?
Behaviour
(Potential issues)
Suitable behaviours need to be
identified in detail
Time and Effort, Time and Effort
Sustainability
 Consistency
 Framework for communication
Attitude Measurement /
Climate Measure
(adapted from RSSB web site)
Advantages •Allows all the workforce’s views to be considered.
•High profile
•Reveals current attitudes & perceptions
•Can clearly point to issues that need to be addressed.
•May identify issues in the safety management systems.
Limitations •Will not identify all issues.
•High profile raises workforce expectations about responses
•High response rates required to ensure results fully reflect
organisation’s culture – this can be difficult to achieve unless
implemented well.
•Results often do not directly identify underlying causes:
Key Performance Indicators
 They should be objective and easy to measure and
collect
 They should be relevant to the organisation or workgroup
whose performance is being measured.
 They should provide immediate and reliable indication of
the level of performance
 They should be cost efficient in terms of equipment,
personnel and additional technology required to gather
the information
 They should be understood and owned by the
organisation or workgroup whose performance is being
measured.
Examples
 Training delivered against plan
 Investigations closed within 14 days
 Number of senior management safety visits
against plan
 Delivery against plan
Health Indicators
 Process effectiveness
 Referral time
 Completion of health surveillance
 Outcome
 Attendance levels
 Days lost per FTE
 Number of specific illnesses
 Leading Indicators
 Health Impact Index (developed by the
Olympic team)
Presenting the Data
Historic annual
accident rate
Monthly spot
accident rate
Rolling annual
accident rate
LTIF - What does our performance mean?
What does an LTIF of 1
actually mean ?
Making it Relevant to the Audience
It means during their working
life on average every single
member of staff will suffer an
injury so severe that that they
will have to take time off work
Score Cards and Basket Indicators
•Score Cards
•Consolidate key data in to
one place
•All relevant graphs and
indicators for several
issues on one page
•Basket Indicators
•Attempt to combine all of
the relevant data into a single
score
•Each indicator is weighted
and then they are combined
through addition or
multiplication
•Clarity ?
Questions ?

MEASURING-SAFETY-PERFORMANCE-PPT-GOOD.pdf

  • 1.
    1 Indicators of Performancein Health and Safety Management Professor Neil Budworth EHS Director EMEA Houghton International
  • 2.
    What is tocome – Why bother with indicators – what use are they ? – The main types of indicators – Pros and cons of some well known indicators – Presenting data and benchmarking – Health and Process Safety – Summary
  • 3.
    But Before Istart Where is North ?
  • 4.
    What are Indicatorsof Performance for ? - Why Bother ? – to monitor how well the business is performing (to show the right direction) – to raise awareness or to focus attention on a particular issue – to be used as part of an incentive programme – to educate staff Each of these purposes will require different characteristics
  • 5.
    Using Indicators -Monitoring – Linked to activities – Looking for trends – Moving annual totals – Rates – Yardstick – good or bad
  • 6.
    Using Indicators Creating Awareness/ Focus – Frequency of report – Focusing a spotlight on an issue – Comparison – Understand ability 6
  • 7.
    What would youestimate the top ten insurance issues to be for an Engineering Company ?
  • 8.
    Costs No ofCases Cost per Case Deafness 2500 6 417 Cuts 9421 10 942 Slips Trips and Falls 82394 32 2575 Trapping 37893 14 2707 Burn 32979 8 4122 Dermatitis 59530 11 5412 Asthma 38250 5 7650 Manual Handling 146629 16 9164 Group Issues
  • 9.
    0 100,000 200,000 300,000 400,000 500,000 600,000 700,000 800,000 ULD Slips/ TripsMachinery Injury Dermatitis Struck By Total Insurance Costs By Category
  • 10.
    ALSO, THE BRIDGEIS OUT AHEAD Getting the Priorities Right !
  • 11.
    – Suppression – Definitions –Manipulation – Lost time incidents – You get what you incentivise Using Indicators – Incentives / Bonuses
  • 16.
    Using Indicators -Education –Relevance to audience –Sufficient detail –Prevention
  • 17.
    Types of Indicator LeadingIndicators Can be measured without an incident, accident or property damage occurring Are useful in being able to predict or prevent future events. Often are linked to processes or targeted activities Lagging Indicators Are indicators that show the number and or severity of events which have occurred.
  • 18.
    Types of Indicator LeadingIndicators  Safety Audits  Behaviour  Attitude surveys  Inspections Lagging Indicators  Lost time incidents  Minor accidents  Days lost  Absence data  Property damage
  • 19.
    How Many Accidents,Near Misses and Unsafe Behaviours in this Clip ?
  • 21.
    How Many ? Whatdoes this illustrate ?
  • 22.
    What is theIdeal Indicator?  Leading Indicator  Be under the control of individuals  Be positive  Be easily understood  Be relatively easy to collect.  Consist of a large volume of data which can be fed back  Reflect the current situation not historic ones
  • 23.
    The Most CommonMeasure of Performance ACCIDENT DATA !
  • 24.
    Absolute measure ofperformance Relatively easy to collect Allows Benchmarking Reporting rate can be verified Easily understood Focus for discussion Provide a basis for improvement Help to identify trends Accident Statistics (Positive points)
  • 25.
    Potential Pitfalls of Benchmarking ExampleLost Time Incident Frequency Rate (LTIF) Most Common Definition in UK Accidents per 100,000 hours worked Approximately accidents in a working lifetime OHSA Definition in US Accidents per 200,000 hours worked Approximately 100 employees working for a year Other Common Definition Accidents per 200,000 hours worked If your rate is expressed as Accidents per 100,000 hrs
  • 26.
     Downstream measure Historical perspective  Poor predictor of future events  Random statistical variation  Level of safety awareness affects reporting rate.  Measurement of failure not success  Viewed as being out of the control of the workforce  No mention of severity  No mention of gradually developing diseases. Accident Statistics (Potential issues)
  • 27.
    1 10 30 600 Serious or DisablingInjury MinorInjuries PropertyDamage Incidentswithno visibleinjuryor damage(near misses) Bird’s Triangle
  • 28.
  • 29.
  • 30.
  • 31.
    Did this interventionWork ? 0 5 10 15 20 25 93/94 94/95 95/96 Accident Data 93-96
  • 32.
  • 33.
    0 20 40 60 80 100 120 140 94 95 96 WorkingDays Lost Number of Days Lost Due to Accidents
  • 34.
    Cross Checking ReportingRates  First aid supplies  Anonymous surveys  Comparing Severity Rates (days lost per accident)  Comparing accident triangles
  • 35.
    ‘Subjects each areaof an organisation’s activities to a systematic critical examination with the objective of minimising loss. Every component of the total system is included’ Stranks and Dewis Safety Audit
  • 36.
    Safety Audits (Positive points) Leadingindicator (Before an incident occurs) Compared to standard so variation obvious Selected items can be used in personal appraisals Comprehensive (covers all of management system) Visible show of commitment Companies familiar with other audits
  • 37.
    Safety Audits (Potential issues) Ifused too frequently can lose impact No reds culture Organisations face many audits (financial, quality etc...) Reports can sound negative Not easy to benchmark Do audits adequately address the human factor? Do audits correlate well with actual performance?
  • 38.
    Inspections/ Sampling (Positive points) Workforce involvement helps ownership  Visibility  Provide snap shot of current status  Quantifiable (Potential Issues)  Items of strategic importance ?  Sufficient time allowed ?  Consistency
  • 39.
    Training of inspectors –What to look for – Agree consistency – Strategic items – Taking responsibility – not walking past issues – Soft Skills •How to get below the surface •Asking, not just looking •What to ask •How to ask it How Can Inspections be Improved
  • 40.
  • 41.
    Using Behaviour toImprove Safety Measure Behaviour Give Positive Feedback to individual Give Positive Feedback to Group Train Staff and Observers Staff Set Targets
  • 42.
    Results of UMIST/HSEStudy 75.00 80.00 85.00 90.00 95.00 100.00 Pre Intervention Post Intervention Housekeeping Scaffolding Access to Heights PPE Plant 81.1 84.9 88.6 85 88.4 79.1 84 86.6 88.8 84.1
  • 43.
    Behaviour (Positive points)  Goodpredictor of safety performance  Perceived to be controllable  Motivational (goal setting and feedback)  Large volume of data  Shows commitment  Helps change attitudes ?
  • 44.
    Behaviour (Potential issues) Suitable behavioursneed to be identified in detail Time and Effort, Time and Effort Sustainability  Consistency  Framework for communication
  • 45.
    Attitude Measurement / ClimateMeasure (adapted from RSSB web site) Advantages •Allows all the workforce’s views to be considered. •High profile •Reveals current attitudes & perceptions •Can clearly point to issues that need to be addressed. •May identify issues in the safety management systems. Limitations •Will not identify all issues. •High profile raises workforce expectations about responses •High response rates required to ensure results fully reflect organisation’s culture – this can be difficult to achieve unless implemented well. •Results often do not directly identify underlying causes:
  • 46.
    Key Performance Indicators They should be objective and easy to measure and collect  They should be relevant to the organisation or workgroup whose performance is being measured.  They should provide immediate and reliable indication of the level of performance  They should be cost efficient in terms of equipment, personnel and additional technology required to gather the information  They should be understood and owned by the organisation or workgroup whose performance is being measured.
  • 47.
    Examples  Training deliveredagainst plan  Investigations closed within 14 days  Number of senior management safety visits against plan  Delivery against plan
  • 48.
    Health Indicators  Processeffectiveness  Referral time  Completion of health surveillance  Outcome  Attendance levels  Days lost per FTE  Number of specific illnesses  Leading Indicators  Health Impact Index (developed by the Olympic team)
  • 49.
    Presenting the Data Historicannual accident rate Monthly spot accident rate Rolling annual accident rate
  • 50.
    LTIF - Whatdoes our performance mean? What does an LTIF of 1 actually mean ? Making it Relevant to the Audience It means during their working life on average every single member of staff will suffer an injury so severe that that they will have to take time off work
  • 51.
    Score Cards andBasket Indicators •Score Cards •Consolidate key data in to one place •All relevant graphs and indicators for several issues on one page •Basket Indicators •Attempt to combine all of the relevant data into a single score •Each indicator is weighted and then they are combined through addition or multiplication •Clarity ?
  • 52.