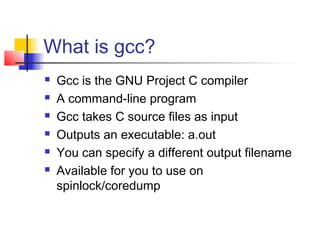
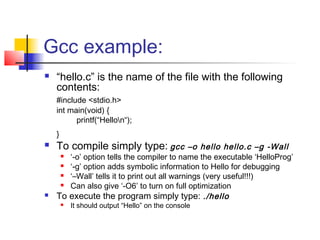
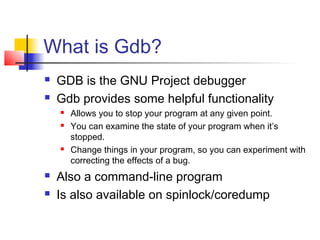
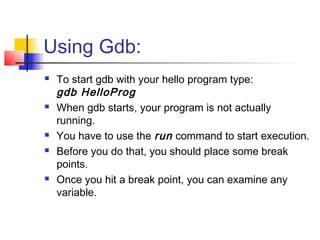
Compiling & Debugging

        Quick tutorial
What is gcc?
   Gcc is the GNU Project C compiler
   A command-line program
   Gcc takes C source files as input
   Outputs an executable: a.out
   You can specify a different output filename
   Available for you to use on
    spinlock/coredump
Gcc example:
   “hello.c” is the name of the file with the following
    contents:
    #include <stdio.h>
    int main(void) {
          printf(“Hellon“);
    }
   To compile simply type: gcc               –o hello hello.c –g -Wall
      ‘-o’ option tells the compiler to name the executable ‘HelloProg’
      ‘-g’ option adds symbolic information to Hello for debugging
      ‘–Wall’ tells it to print out all warnings (very useful!!!)
      Can also give ‘-O6’ to turn on full optimization
   To execute the program simply type: ./hello
           It should output “Hello” on the console
What is Gdb?
   GDB is the GNU Project debugger
   Gdb provides some helpful functionality
       Allows you to stop your program at any given point.
       You can examine the state of your program when it’s
        stopped.
       Change things in your program, so you can experiment with
        correcting the effects of a bug.
   Also a command-line program
   Is also available on spinlock/coredump
Using Gdb:
   To start gdb with your hello program type:
    gdb HelloProg
   When gdb starts, your program is not actually
    running.
   You have to use the run command to start execution.
   Before you do that, you should place some break
    points.
   Once you hit a break point, you can examine any
    variable.
Useful gdb commands
   run command-line-arguments
       Begin execution of your program with arguments
   break place
       place can be the name of a function or a line number
       For example: break main will stop execution at the first
        instruction of your program
   delete N
       Removes breakpoints, where N is the number of the
        breakpoint
   step
       Executes current instruction and stops on the next one
Gdb commands cont.
   next
       Same as step except this doesn’t step into functions
   print E
       Prints the value of any variable in your program when you
        are at a breakpoint, where E is the name of the variable you
        want to print
   help command
       Gives you more information about any command or all if you
        leave out command
   quit
       Exit gdb

Gccgdb

  • 1.
    Compiling & Debugging Quick tutorial
  • 2.
    What is gcc?  Gcc is the GNU Project C compiler  A command-line program  Gcc takes C source files as input  Outputs an executable: a.out  You can specify a different output filename  Available for you to use on spinlock/coredump
  • 3.
    Gcc example:  “hello.c” is the name of the file with the following contents: #include <stdio.h> int main(void) { printf(“Hellon“); }  To compile simply type: gcc –o hello hello.c –g -Wall  ‘-o’ option tells the compiler to name the executable ‘HelloProg’  ‘-g’ option adds symbolic information to Hello for debugging  ‘–Wall’ tells it to print out all warnings (very useful!!!)  Can also give ‘-O6’ to turn on full optimization  To execute the program simply type: ./hello  It should output “Hello” on the console
  • 4.
    What is Gdb?  GDB is the GNU Project debugger  Gdb provides some helpful functionality  Allows you to stop your program at any given point.  You can examine the state of your program when it’s stopped.  Change things in your program, so you can experiment with correcting the effects of a bug.  Also a command-line program  Is also available on spinlock/coredump
  • 5.
    Using Gdb:  To start gdb with your hello program type: gdb HelloProg  When gdb starts, your program is not actually running.  You have to use the run command to start execution.  Before you do that, you should place some break points.  Once you hit a break point, you can examine any variable.
  • 6.
    Useful gdb commands  run command-line-arguments  Begin execution of your program with arguments  break place  place can be the name of a function or a line number  For example: break main will stop execution at the first instruction of your program  delete N  Removes breakpoints, where N is the number of the breakpoint  step  Executes current instruction and stops on the next one
  • 7.
    Gdb commands cont.  next  Same as step except this doesn’t step into functions  print E  Prints the value of any variable in your program when you are at a breakpoint, where E is the name of the variable you want to print  help command  Gives you more information about any command or all if you leave out command  quit  Exit gdb