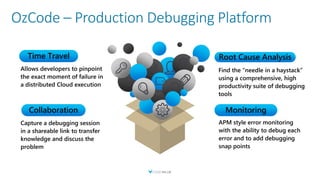
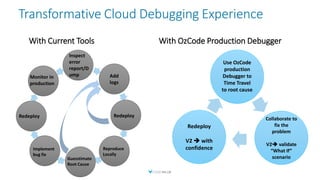
This document discusses debugging techniques for production environments. It covers using debuggers and symbol files to debug running processes, remote debugging to debug processes on other machines, analyzing core dumps to debug crashed processes postmortem, and snapshot debugging using Application Insights to capture the state of an application during errors. It also introduces the OzCode production debugging platform, which aims to provide a unified experience for debugging applications running in cloud, on-premise, and other complex environments.

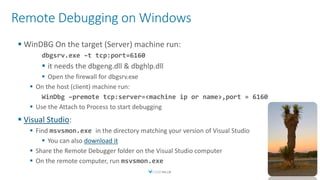
![Symbol Files
Symbols enable source code debugging
Line numbers, variable names, etc.
Generate symbols using (C++):
Linux (gcc): gcc –g
Windows (VS) : cl /zi
Generate symbols (C#):
-debug [+ | -] :{full | pdbonly}
-pdb: filename
Dump symbols (native):
Linux: nm [file] – list symbols from an object file
Windows: dumpbin /symbols [file]](https://image.slidesharecdn.com/productiondebuggingdotnetconf2019-191104174312/85/C-Production-Debugging-Made-Easy-11-320.jpg)