Download to read offline
![Ogur, E. O et al Int. Journal of Engineering Research and Applications
ISSN : 2248-9622, Vol. 3, Issue 6, Nov-Dec 2013, pp.624-629
RESEARCH ARTICLE
www.ijera.com
OPEN ACCESS
Failure Analysis of a bar Soap Extrusion Machine
Ogur, E. O1 and Mburu, J. K2
1
Department of Mechanical and Mechatronic Engineering, Technical University of Kenya, P.O. Box 52428 –
00200, Nairobi
2
Department of Mechanical Engineering, National Youth Service Engineering Institute, P.O. Box 30397 –
00100, Nairobi
Abstract
Failure occurs where a component or structure ceases to function as intended. Failure analysis is the process of
collecting and analyzing data to determine the causes of failure. It is a vital tool used in the development of new
products and for the improvement of existing products. This study investigates, using failure analysis, a bar soap
extruding machine. The extruder shaft of the machine failed and the equipment ceased to function as intended.
The extruder had a spiral screw which was welded along the shaft. There were cracks on the welded point. In
this study, destructive and non-destructive tests were conducted to establish physical properties of the failed
component. Chemical analysis was performed to determine chemical composition of the failed parts. The
analysis of data led to the conclusion that failure occurred due to poor maintenance of the equipment. The
manufacturing processes had defects which acted as sites of crack initiation and the crack propagation was
accelerated by cyclic loading.
Keywords: failure mode and effects analysis, crack propagation, magnetic particle crack detection
I.
Introduction
A failure mode and effects analysis (FMEA)
is a procedure in product development and operations
management for analysis of potential failure modes
within a system. A successful FMEA activity helps a
team to identify potential failure modes based on past
experience with similar products or processes. This
helps the designer to design those failures out of the
system with minimum effort and resource expenditure,
thereby, reducing development time and costs. It is
widely used in manufacturing industries in various
phases of the product life cycle and is now
increasingly finding use in the service industry.
FMEA are any errors or defects in a process design or
item especially those that affect the customer and can
be potential or actual. Effects analysis refers to
studying the consequences of these failures. Although
initially developed by the military, FMEA
methodology is now extensively used in a variety of
industries including semiconductor processing, food
service, plastics, software and health care. It is
integrated into the Advanced Product Quality
Planning (APQP) process development phases. Each
potential cause must be considered for its effect on the
product or process and based on the risk, actions are
www.ijera.com
determined and risks revisited after actions are
complete. Failure analysis is used during the design
stage with an aim to avoid future failures [1,2]. Later,
it is used for process control before and during the
ongoing operation of the process and continuous
throughout the life of the product or service. The
outcome of this failure analysis will develop actions to
prevent or reduce the severity or likelihood of failure
of the bar soap extruding machine. It may be used to
evaluate risk management priorities for mitigating
known threat vulnerabilities.
II.
Statement of the Problem
During an exhibition, the bar soap extruding
machine failed and almost caused a fatal accident. The
extruding shaft of the machine developed a crack near
the coupling of the extruder and the drive motor shaft.
The spiral which was welded along the length of the
shaft developed cracks at the welded joint. The
purpose of this study was to establish the root causes
of failure of the bar soap machine so as to prevent
future occurrence. The study entailed completing a
conclusive failure analysis.
Investigations were
carried out using a systematic approach similar to that
outlined in Fig. 1.
624 | P a g e](https://image.slidesharecdn.com/dc36624629-131122002927-phpapp01/85/Dc36624629-1-320.jpg)
![Ogur, E. O et al Int. Journal of Engineering Research and Applications
ISSN : 2248-9622, Vol. 3, Issue 6, Nov-Dec 2013, pp.624-629
RESEARCH ARTICLE
www.ijera.com
OPEN ACCESS
Failure Analysis of a bar Soap Extrusion Machine
Ogur, E. O1 and Mburu, J. K2
1
Department of Mechanical and Mechatronic Engineering, Technical University of Kenya, P.O. Box 52428 –
00200, Nairobi
2
Department of Mechanical Engineering, National Youth Service Engineering Institute, P.O. Box 30397 –
00100, Nairobi
Abstract
Failure occurs where a component or structure ceases to function as intended. Failure analysis is the process of
collecting and analyzing data to determine the causes of failure. It is a vital tool used in the development of new
products and for the improvement of existing products. This study investigates, using failure analysis, a bar soap
extruding machine. The extruder shaft of the machine failed and the equipment ceased to function as intended.
The extruder had a spiral screw which was welded along the shaft. There were cracks on the welded point. In
this study, destructive and non-destructive tests were conducted to establish physical properties of the failed
component. Chemical analysis was performed to determine chemical composition of the failed parts. The
analysis of data led to the conclusion that failure occurred due to poor maintenance of the equipment. The
manufacturing processes had defects which acted as sites of crack initiation and the crack propagation was
accelerated by cyclic loading.
Keywords: failure mode and effects analysis, crack propagation, magnetic particle crack detection
I.
Introduction
A failure mode and effects analysis (FMEA)
is a procedure in product development and operations
management for analysis of potential failure modes
within a system. A successful FMEA activity helps a
team to identify potential failure modes based on past
experience with similar products or processes. This
helps the designer to design those failures out of the
system with minimum effort and resource expenditure,
thereby, reducing development time and costs. It is
widely used in manufacturing industries in various
phases of the product life cycle and is now
increasingly finding use in the service industry.
FMEA are any errors or defects in a process design or
item especially those that affect the customer and can
be potential or actual. Effects analysis refers to
studying the consequences of these failures. Although
initially developed by the military, FMEA
methodology is now extensively used in a variety of
industries including semiconductor processing, food
service, plastics, software and health care. It is
integrated into the Advanced Product Quality
Planning (APQP) process development phases. Each
potential cause must be considered for its effect on the
product or process and based on the risk, actions are
www.ijera.com
determined and risks revisited after actions are
complete. Failure analysis is used during the design
stage with an aim to avoid future failures [1,2]. Later,
it is used for process control before and during the
ongoing operation of the process and continuous
throughout the life of the product or service. The
outcome of this failure analysis will develop actions to
prevent or reduce the severity or likelihood of failure
of the bar soap extruding machine. It may be used to
evaluate risk management priorities for mitigating
known threat vulnerabilities.
II.
Statement of the Problem
During an exhibition, the bar soap extruding
machine failed and almost caused a fatal accident. The
extruding shaft of the machine developed a crack near
the coupling of the extruder and the drive motor shaft.
The spiral which was welded along the length of the
shaft developed cracks at the welded joint. The
purpose of this study was to establish the root causes
of failure of the bar soap machine so as to prevent
future occurrence. The study entailed completing a
conclusive failure analysis.
Investigations were
carried out using a systematic approach similar to that
outlined in Fig. 1.
624 | P a g e](https://image.slidesharecdn.com/dc36624629-131122002927-phpapp01/75/Dc36624629-1-2048.jpg)
![Ogur, E. O et al Int. Journal of Engineering Research and Application
ISSN : 2248-9622, Vol. 3, Issue 6, Nov-Dec 2013, pp.01-05
www.ijera.com
Fig. 1: Flow diagram of failure analysis procedure [3]
III.
Objectives of the study
The overall objective of this study was to
investigate causes of failure of the bar soap extruding
machine.
The study addressed the following specific objectives:
1.
Investigating the factors that contributed to
failure of the bar soap machine
2.
Performing destructive and non-destructive
tests on the failed parts
3.
Examining failure modes by which the
machine failed
IV.
Significance of the Study
FMEA and prevention are important element
in every design consideration. It is important to
undertake failure analysis in order to improve on
performance of a component and improve its
reliability. Failure can be catastrophic and may lead
to loss of life and property. The study of failure modes
and their prevention is an important integral in safety
design. The findings of failure analysis can be used by
insurance companies to calculate the risks involved in
insuring various components and structures.
Metallurgical failure analysis plays a critical role in
determination of sequence of failure, and ultimately in
identification of the causes of failure of the bar soap
extruding machine.
V.
Materials and Methods
The study was conducted using an
experiment. The following activities were done to
achieve the objectives of this study. A preliminary
study of the use of machine was done on site with
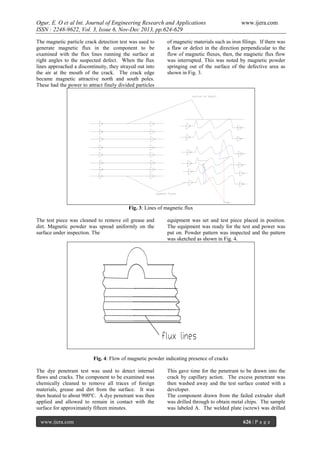
photographs taken as shown in Fig. 2. A magnetic
particle crack detection test was performed and then a
dye penetrant test was then conducted. This was
followed was by a chemical analysis of the sample.
Mechanical tests including the Brinell, Charpy and
Tensile tests were performed.
Fig 2: The extruder shaft welded screw joint
www.ijera.com
625 | P a g e](https://image.slidesharecdn.com/dc36624629-131122002927-phpapp01/85/Dc36624629-2-320.jpg)
![Ogur, E. O et al Int. Journal of Engineering Research and Application
ISSN : 2248-9622, Vol. 3, Issue 6, Nov-Dec 2013, pp.01-05
P
where
value
P
Diameter of indentation d
Brinell hardness number HB
E
A
=
Charpy
impact
E
=
Energy used in
breaking test piece
A
=
Cross
sectional
area of the notched part
The value of the energy used in breaking the test piece
was determined by the expression;E
=
WL (cosβ
cos )
Where
E
:
Energy
for
breaking test piece
W
:
Weight
of
pendulum
L
:
Distance from axis
of rotation to centre of gravity of
Pendulum
:
Angle of fall of
pendulum
β
:
Angle of rise of
pendulum in its swing after breaking
the pendulum
The above parameters were obtained as:
W
=
261.54N
L
=
0.75m
A
=
80mm2
=
141º
Β
=
119º
The value of
E
=
261.54 x 0.75
(cos119º – cos141º)
=
57.34 N-m
P
Charpy impact value
E
A
= 0.716 x 10⁶ N/m
VII.
where
HB
[2]
2P
D( D D 2 d 2 )
:
Brinell hardness number
[3]
2
(kg/mm )
P
D
D
(mm)
:
:
:
Load (kg)
Diameter of steel ball (mm)
Diameter of indentation
These parameters obtained were:
Load
750kg
Diameter of steel ball
10mm
www.ijera.com
4.87mm
37.72
Conclusions and Recommendations
References
[1]
=
=
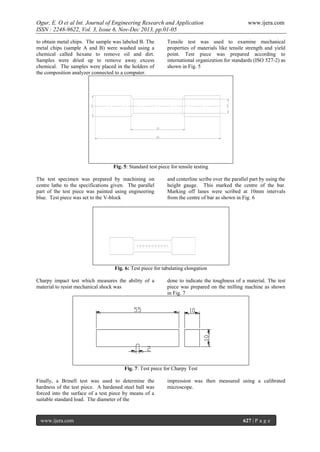
Based on the findings of this study, the
following conclusions are drawn:
Failure is said to have occurred when a
component or structure ceases to function as
intended. Visual inspection on the failed extruder
shaft of the machine revealed that the shaft was
slightly bent at the centre. The screw which was
welded along the shaft had developed cracks at
the welded joints.
The magnetic particle test performed on the failed
shaft revealed presence of cracks on the surface of
the shaft. This was confirmed by dye penetrant
testing. The developer was seen squeezing out of
the cracks. The cracks had started on the surface
and propagated through the shaft material.
Inspection of the weld revealed flaws on welding.
Undercut was visible which meant welding
current was too high. There was an overlap on
the welded joint.
This indicated the weld
penetration of deposit metal was not enough.
Test on toughness and hardness conformed to
standard properties of mild steel. The chemical
analysis tests agreed with the chemical
composition of mild steel.
Based on the study findings, the following
recommendations were:
The manufacturing and fabrication process of the
equipment should be improved.
The extruder shaft should be machined with
higher degree of surface finish.
The loading capacity should be specific to avoid
situations of either under-loading or over loading
the machine.
Determination of Brinell hardness number
Brinell hardness number HB was calculated using the
expression;HB
www.ijera.com
P
-
D
Bhaumik, S.K. (2000), Root Cause Analysis
in Engineering Failures, Transactions of the
Indian Institute of Metals, Vol. 63, No. 2-3,
pp. 297 – 299
Zamanzadeh, M, Larkin, E. and Gibbon, D,
A Re-Examination of Failure Analysis and
Root
Cause
Determination,
www.matcoinc.com (website accessed 20th
February 2013)
Davidson, T, An Introduction to Failure
Analysis for Metallurgical Engineers,
www.tms.org/students/winners/Davidson.htm
l (website accessed 20th February 2013)
-
629 | P a g e](https://image.slidesharecdn.com/dc36624629-131122002927-phpapp01/85/Dc36624629-6-320.jpg)

This document presents a failure analysis of a bar soap extrusion machine caused by a cracked extruder shaft, attributed to poor maintenance and defects during manufacturing. Various testing methods, including magnetic particle and dye penetrant tests, revealed cracks and weld flaws, while chemical and mechanical analyses confirmed the material's properties. The findings emphasize the need for improved manufacturing processes and specific loading capacities to prevent future failures.