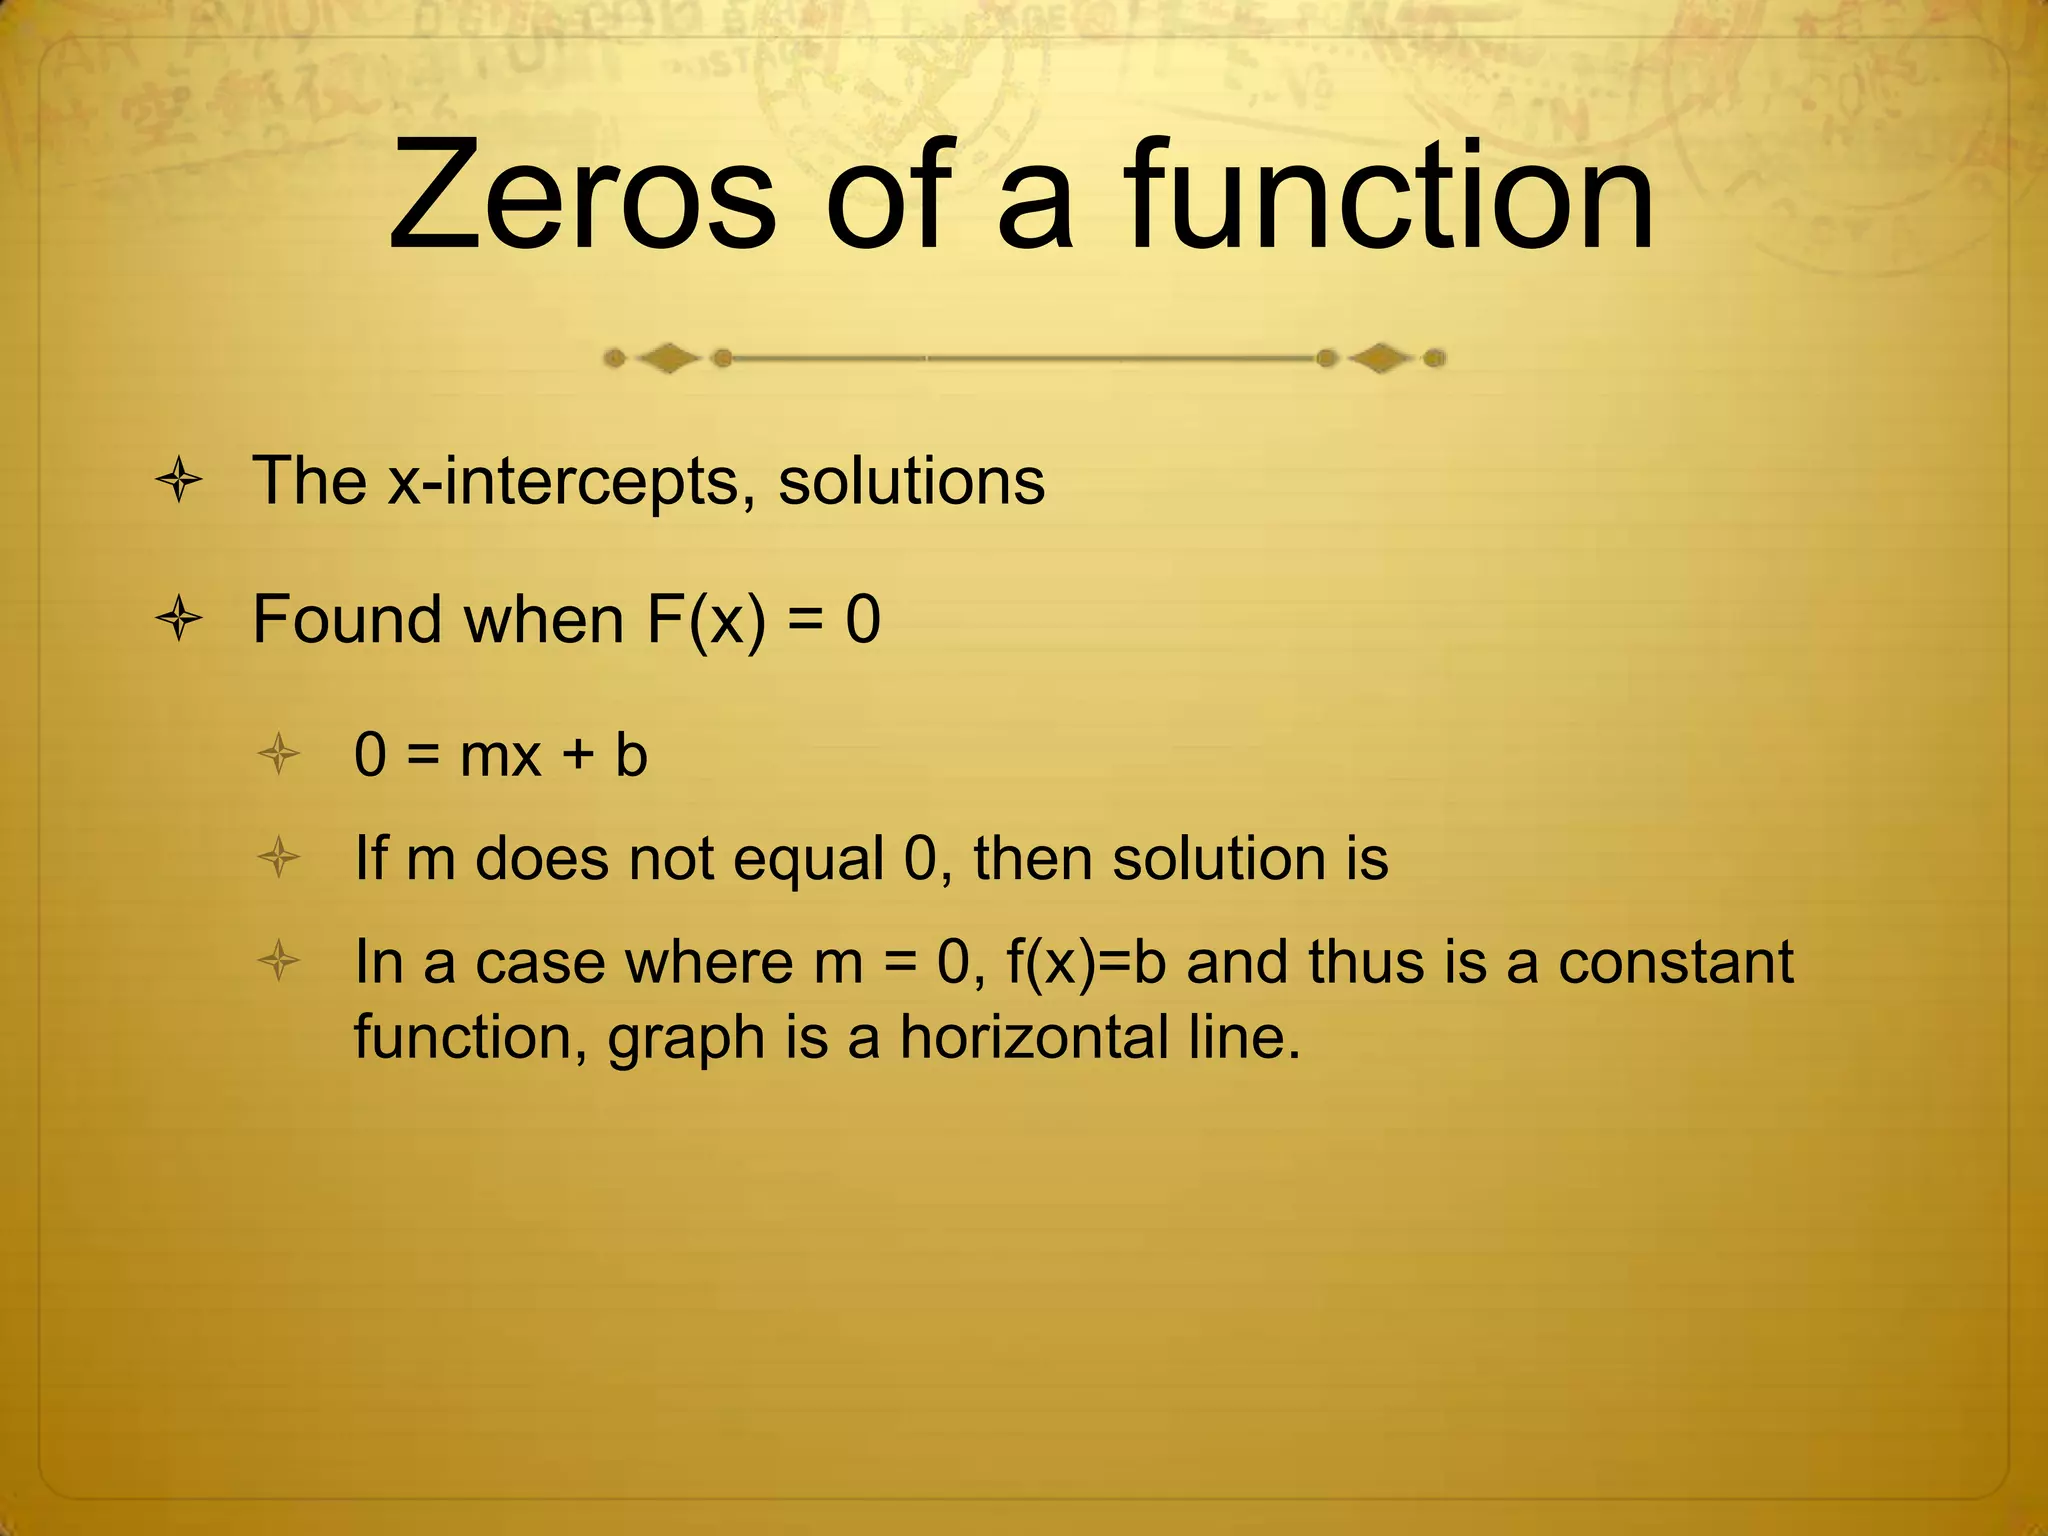
Download to read offline
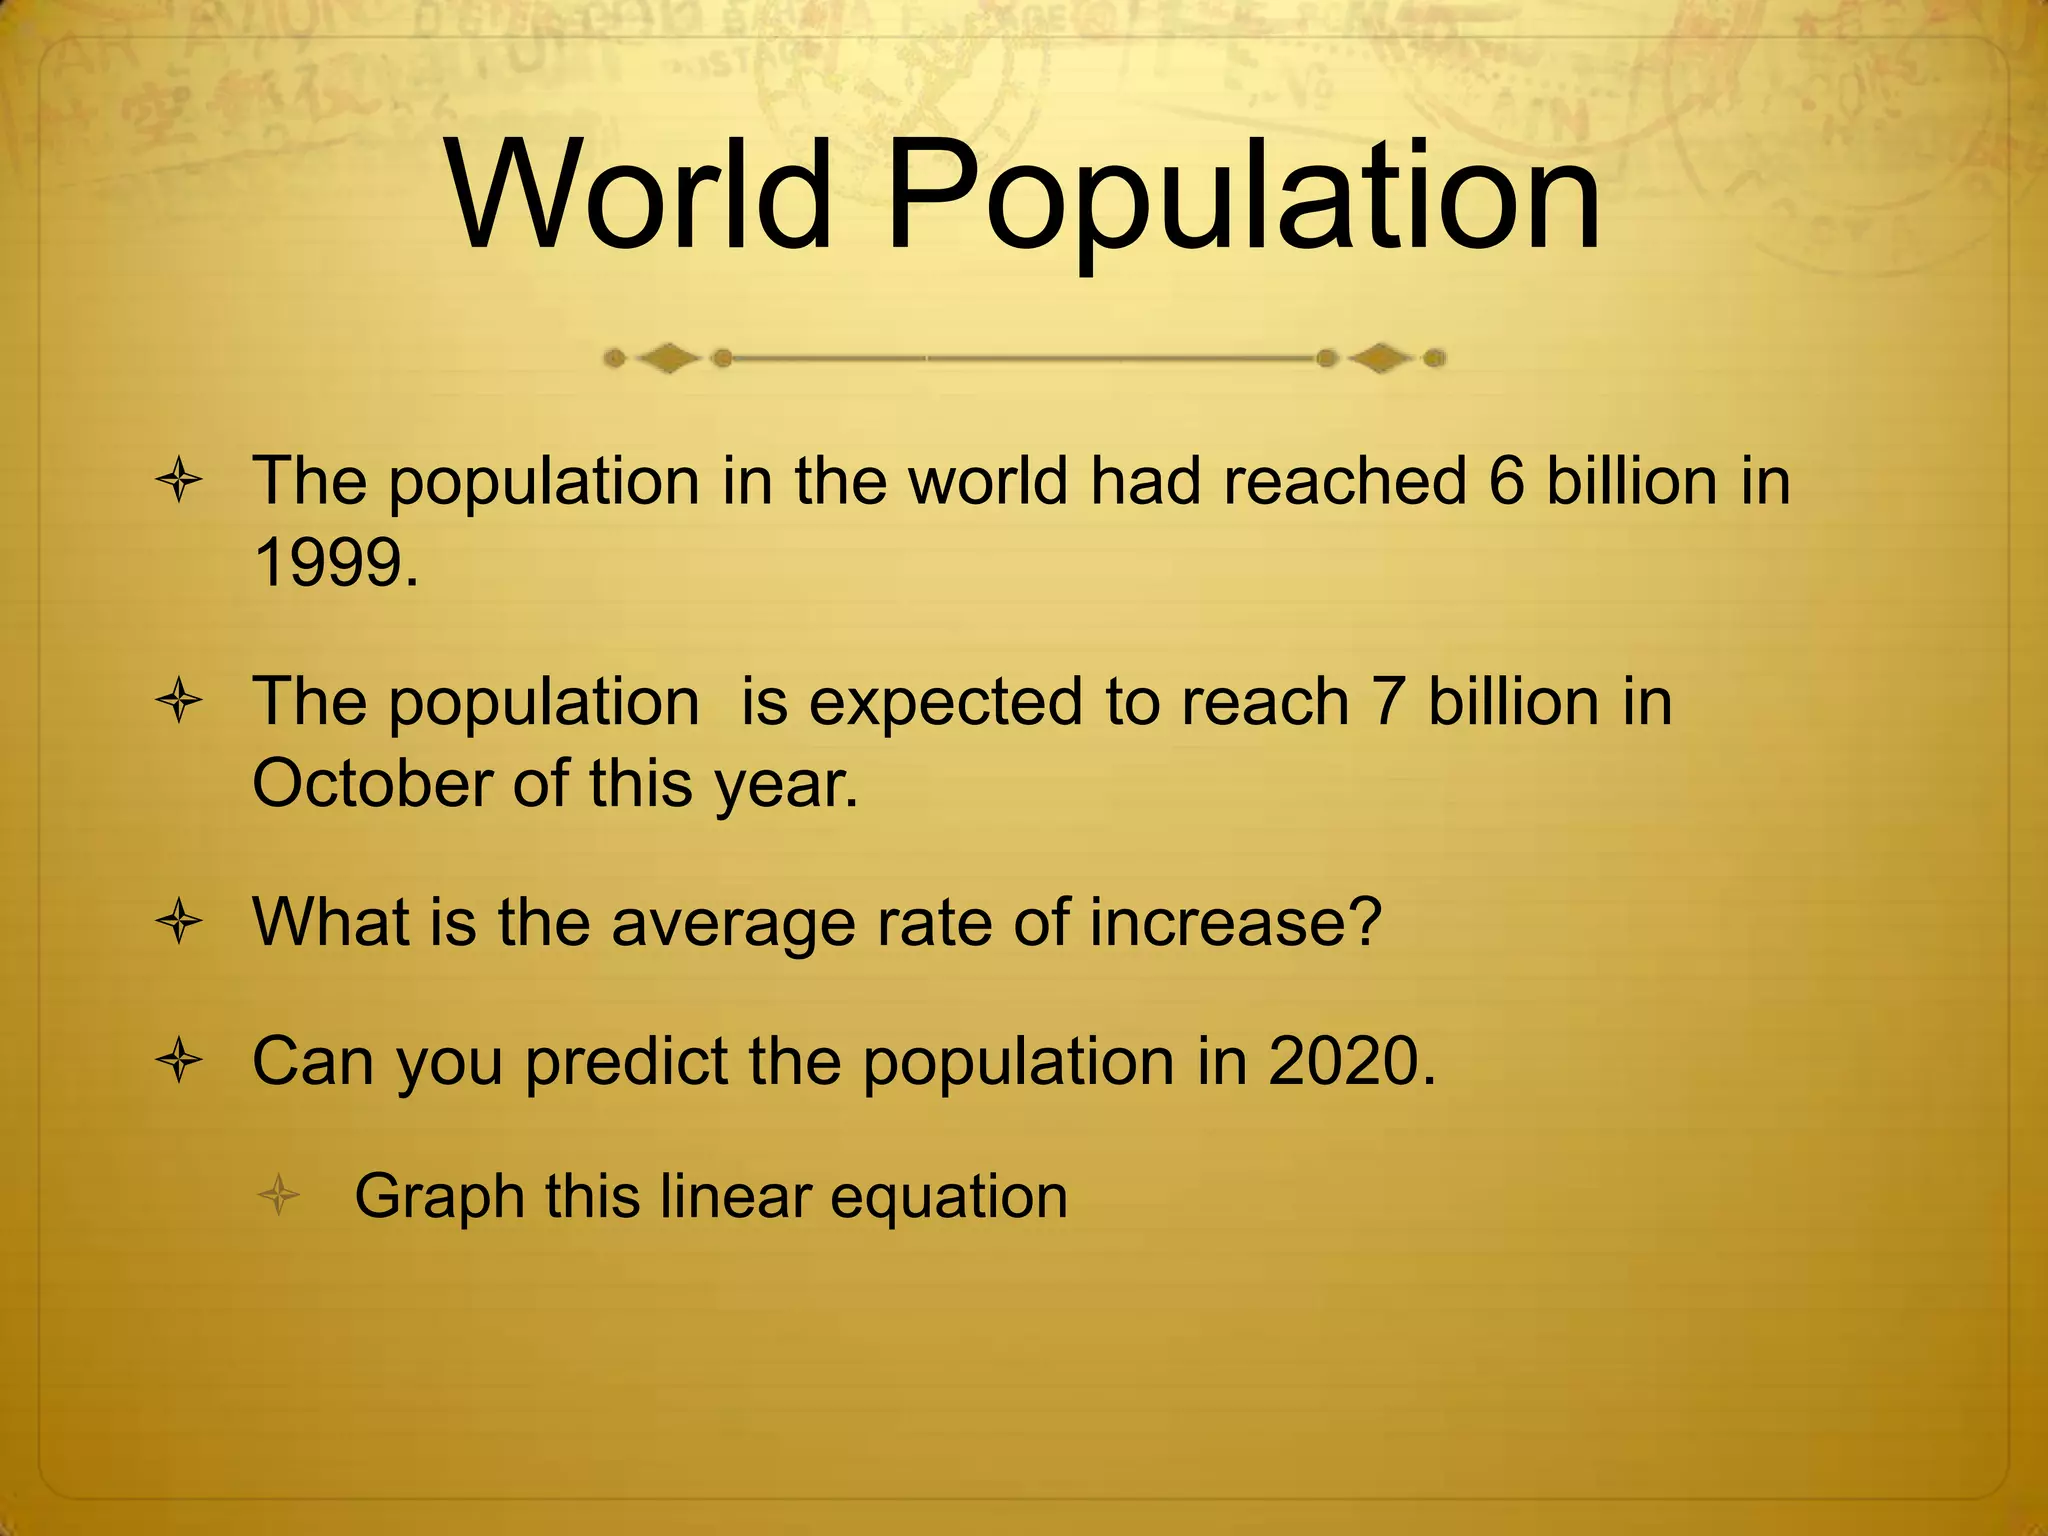
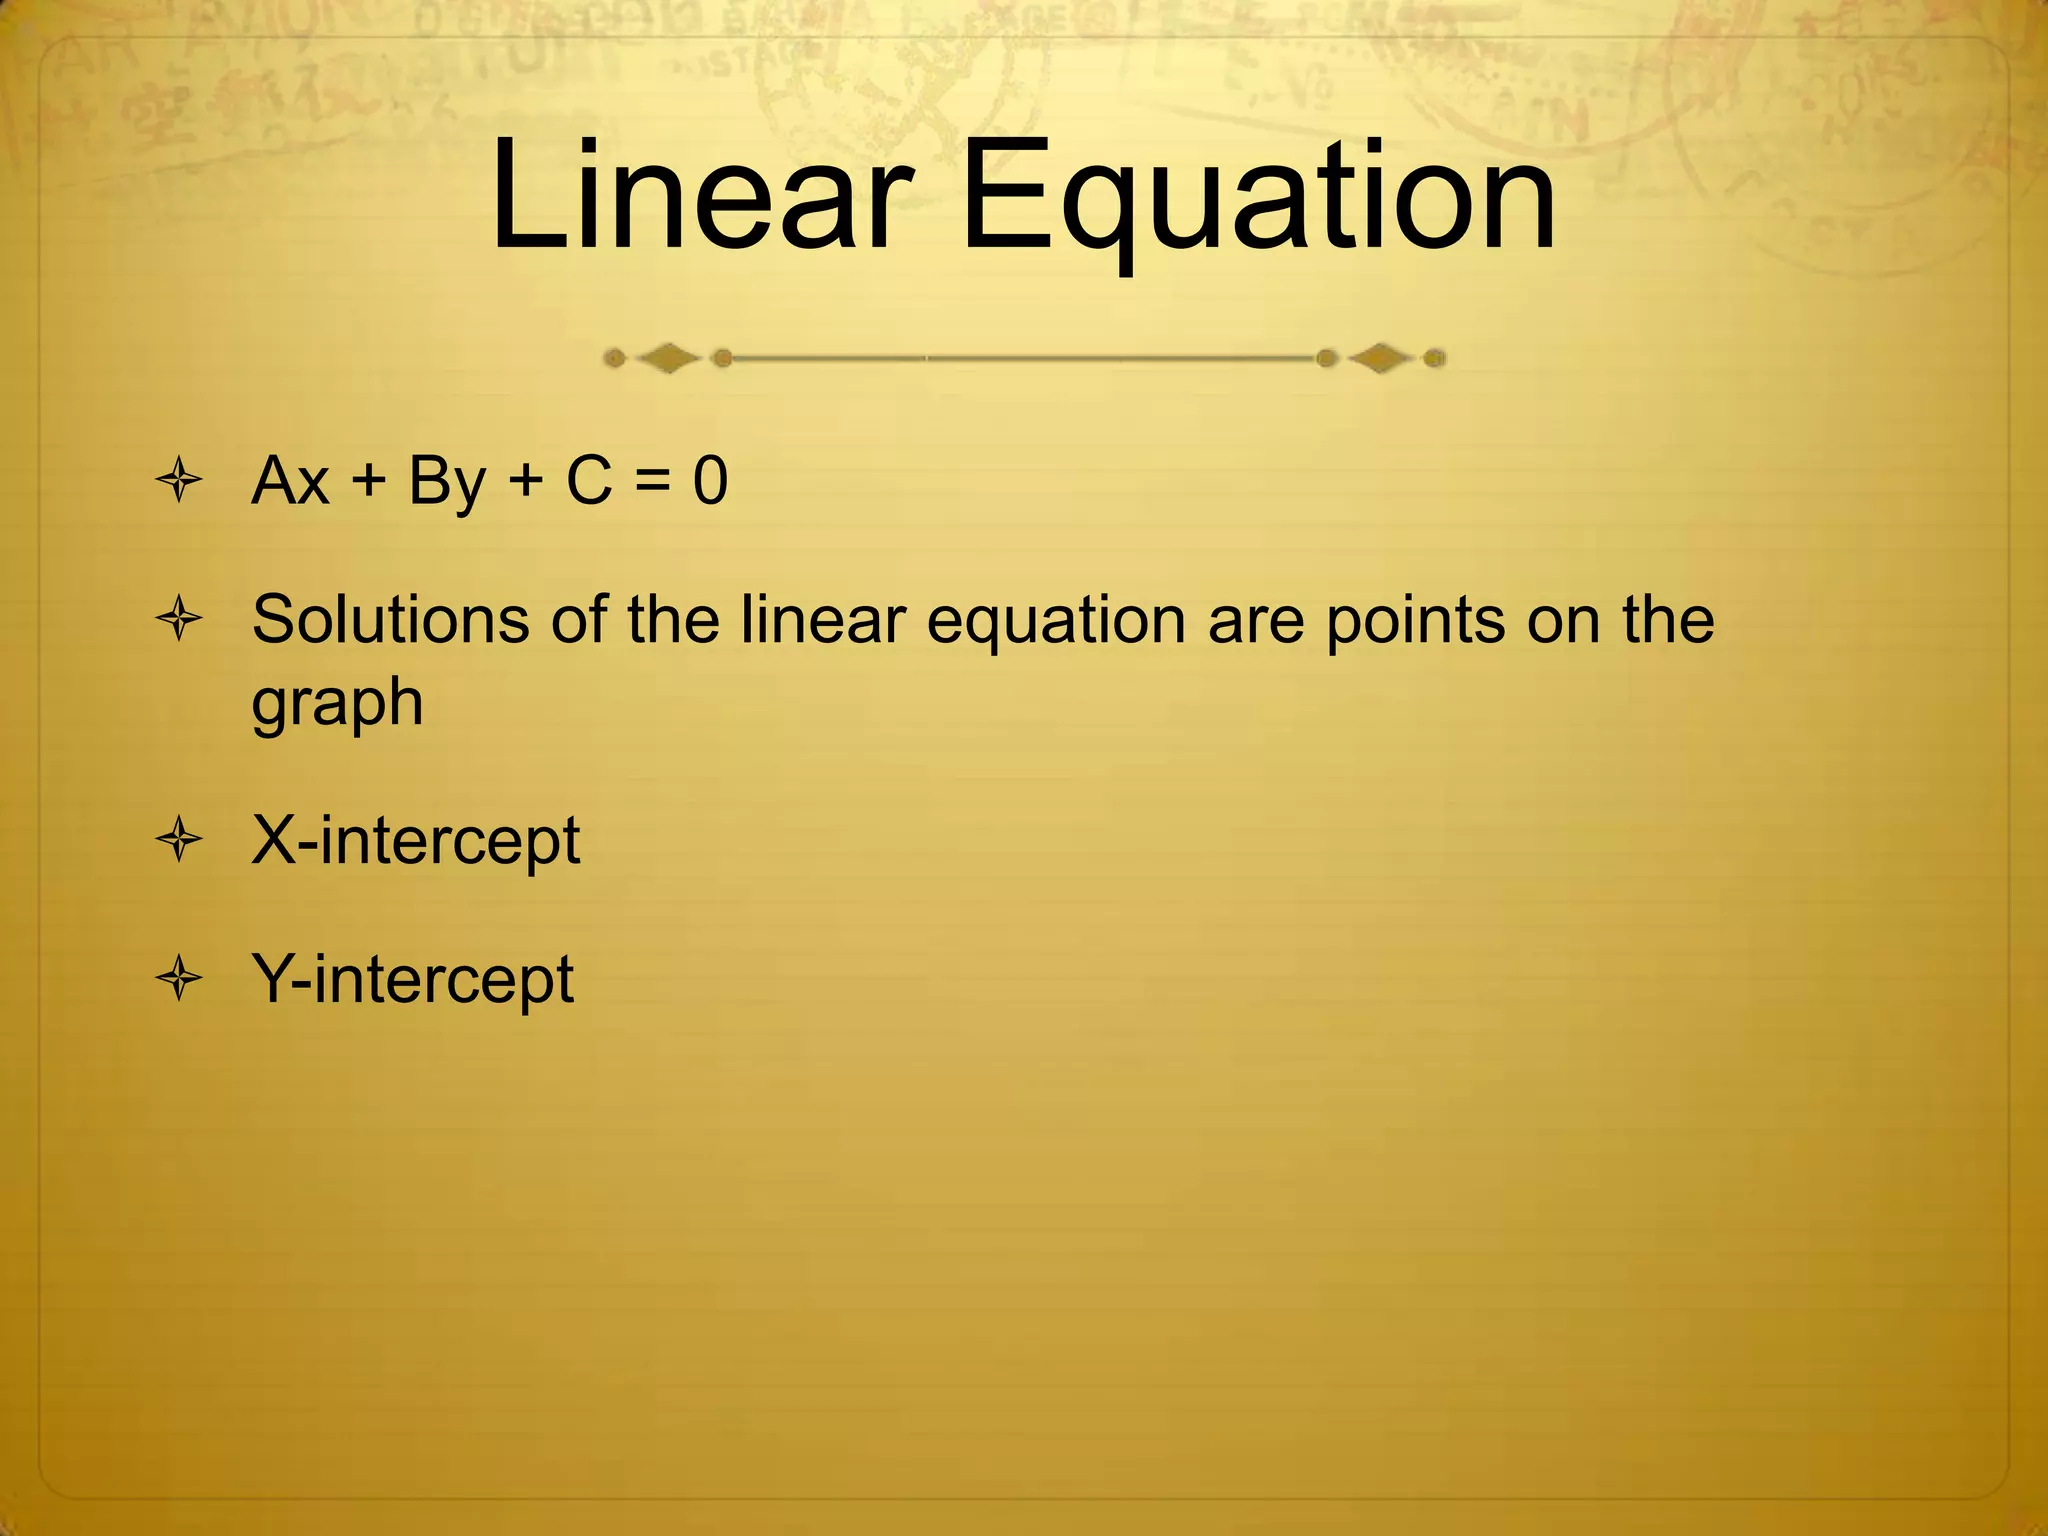
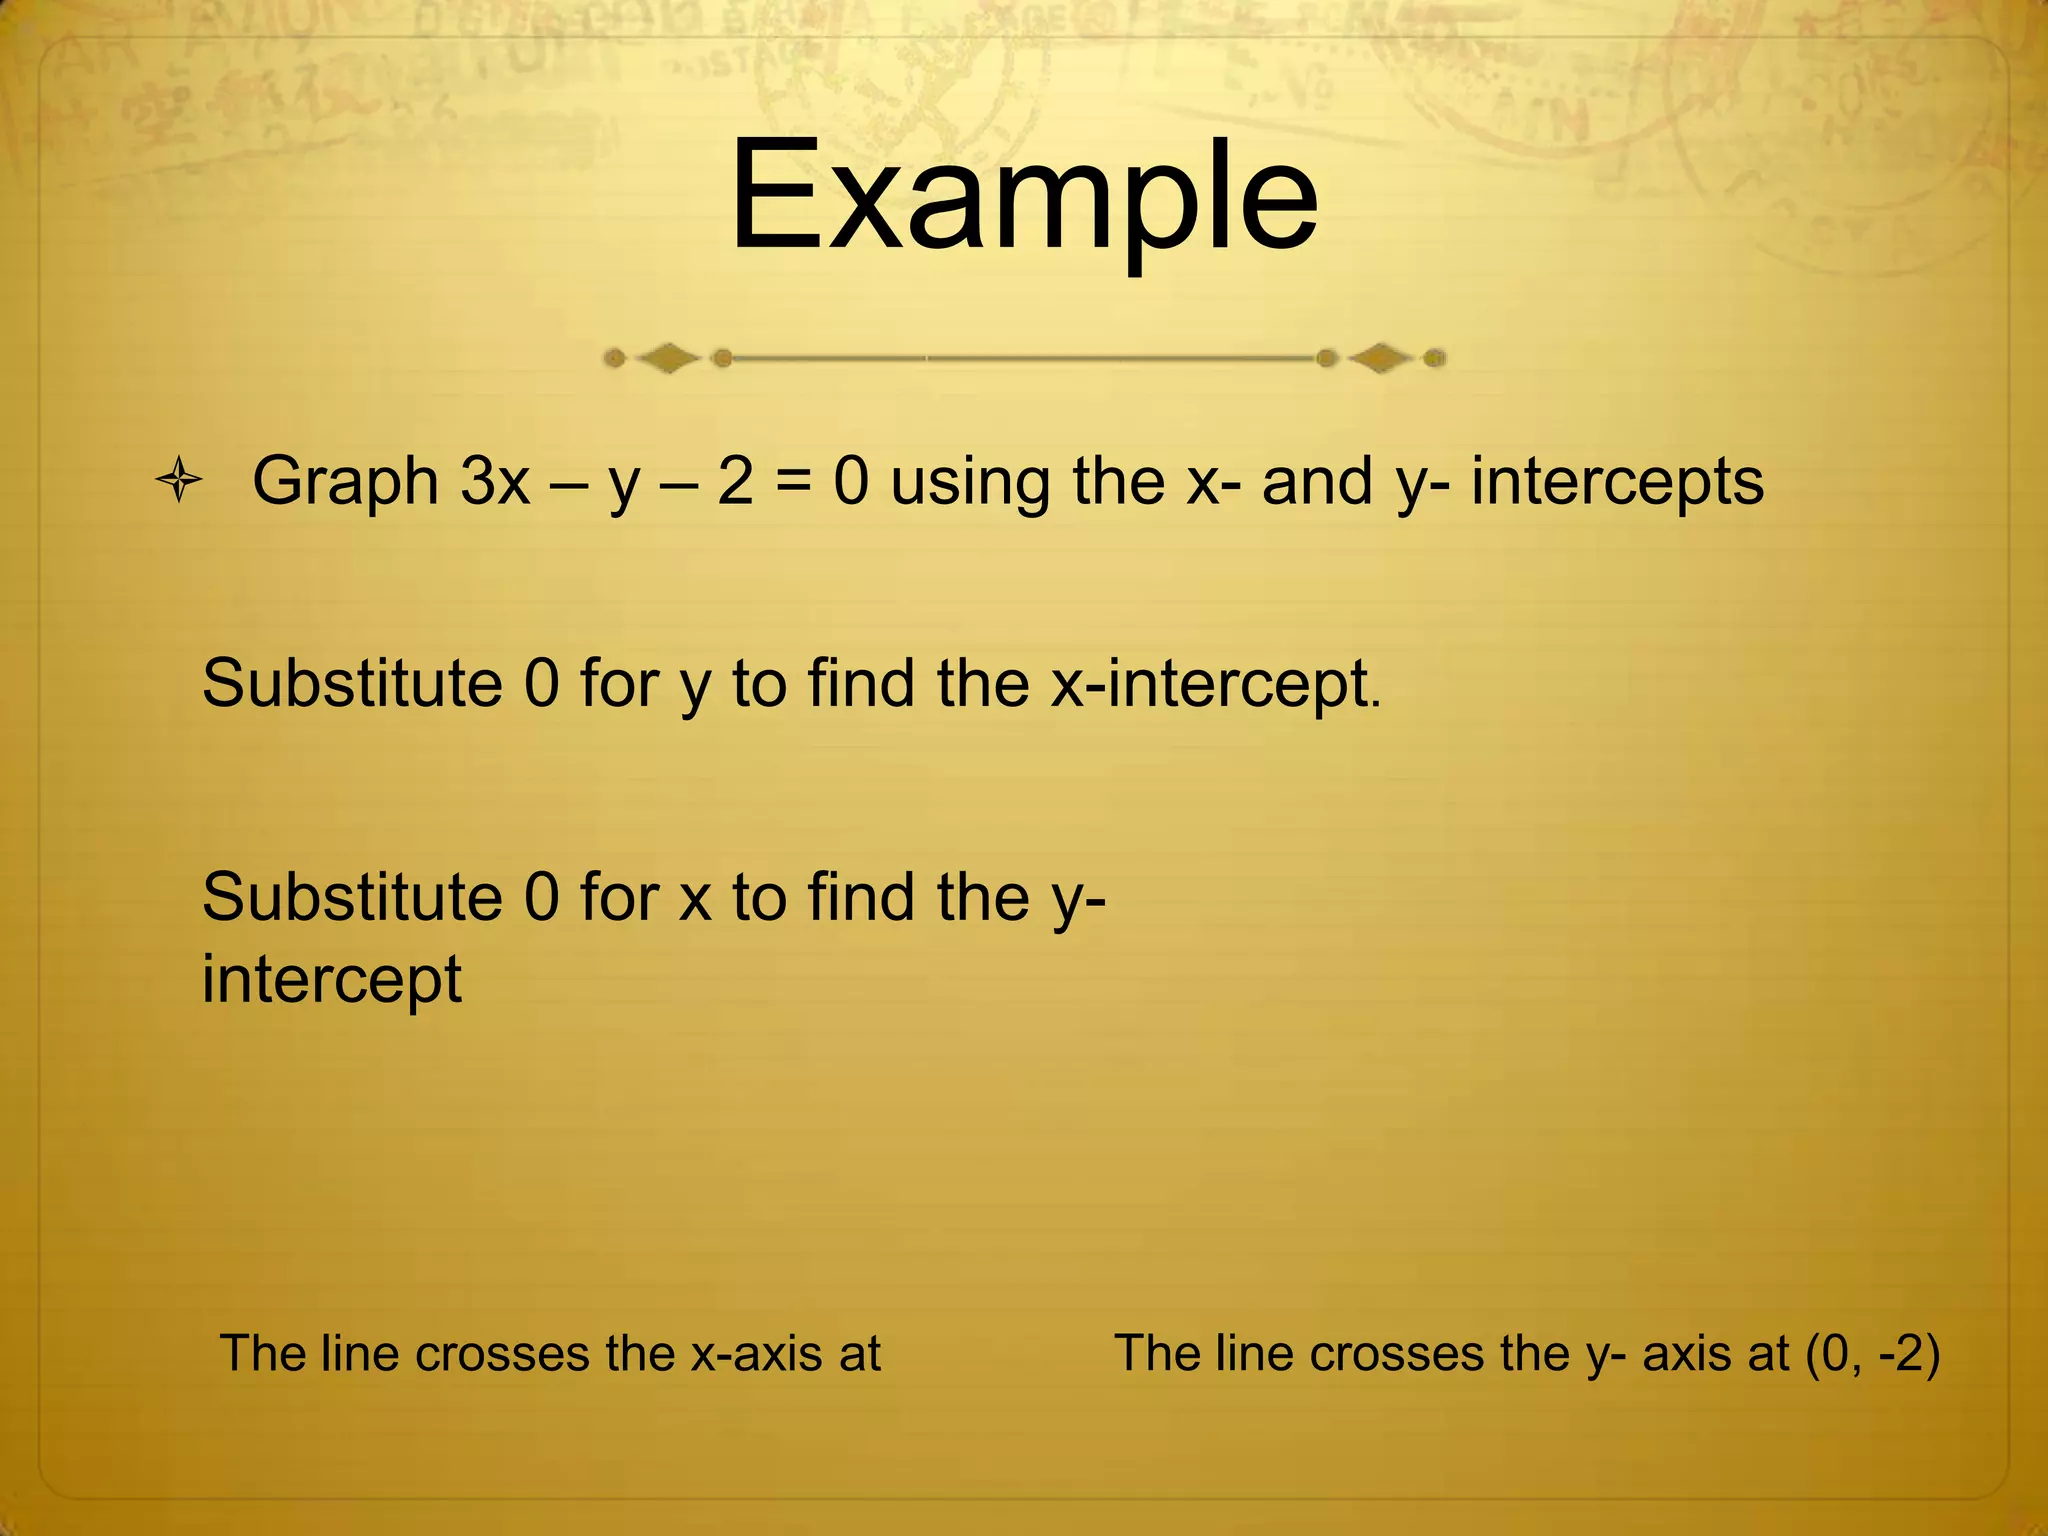

The document discusses linear equations and graphing. It provides examples of how to graph the linear equation 3x - y - 2 = 0 by finding the x-intercept and y-intercept. It also discusses using linear equations to model world population growth over time, finding the slope as the rate of increase, and using the line to predict future population levels. The key aspects covered are defining linear equations, finding intercepts to graph lines, using linear equations to model real world scenarios, and determining slope as a rate of change.


![Introduction_to_Linear_Equation[1].pdf Algebra 1](https://cdn.slidesharecdn.com/ss_thumbnails/introductiontolinearequation1-241214102404-e9b93535-thumbnail.jpg?width=640&height=640&fit=bounds)


