Download to read offline


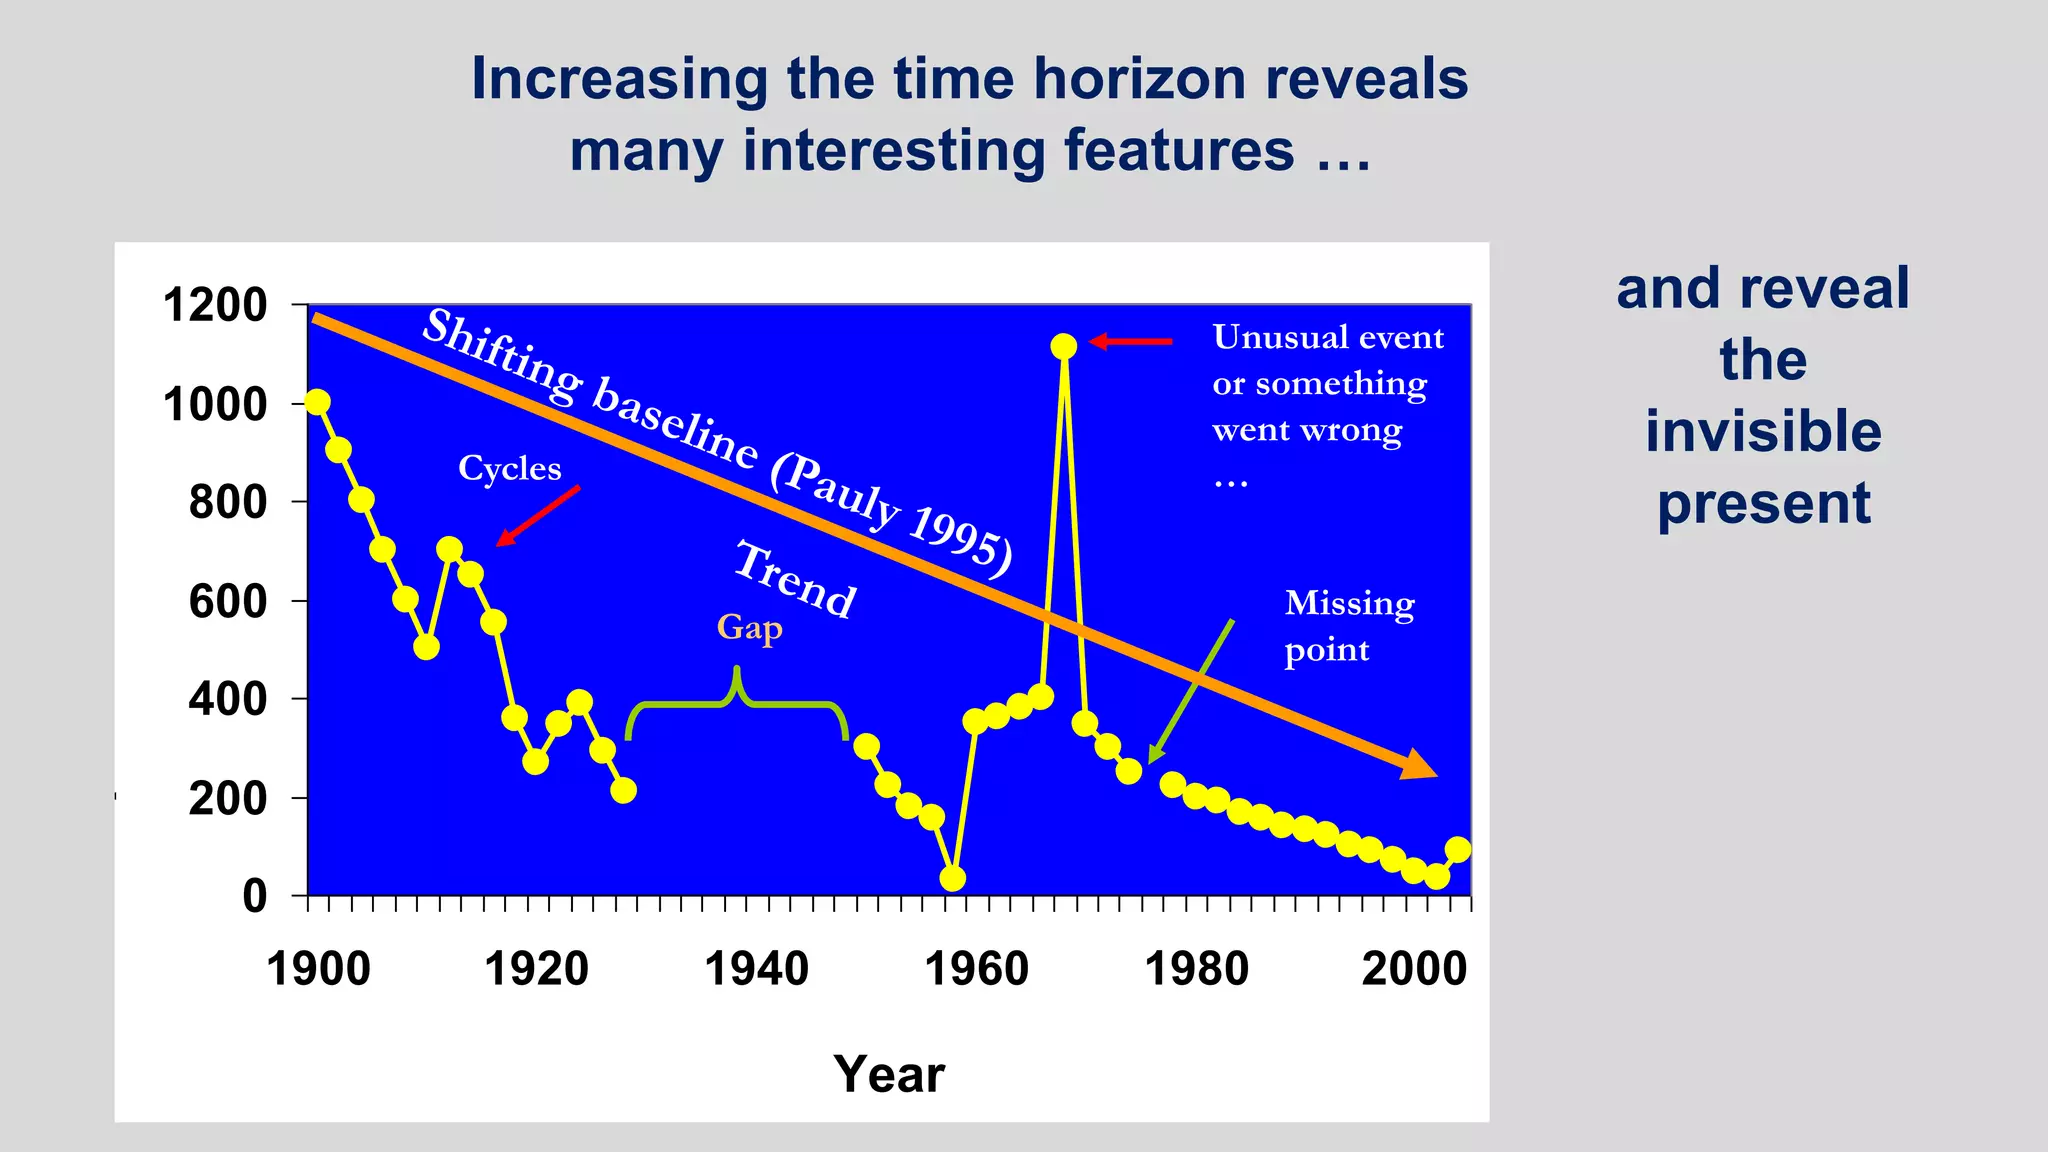


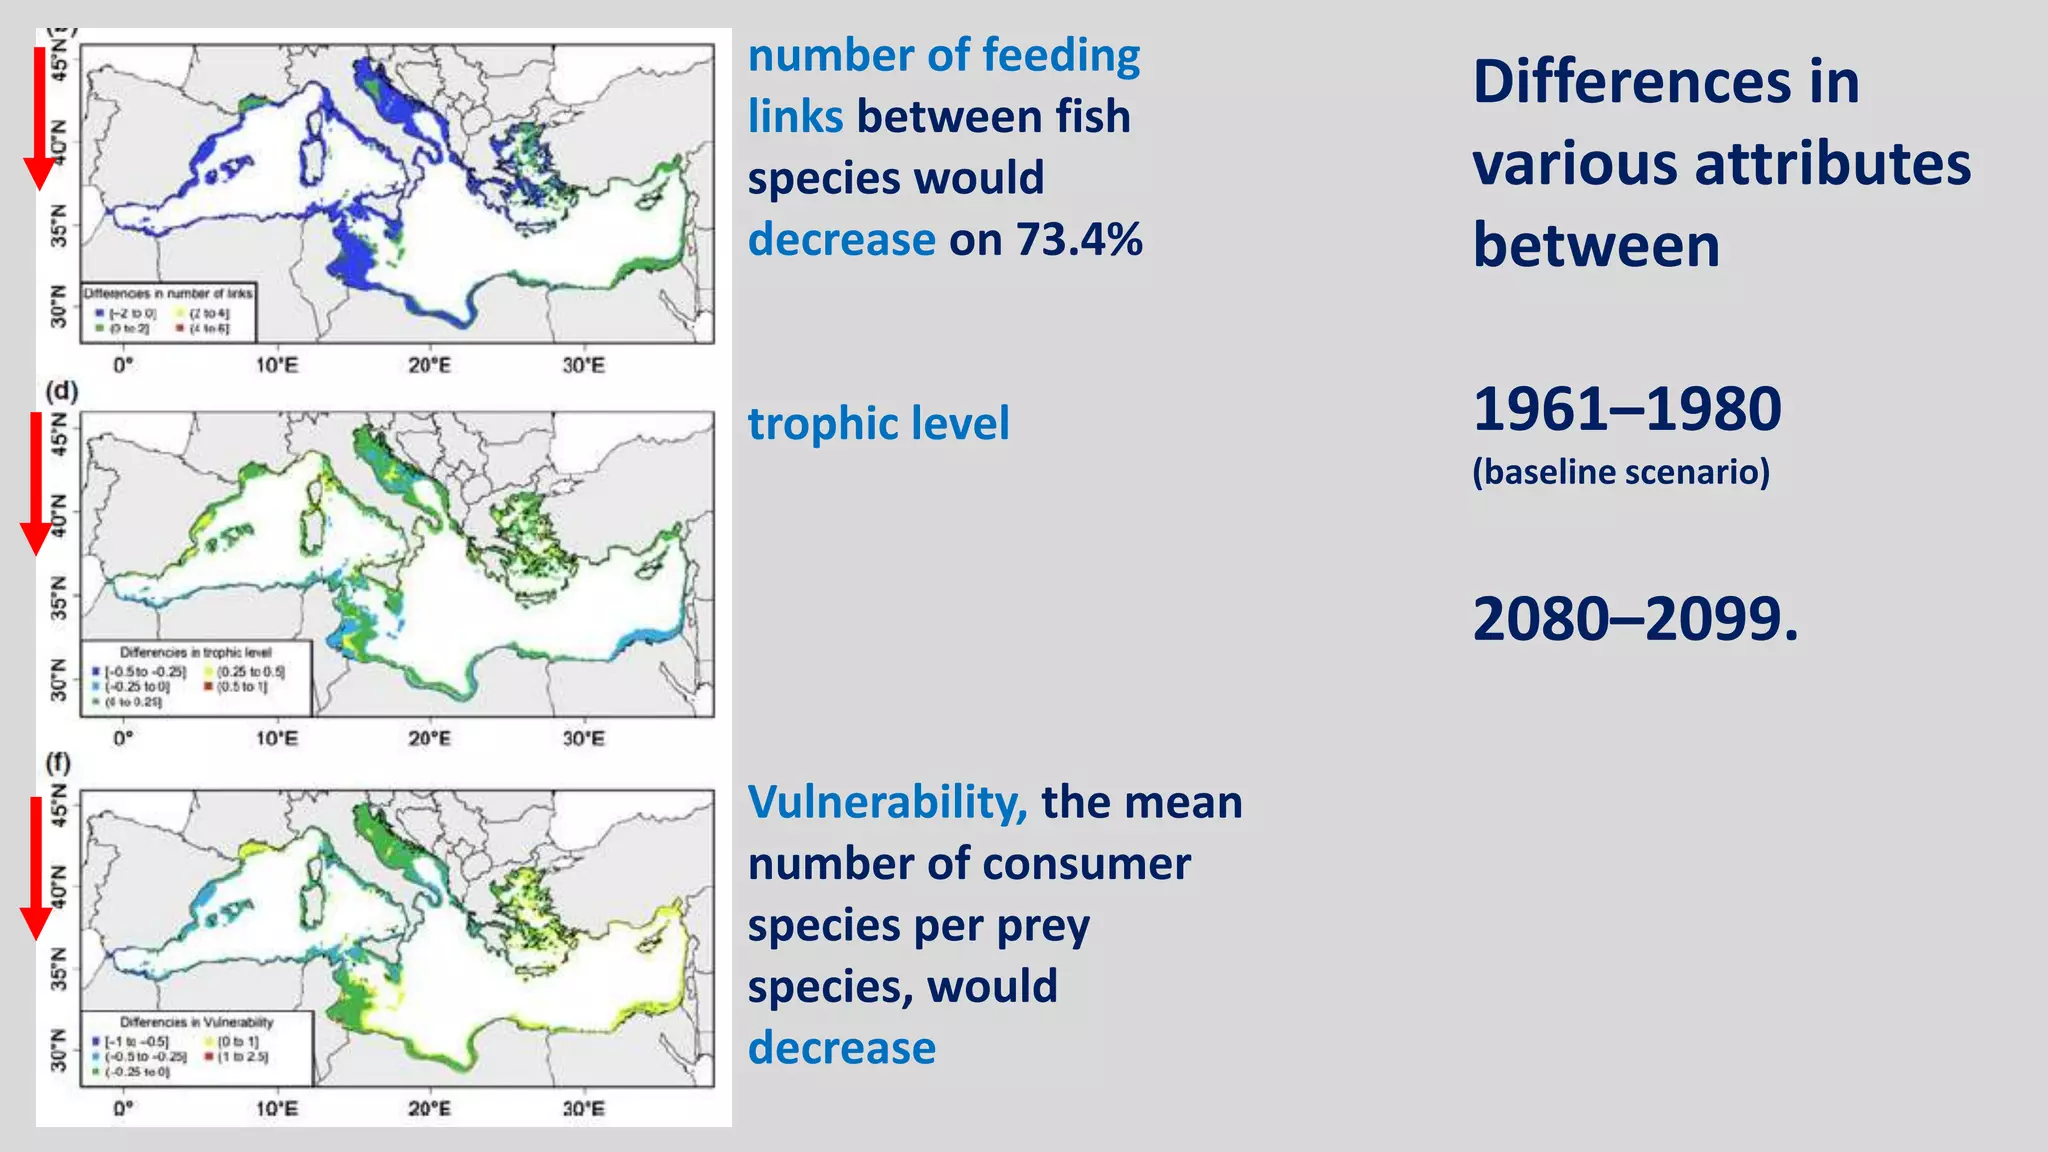
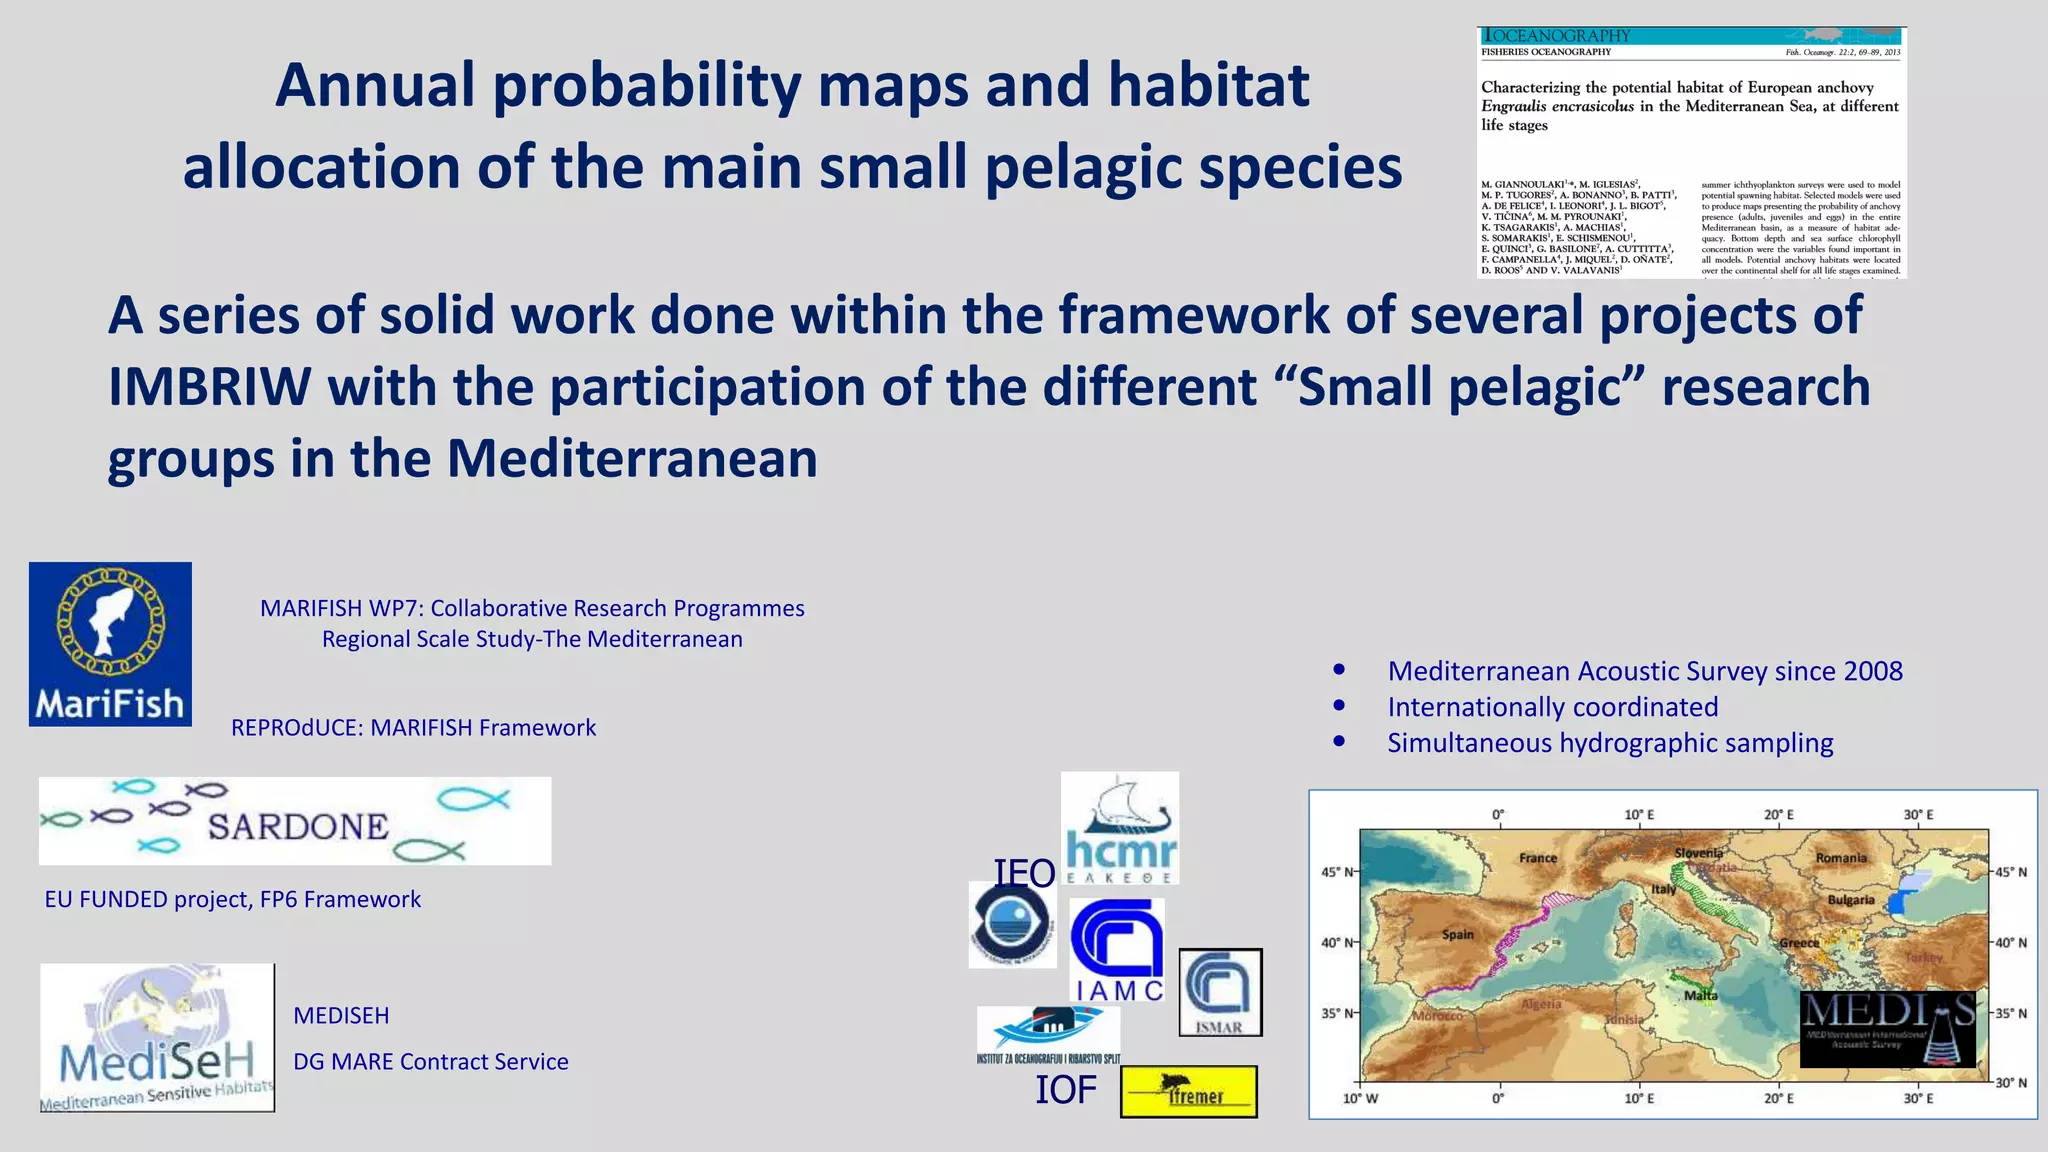
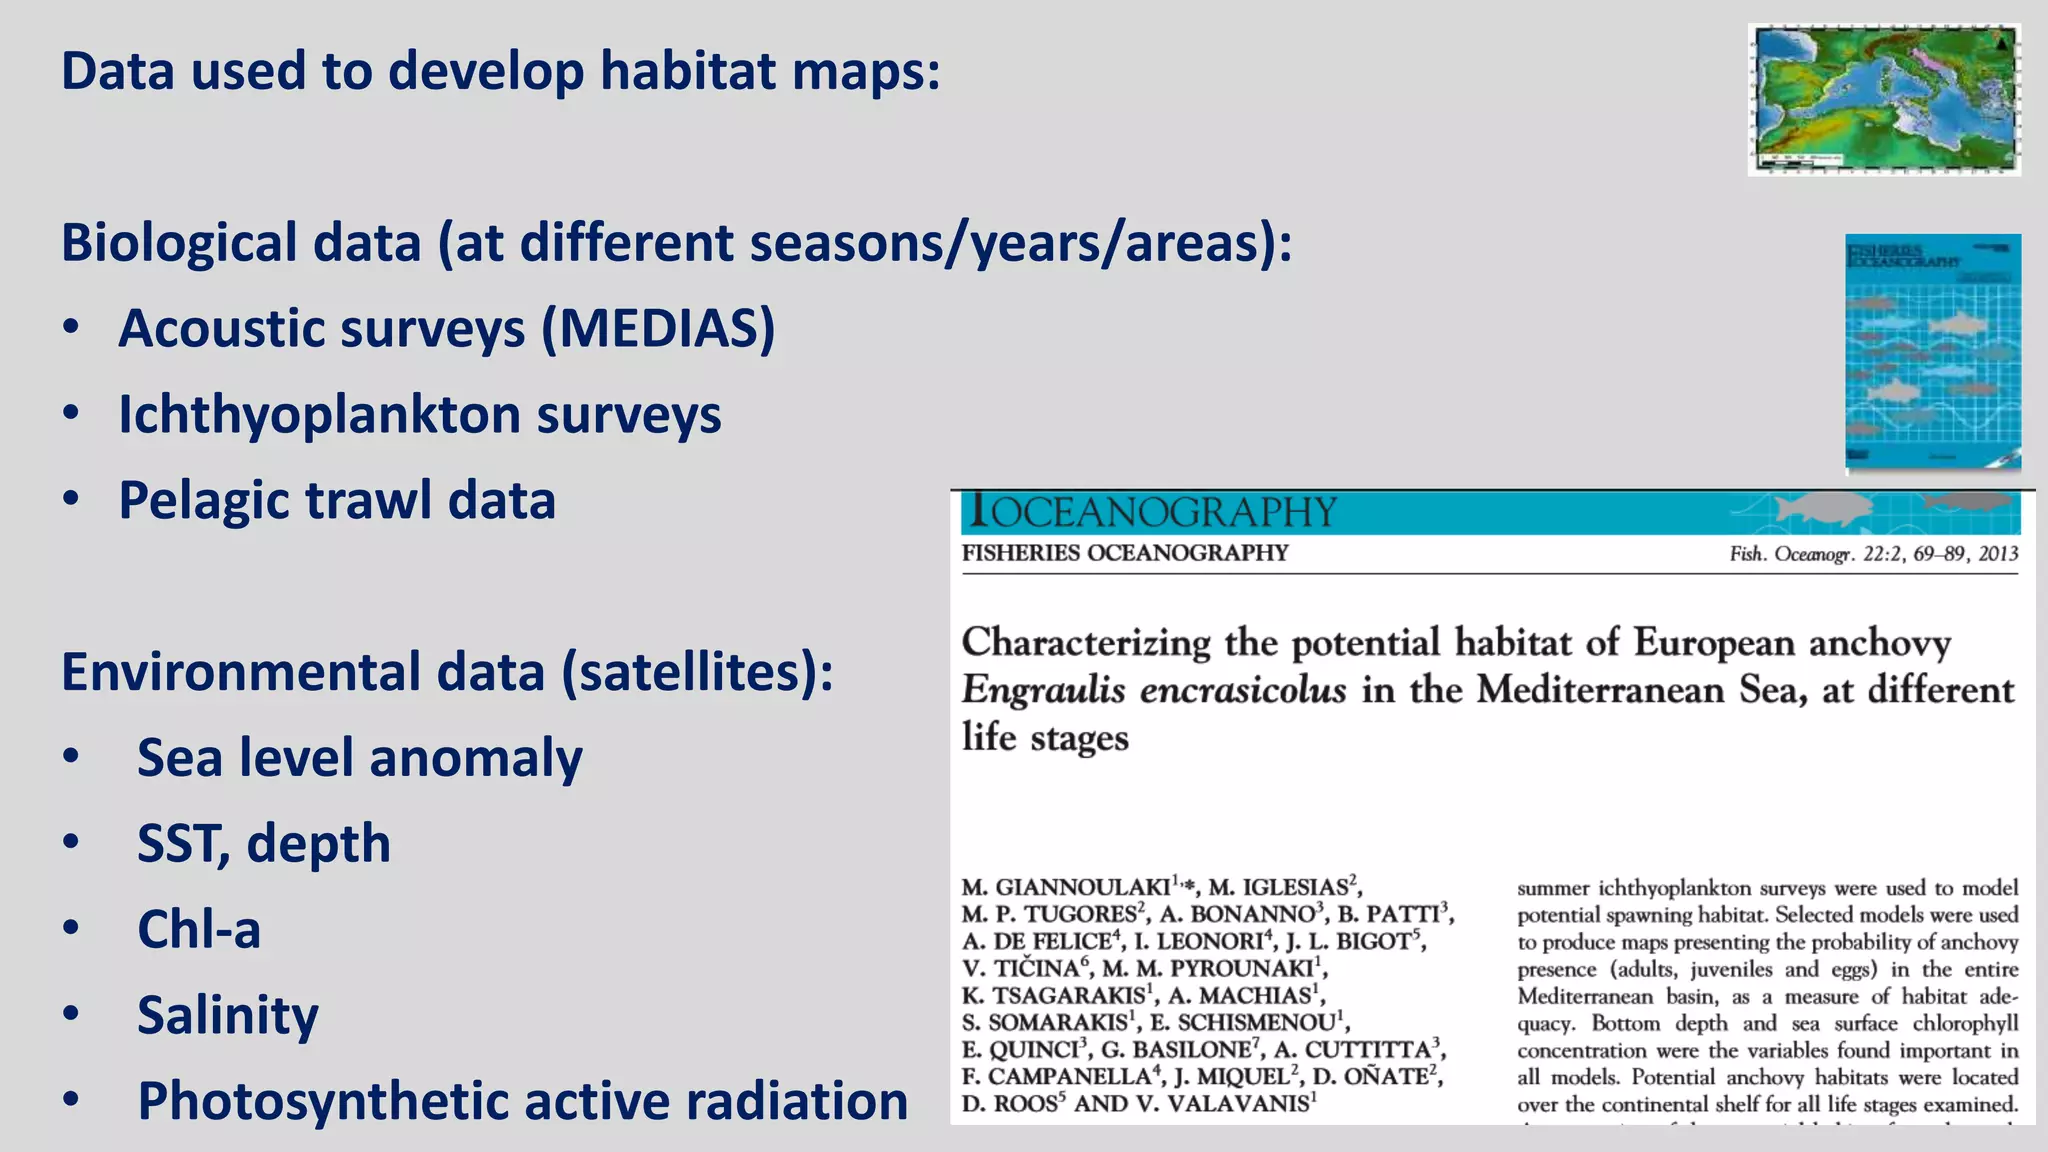
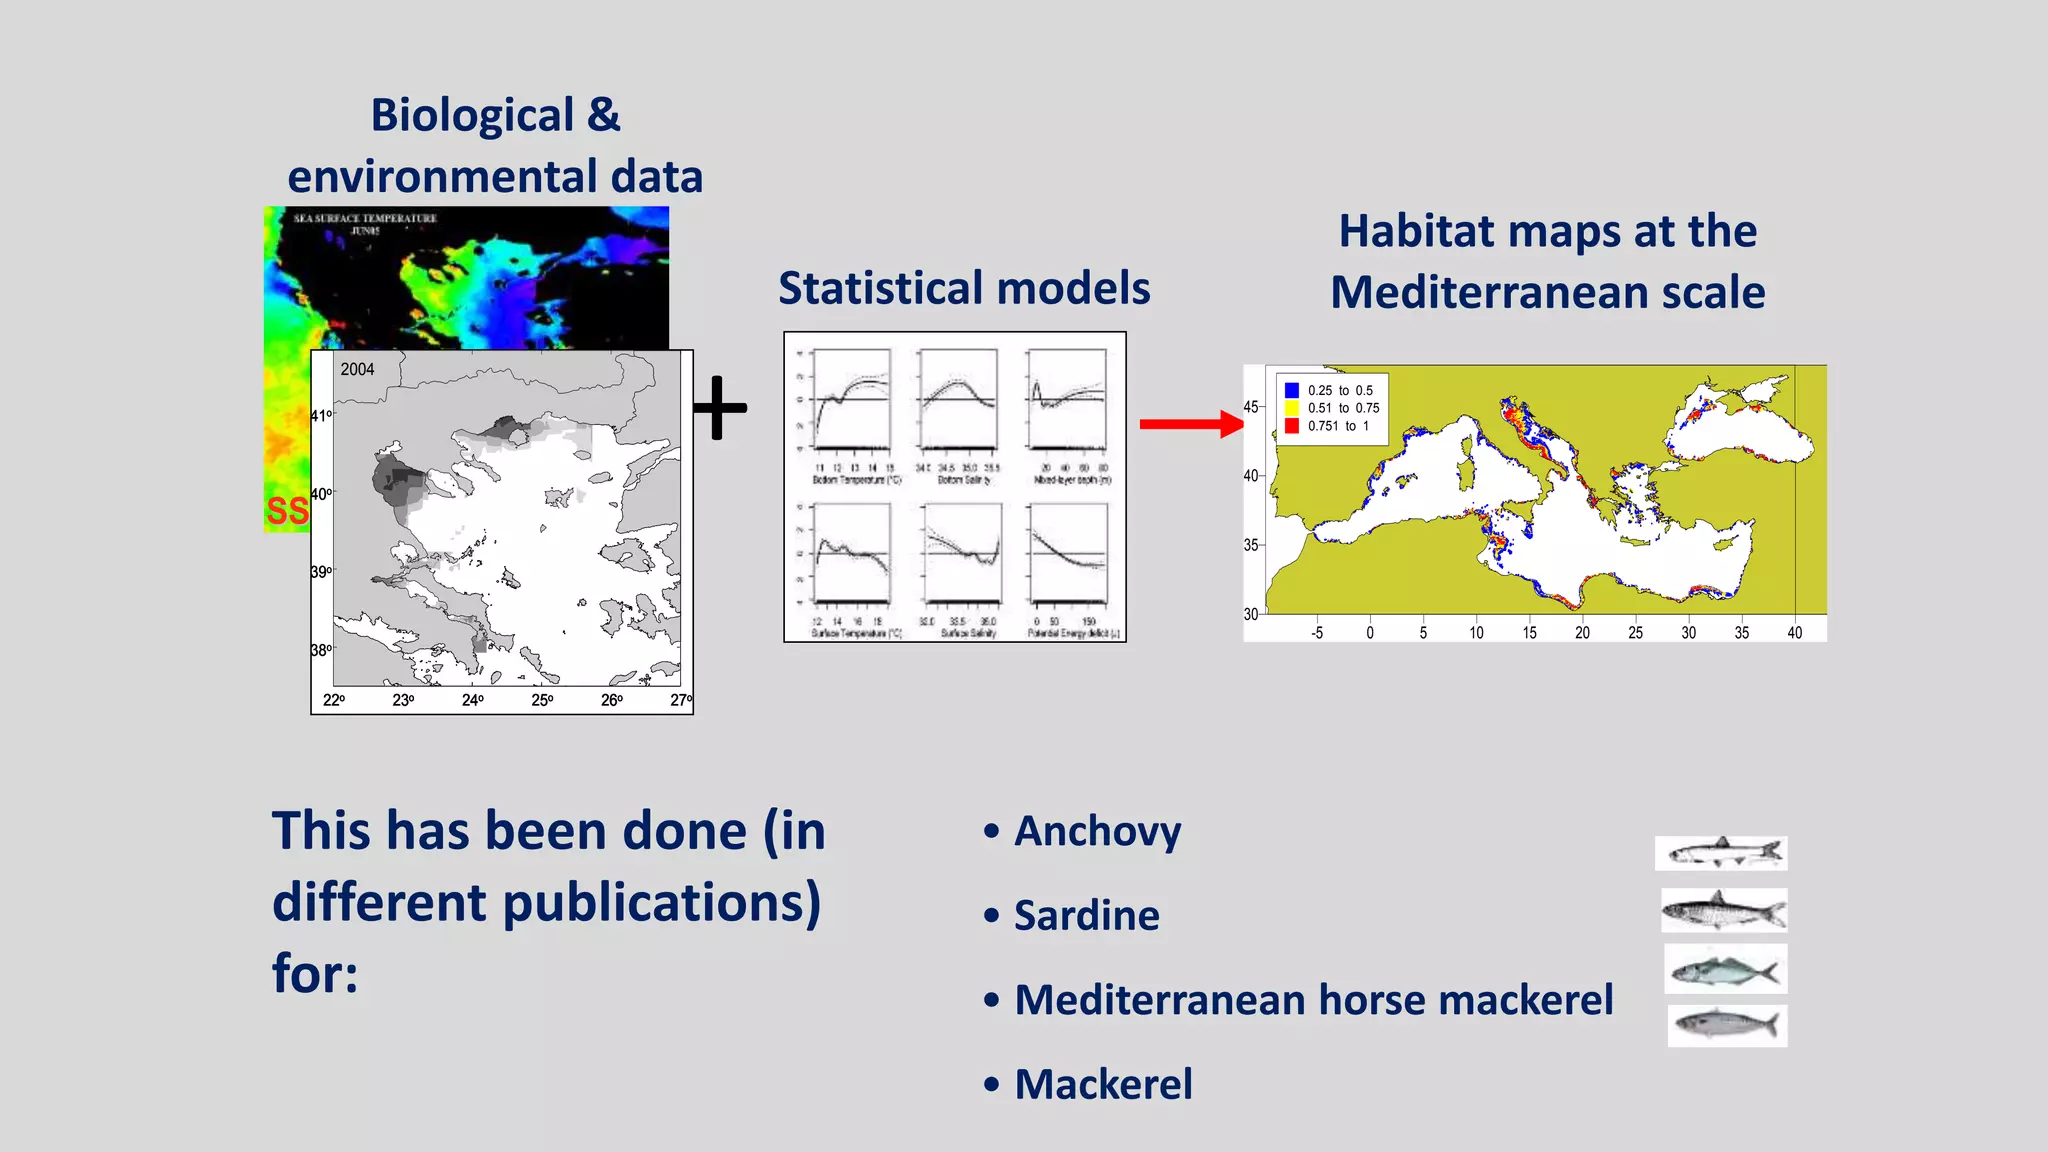
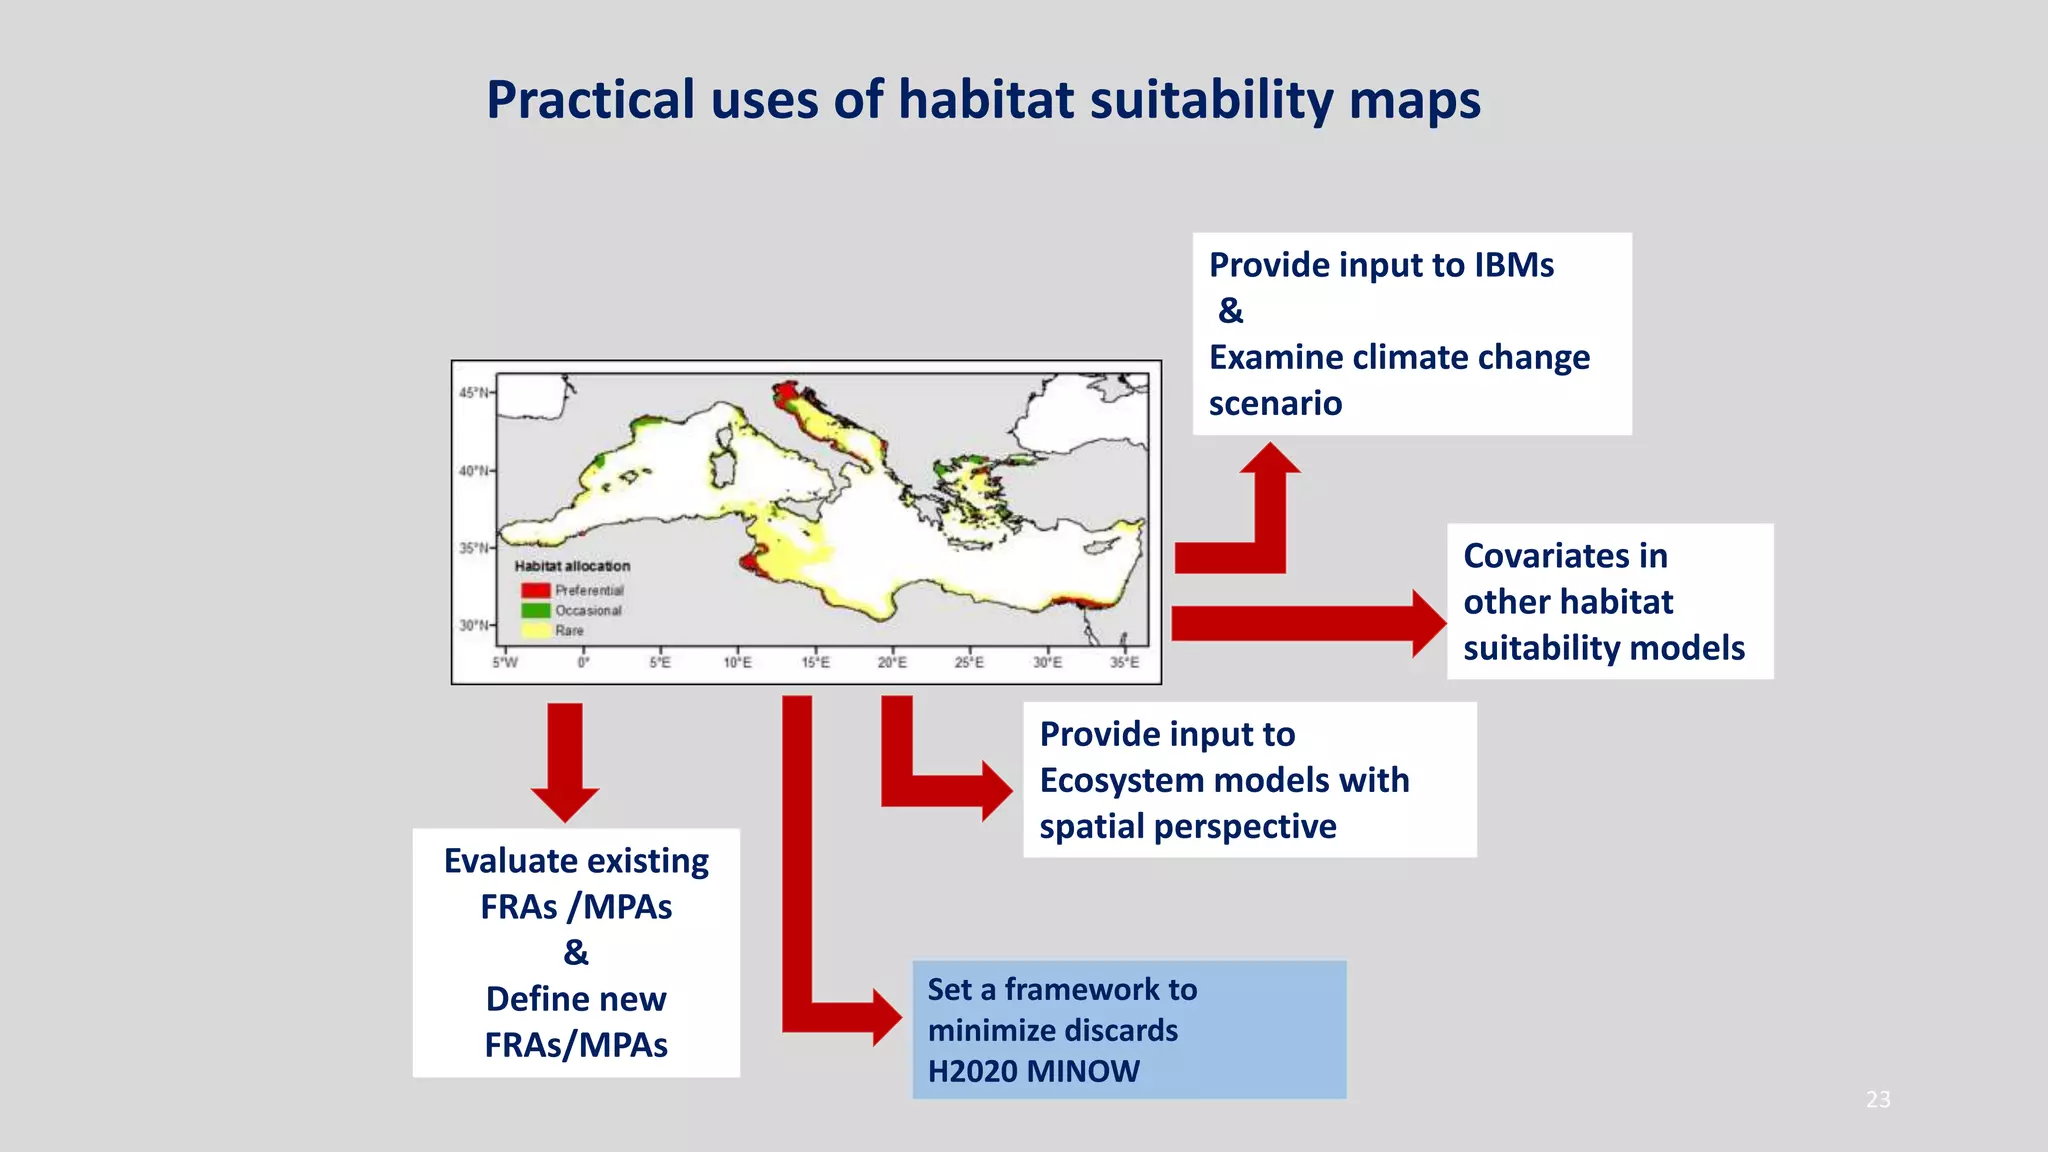

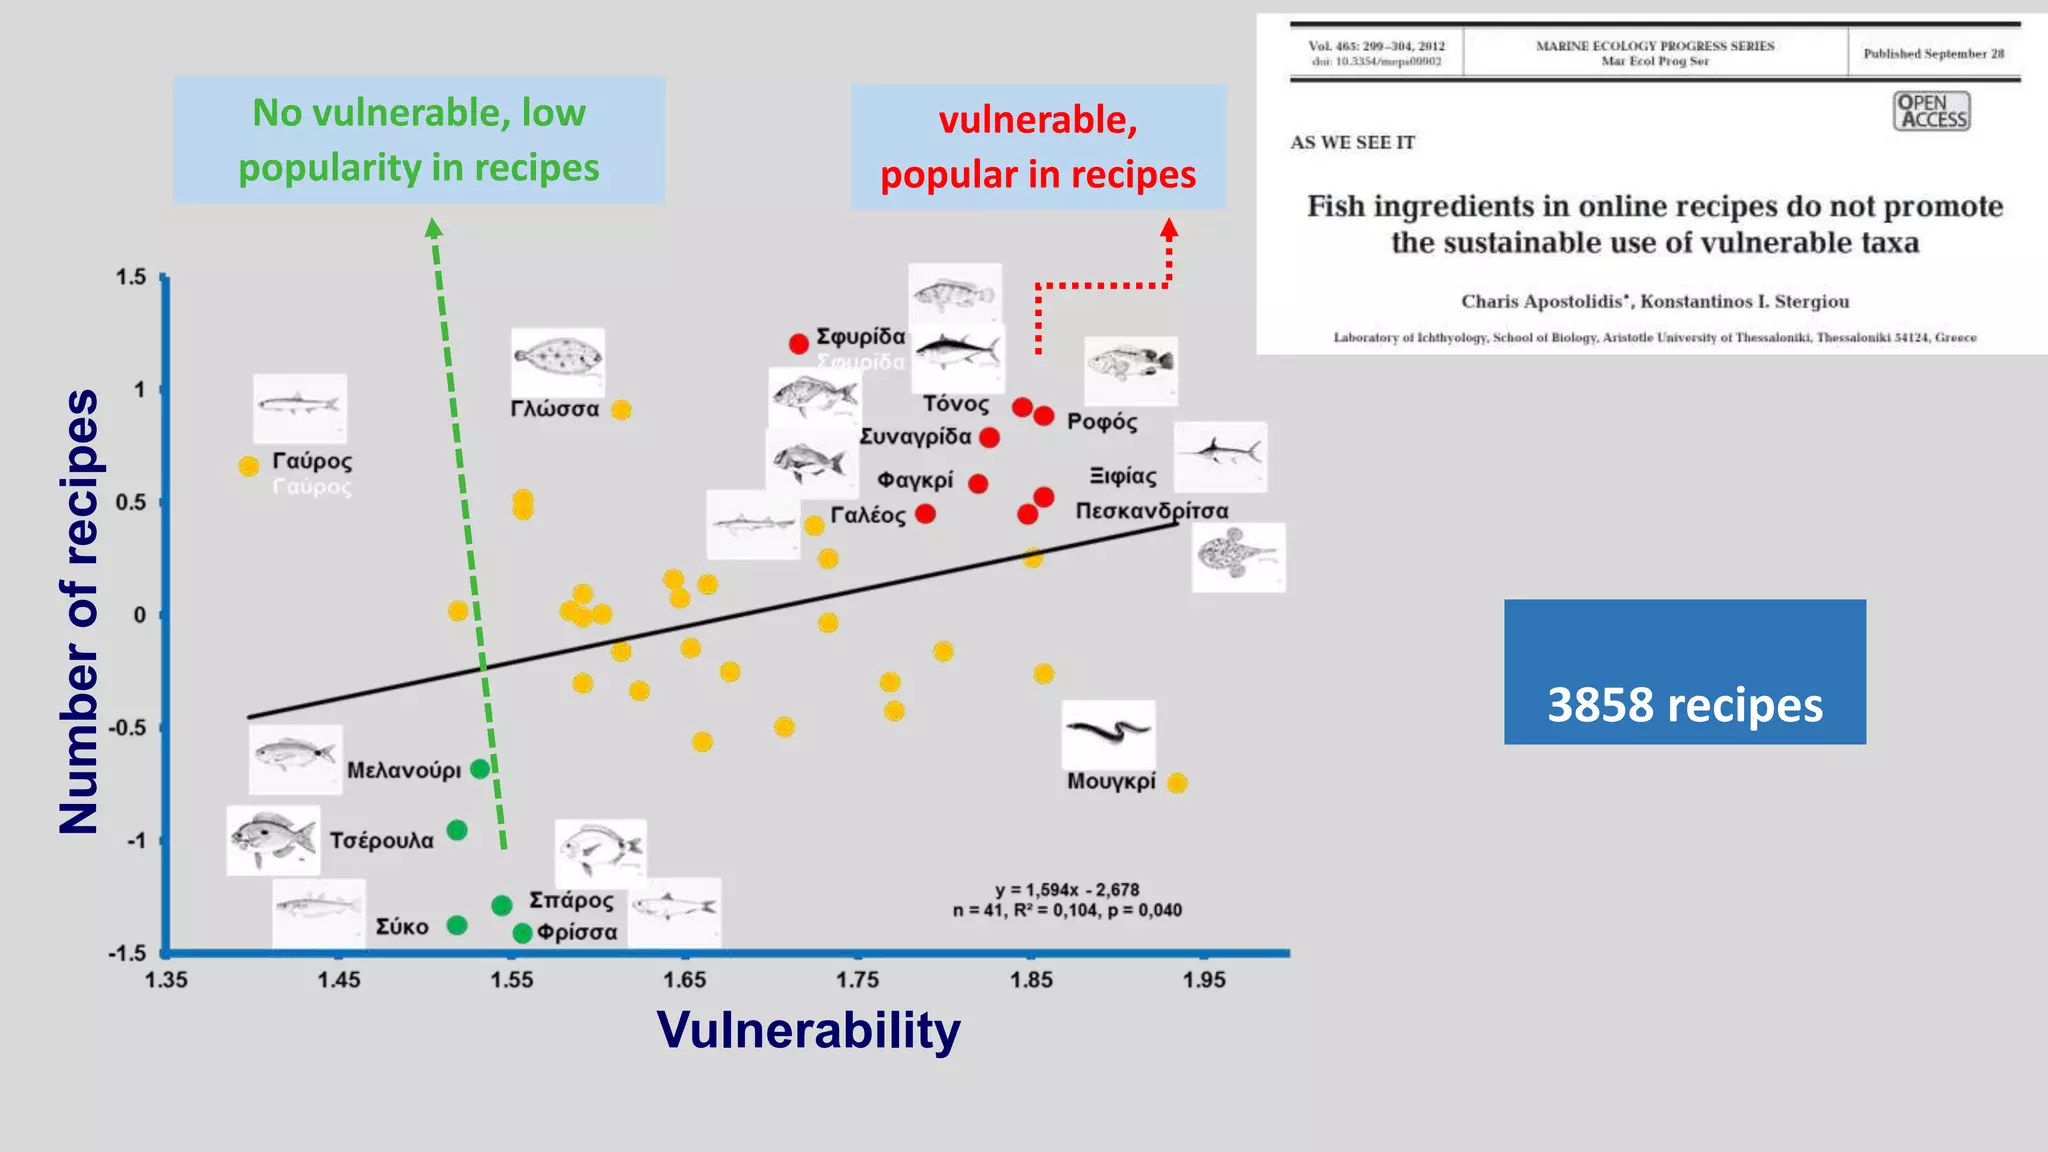


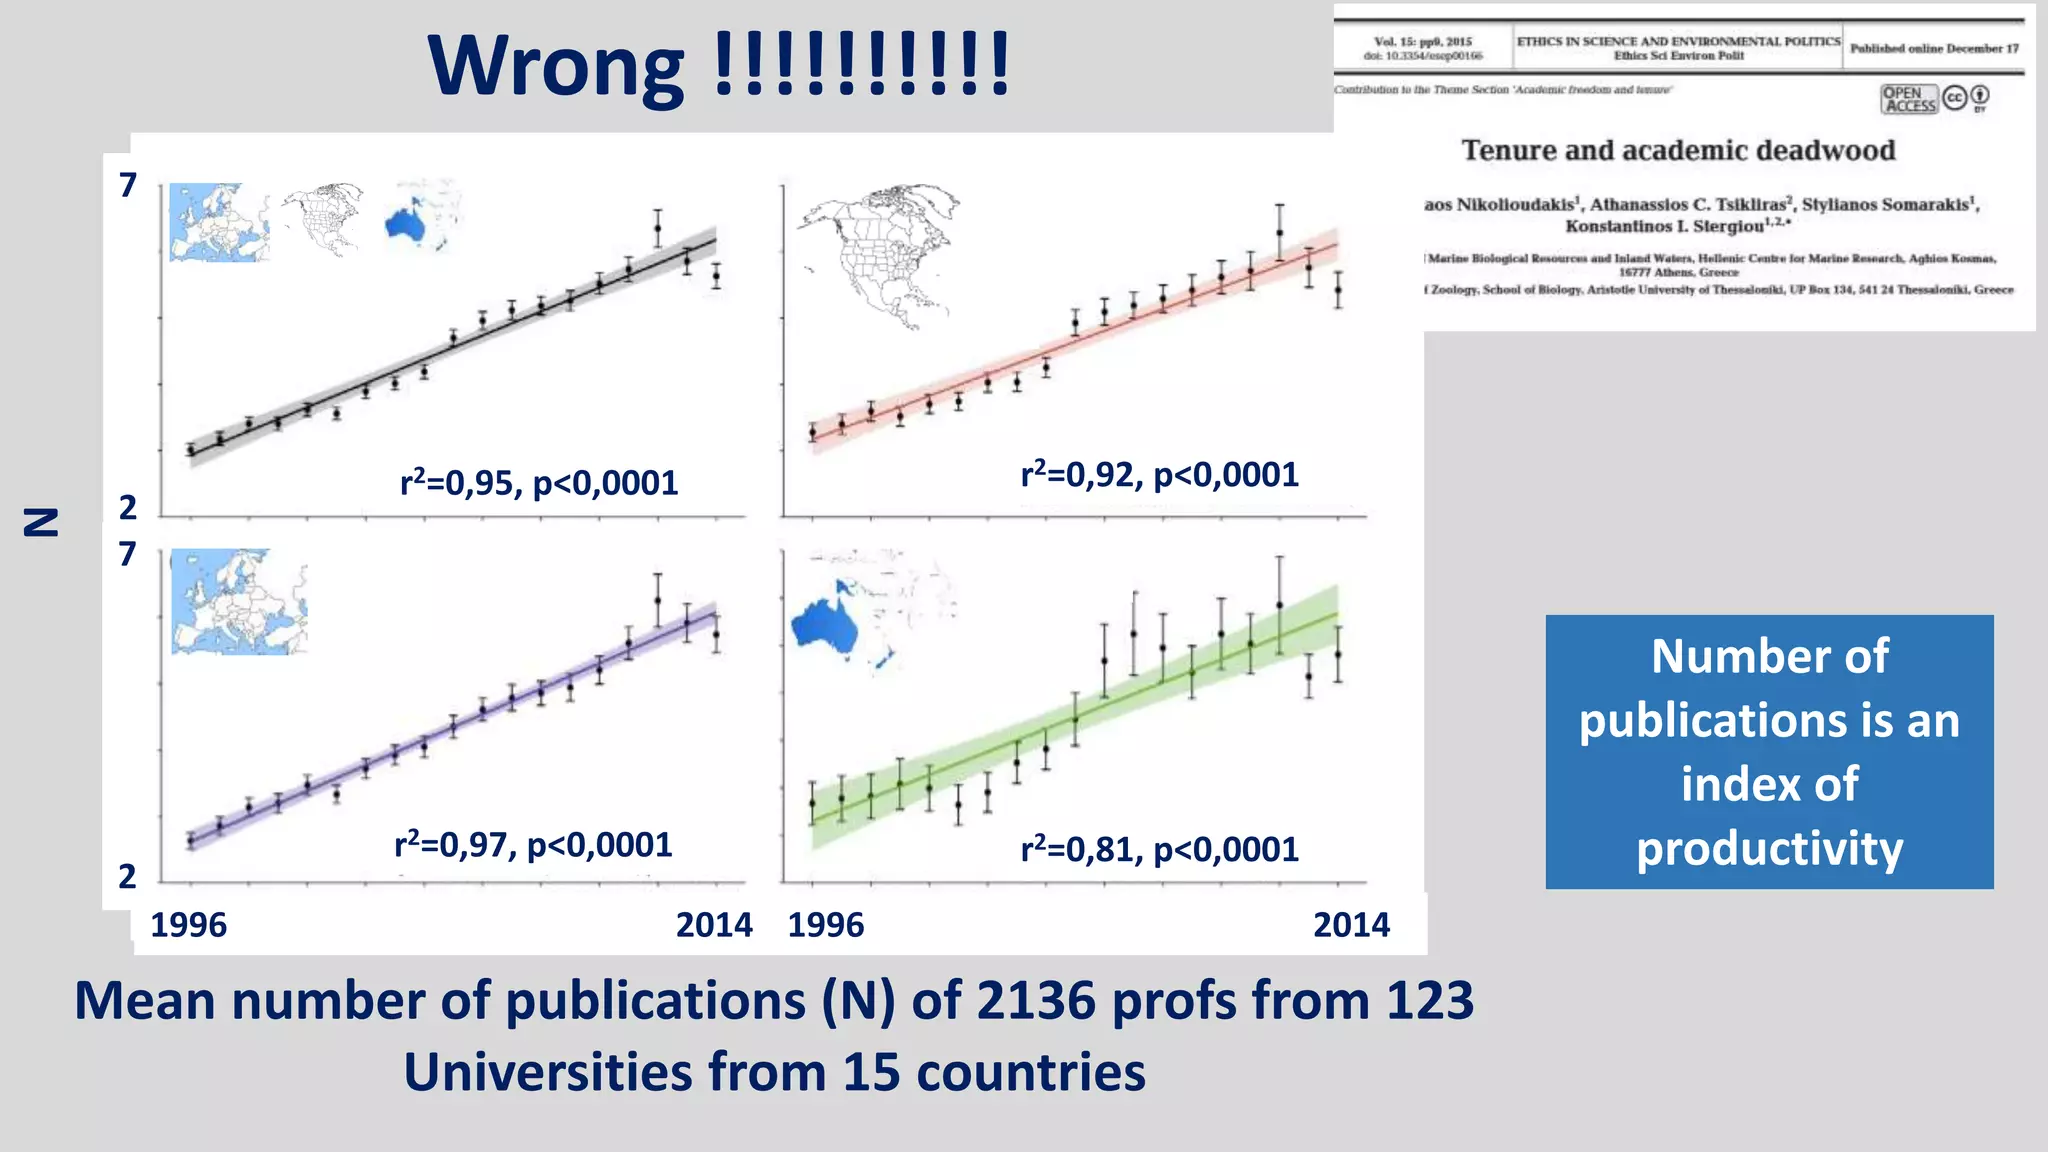


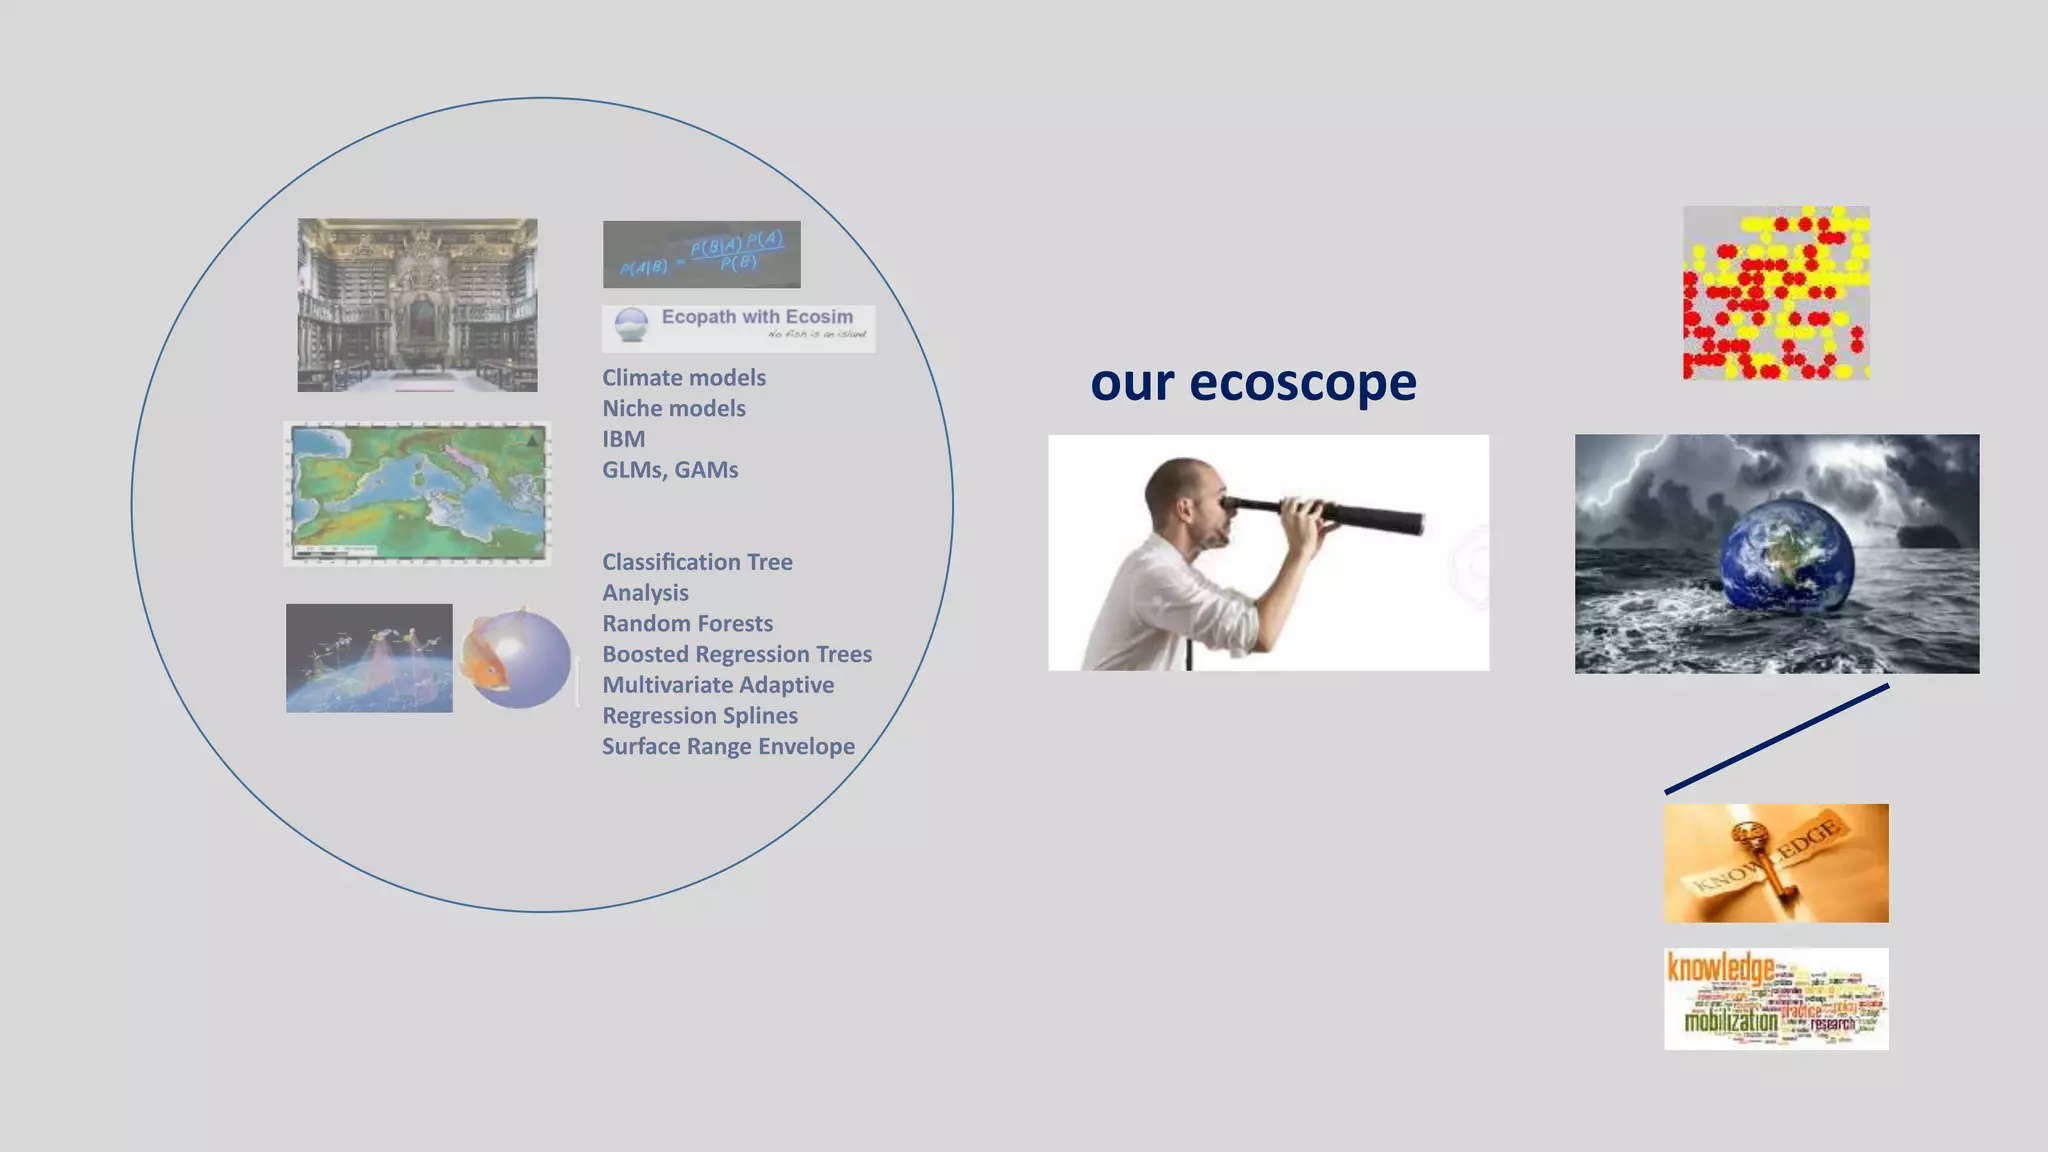


The document discusses the application of various data analysis models to enhance understanding of marine ecosystems, including the impacts of climate change on fish populations in the Mediterranean. It highlights the importance of time series data for predictive modeling and emphasizes the need for simple, explanatory models in ecology. Additionally, it presents specific case studies and frameworks for analyzing fisheries data and habitat suitability to address current ecological challenges.


