Downloaded 129 times
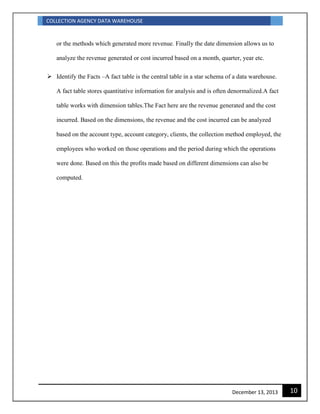


The document describes a proposed data warehouse for a collection agency. It would help the agency identify profitable clients and account types, measure employee performance, and make better strategic decisions. The data warehouse would collect, categorize, and analyze data on accounts, clients, collection methods, employees, and more. Key performance indicators would measure costs and revenues by category, compare employee collections to targets, and analyze revenues by geography to guide business growth.