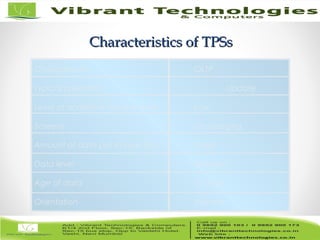
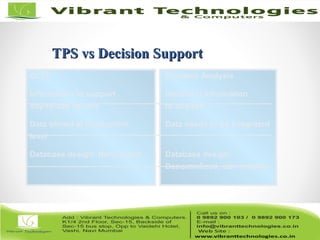
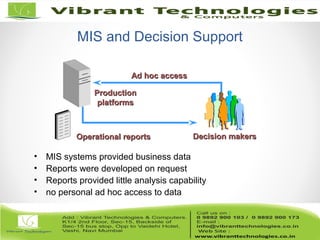
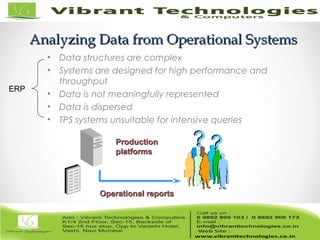
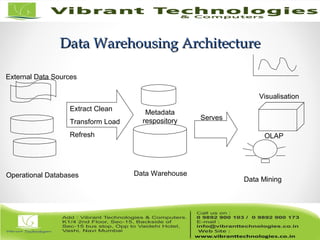
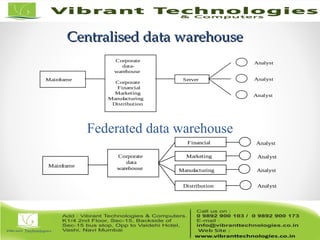
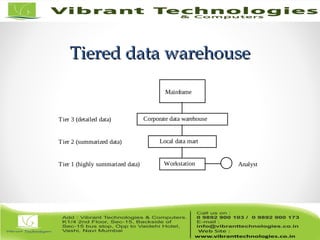
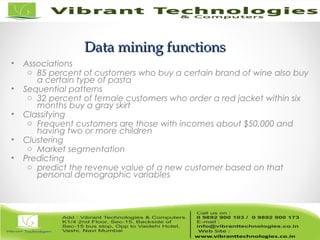
Introduction toIntroduction to
DataData
WarehousingWarehousing
From DBMS to Decision SupportFrom DBMS to Decision Support
• DBMSs widely used to maintain transactional data
• Attempts to use of these data for analysis, exploration,
identification of trends etc. has led to Decision Support
Systems.
• Rapid Growth since mid 70’s
• DBMSs vendors have answered this trend by adding new
features to existing products
• Rarely enough
DBs for Decision SupportDBs for Decision Support
• Trend towards Data Warehousing
• Data Warehousing – consolidation of data from several
databases which are in turn maintained by individual business
units along with historical and summary information
Characteristics of TPSsCharacteristics of TPSs
Characteristic OLTP
Typical operation Update
Level of analytical requirements Low
Screens Unchanging
Amount of data per transaction Small
Data level Detailed
Age of data Current
Orientation Records
Complex Analysis
Historical information
to analyze
Data needs to be integrated
Database design:
Denormalized, star schema
OLTP
Information to support
day-to-day service
Data stored at transaction
level
Database design: Normalized
TPS vs Decision SupportTPS vs Decision Support
MIS and Decision Support
Operational reportsOperational reports Decision makersDecision makers
ProductionProduction
platformsplatforms
• MIS systems provided business data
• Reports were developed on request
• Reports provided little analysis capability
• no personal ad hoc access to data
Ad hoc accessAd hoc access
Analyzing Data from Operational SystemsAnalyzing Data from Operational Systems
• Data structures are complex
• Systems are designed for high performance and
throughput
• Data is not meaningfully represented
• Data is dispersed
• TPS systems unsuitable for intensive queries
Operational reportsOperational reports
ProductionProduction
platformsplatforms
ERP
Data Extract ProcessingData Extract Processing
• End user computing offloaded from the operational
environment
• User’s own data
ExtractsExtractsOperational systemsOperational systems Decision makersDecision makers
Management IssuesManagement Issues
Extract explosion
• Duplicated effort
• Multiple technologies
• Obsolete reports
• No metadata
ExtractsExtractsOperational systemsOperational systems Decision makersDecision makers
Data Quality IssuesData Quality Issues
• No common time basis
• Different calculation algorithms
• Different levels of extraction
• Different levels of granularity
• Different data field names
• Different data field meanings
• Missing information
• No data correction rules
• No drill-down capability
From Extract to Warehouse DSSFrom Extract to Warehouse DSS
• Controlled
• Reliable
• Quality information
• Single source of data
Data warehouseData warehouseInternal andInternal and
external systemsexternal systems
Decision makersDecision makers
Data Warehousing ArchitectureData Warehousing Architecture
OLAP
Data WarehouseOperational Databases
Data Mining
Metadata
respository Serves
Extract Clean
Transform Load
Refresh
External Data Sources
Visualisation
Business MotivatorsBusiness Motivators
• Provide superior services and products
• Know the business
• New products
• Invest in customers
• Retain customers
• Invest in technology
• Reinvent to face new challenges
Centralised data warehouseCentralised data warehouse
Mainframe
Corporate
data-
warehouse
Corporate
Financial
Marketing
Manufacturing
Distribution
Server Analyst
Analyst
Analyst
Federated data warehouse
Mainframe
Corporate
data
warehouse
Financial
Analyst
Analyst
AnalystMarketing
Manufacturing
Distribution
Analyst
Tiered data warehouseTiered data warehouse
Local data mart
Mainframe
Analyst
Tier 3 (detailed data)
Tier 1 (highly summarized data)
Tier 2 (summarized data)
Workstation
Corporate data warehouse
Data Warehouses Vs Data MartsData Warehouses Vs Data Marts
Data Mart
Department
Single-subject
Few
< 100 GB
Months
Data Mart
Data
Warehouse
Property
Scope
Subjects
Data Source
Size (typical)
Implementation time
Data Warehouse
Enterprise
Multiple
Many
100 GB to > 1 TB
Months to years
End-user Access ToolsEnd-user Access Tools
• High performance is achieved by pre-planning the
requirements for joins, summations, and periodic reports
by end-users.
• There are five main groups of access tools:
o Data reporting and query tools
o Application development tools
o Executive information system (EIS) tools
o Online analytical processing (OLAP) tools
o Data mining tools
Data Usage - $1000 questionsData Usage - $1000 questions
Verification Discovery
What is the average sale for
in-store and catalog
customers?
What is the best predictor
of sales?
What is the average high
school GPA of students who
graduate from college
compared to those who do
not?
What are the best
predictors of college
graduation?
Need to complement RDBMS technology with a flexible,
multidimensional view of data
The Functionality of OLAPThe Functionality of OLAP
• Rotate and drill down
• Create and examine calculated data
• Determine comparative or relative differences.
• Perform exception and trend analysis.
• Perform advanced analytical functions
The star structureThe star structure
Facts
Week
Product
Product
Year
Region
Time
Channel
Revenue
Expenses
Units
Model
Type
Color
Channel
Region
Nation
District
Dealer
Time
Multidimensional Database ModelMultidimensional Database Model
The data is found at the intersection of dimensions.
StoreStore
TimeTime
FINANCE
StoreStore
ProductProduct
TimeTime
SALES
CustomerCustomer
Data MiningData Mining
Data mining functionsData mining functions
• Associations
o 85 percent of customers who buy a certain brand of wine also buy
a certain type of pasta
• Sequential patterns
o 32 percent of female customers who order a red jacket within six
months buy a gray skirt
• Classifying
o Frequent customers are those with incomes about $50,000 and
having two or more children
• Clustering
o Market segmentation
• Predicting
o predict the revenue value of a new customer based on that
personal demographic variables
ThankThank You !!!You !!!
For More Information click below link:
Follow Us on:
http://vibranttechnologies.co.in/datawarehousing-classes-in-mumbai.html

Data ware housing- Introduction to data ware housing

  • 2.
  • 3.
    From DBMS toDecision SupportFrom DBMS to Decision Support • DBMSs widely used to maintain transactional data • Attempts to use of these data for analysis, exploration, identification of trends etc. has led to Decision Support Systems. • Rapid Growth since mid 70’s • DBMSs vendors have answered this trend by adding new features to existing products • Rarely enough
  • 4.
    DBs for DecisionSupportDBs for Decision Support • Trend towards Data Warehousing • Data Warehousing – consolidation of data from several databases which are in turn maintained by individual business units along with historical and summary information
  • 5.
    Characteristics of TPSsCharacteristicsof TPSs Characteristic OLTP Typical operation Update Level of analytical requirements Low Screens Unchanging Amount of data per transaction Small Data level Detailed Age of data Current Orientation Records
  • 6.
    Complex Analysis Historical information toanalyze Data needs to be integrated Database design: Denormalized, star schema OLTP Information to support day-to-day service Data stored at transaction level Database design: Normalized TPS vs Decision SupportTPS vs Decision Support
  • 7.
    MIS and DecisionSupport Operational reportsOperational reports Decision makersDecision makers ProductionProduction platformsplatforms • MIS systems provided business data • Reports were developed on request • Reports provided little analysis capability • no personal ad hoc access to data Ad hoc accessAd hoc access
  • 8.
    Analyzing Data fromOperational SystemsAnalyzing Data from Operational Systems • Data structures are complex • Systems are designed for high performance and throughput • Data is not meaningfully represented • Data is dispersed • TPS systems unsuitable for intensive queries Operational reportsOperational reports ProductionProduction platformsplatforms ERP
  • 9.
    Data Extract ProcessingDataExtract Processing • End user computing offloaded from the operational environment • User’s own data ExtractsExtractsOperational systemsOperational systems Decision makersDecision makers
  • 10.
    Management IssuesManagement Issues Extractexplosion • Duplicated effort • Multiple technologies • Obsolete reports • No metadata ExtractsExtractsOperational systemsOperational systems Decision makersDecision makers
  • 11.
    Data Quality IssuesDataQuality Issues • No common time basis • Different calculation algorithms • Different levels of extraction • Different levels of granularity • Different data field names • Different data field meanings • Missing information • No data correction rules • No drill-down capability
  • 12.
    From Extract toWarehouse DSSFrom Extract to Warehouse DSS • Controlled • Reliable • Quality information • Single source of data Data warehouseData warehouseInternal andInternal and external systemsexternal systems Decision makersDecision makers
  • 13.
    Data Warehousing ArchitectureDataWarehousing Architecture OLAP Data WarehouseOperational Databases Data Mining Metadata respository Serves Extract Clean Transform Load Refresh External Data Sources Visualisation
  • 14.
    Business MotivatorsBusiness Motivators •Provide superior services and products • Know the business • New products • Invest in customers • Retain customers • Invest in technology • Reinvent to face new challenges
  • 15.
    Centralised data warehouseCentraliseddata warehouse Mainframe Corporate data- warehouse Corporate Financial Marketing Manufacturing Distribution Server Analyst Analyst Analyst Federated data warehouse Mainframe Corporate data warehouse Financial Analyst Analyst AnalystMarketing Manufacturing Distribution Analyst
  • 16.
    Tiered data warehouseTiereddata warehouse Local data mart Mainframe Analyst Tier 3 (detailed data) Tier 1 (highly summarized data) Tier 2 (summarized data) Workstation Corporate data warehouse
  • 17.
    Data Warehouses VsData MartsData Warehouses Vs Data Marts Data Mart Department Single-subject Few < 100 GB Months Data Mart Data Warehouse Property Scope Subjects Data Source Size (typical) Implementation time Data Warehouse Enterprise Multiple Many 100 GB to > 1 TB Months to years
  • 18.
    End-user Access ToolsEnd-userAccess Tools • High performance is achieved by pre-planning the requirements for joins, summations, and periodic reports by end-users. • There are five main groups of access tools: o Data reporting and query tools o Application development tools o Executive information system (EIS) tools o Online analytical processing (OLAP) tools o Data mining tools
  • 19.
    Data Usage -$1000 questionsData Usage - $1000 questions Verification Discovery What is the average sale for in-store and catalog customers? What is the best predictor of sales? What is the average high school GPA of students who graduate from college compared to those who do not? What are the best predictors of college graduation? Need to complement RDBMS technology with a flexible, multidimensional view of data
  • 21.
    The Functionality ofOLAPThe Functionality of OLAP • Rotate and drill down • Create and examine calculated data • Determine comparative or relative differences. • Perform exception and trend analysis. • Perform advanced analytical functions
  • 22.
    The star structureThestar structure Facts Week Product Product Year Region Time Channel Revenue Expenses Units Model Type Color Channel Region Nation District Dealer Time
  • 23.
    Multidimensional Database ModelMultidimensionalDatabase Model The data is found at the intersection of dimensions. StoreStore TimeTime FINANCE StoreStore ProductProduct TimeTime SALES CustomerCustomer
  • 24.
  • 25.
    Data mining functionsDatamining functions • Associations o 85 percent of customers who buy a certain brand of wine also buy a certain type of pasta • Sequential patterns o 32 percent of female customers who order a red jacket within six months buy a gray skirt • Classifying o Frequent customers are those with incomes about $50,000 and having two or more children • Clustering o Market segmentation • Predicting o predict the revenue value of a new customer based on that personal demographic variables
  • 26.
    ThankThank You !!!You!!! For More Information click below link: Follow Us on: http://vibranttechnologies.co.in/datawarehousing-classes-in-mumbai.html