Downloaded 29 times
![6
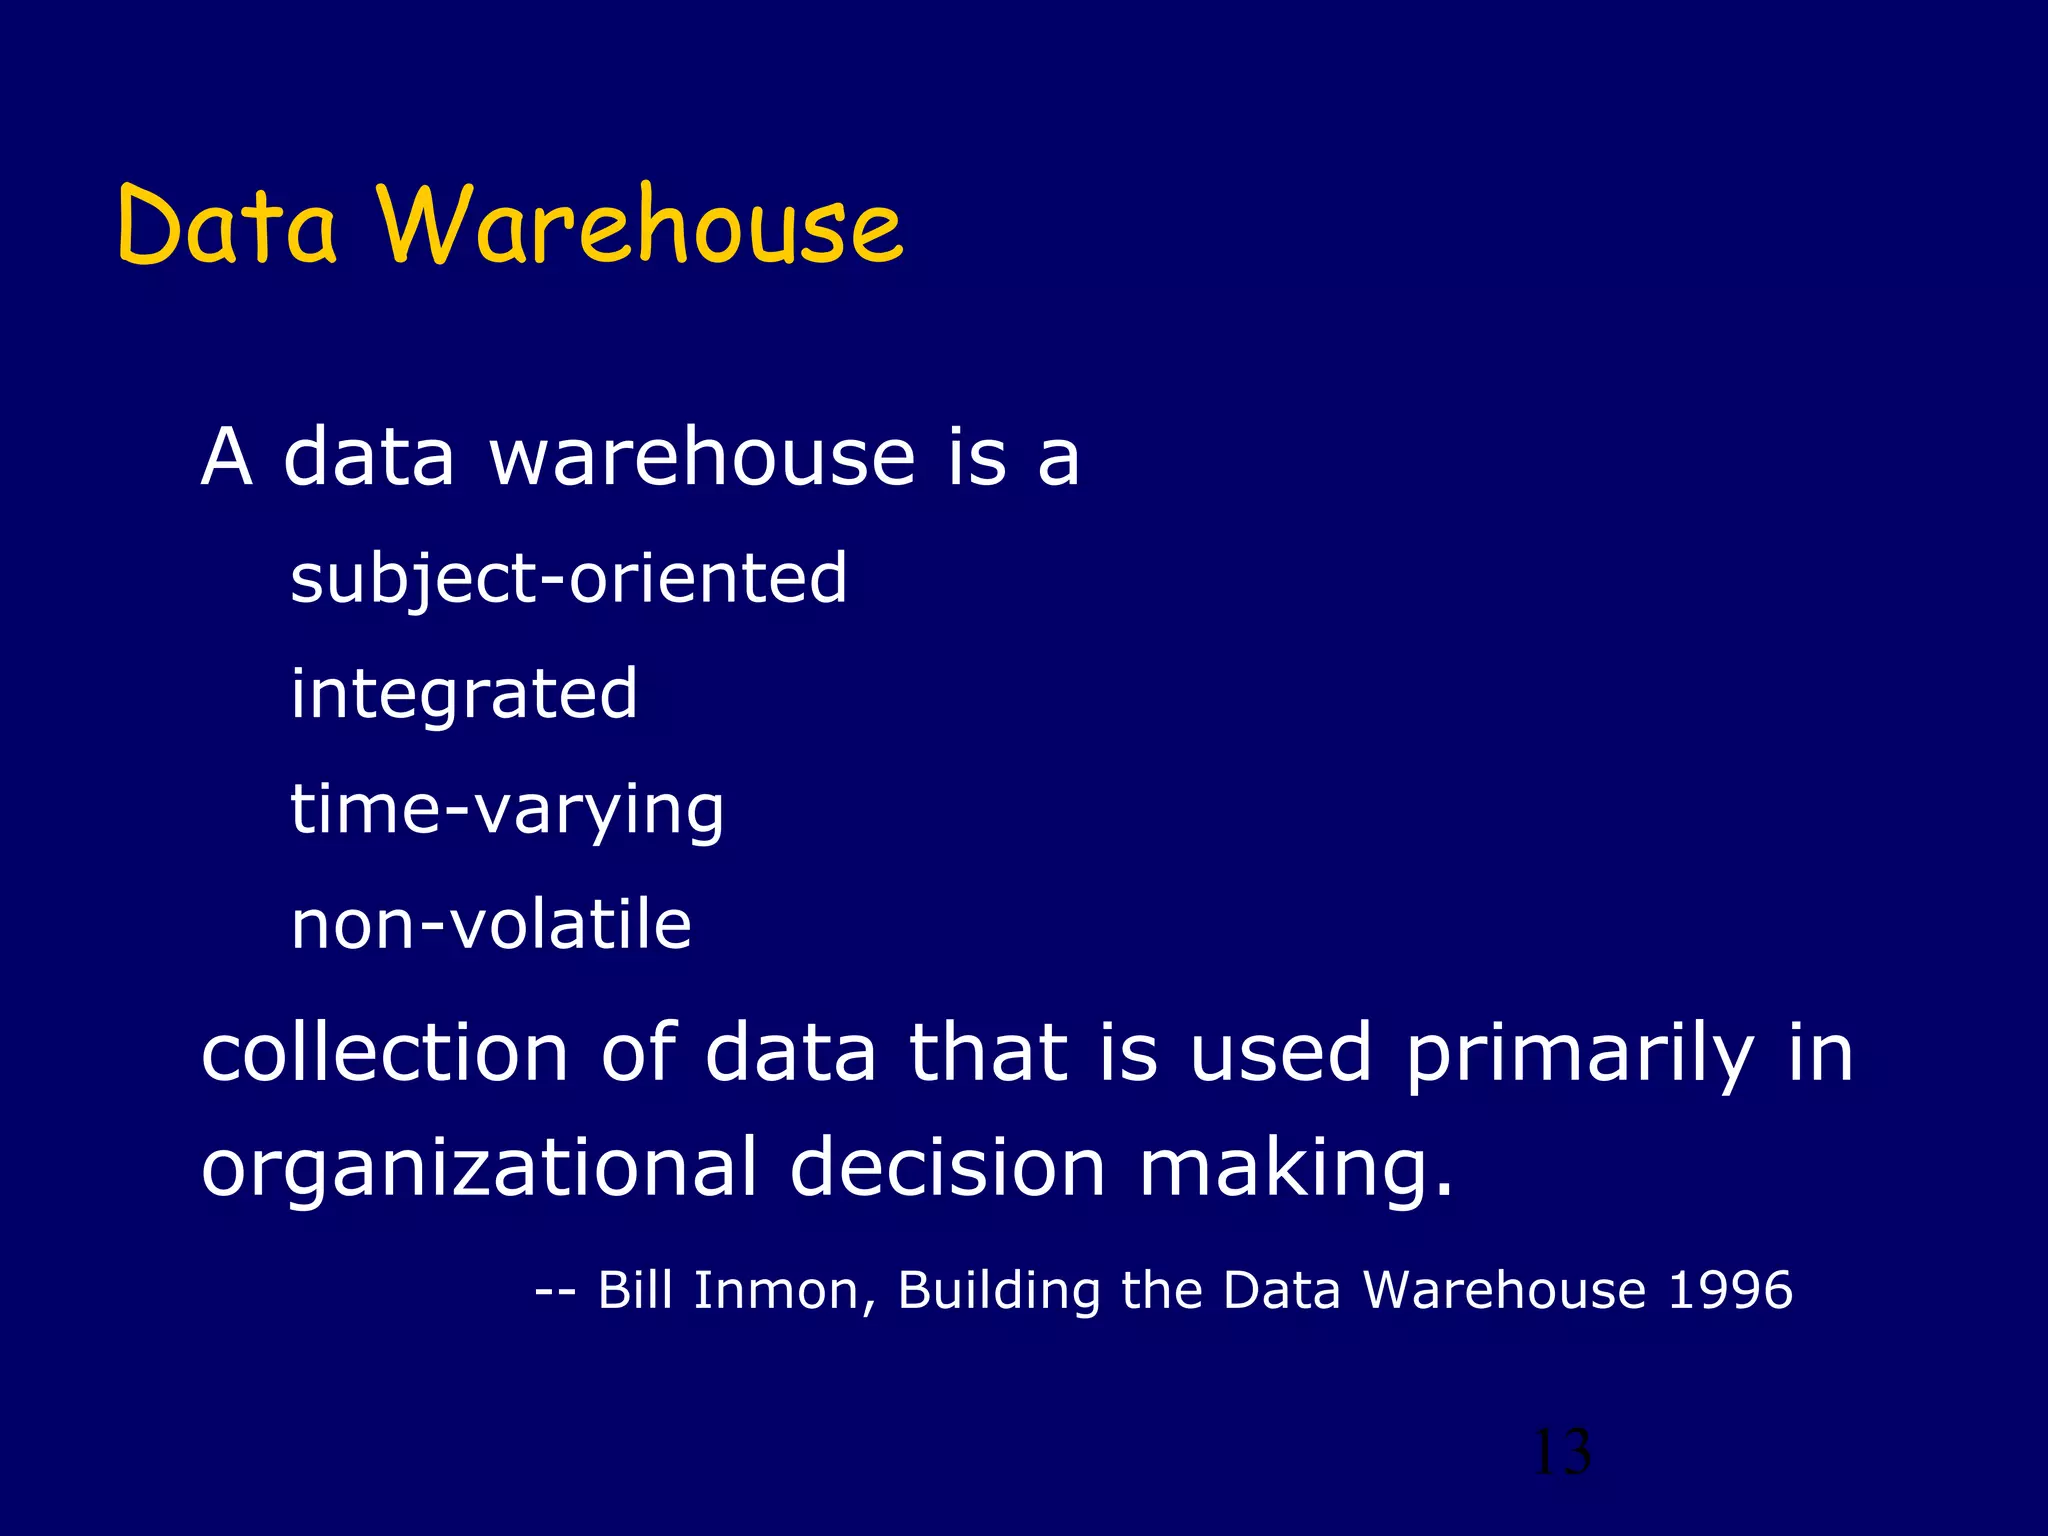
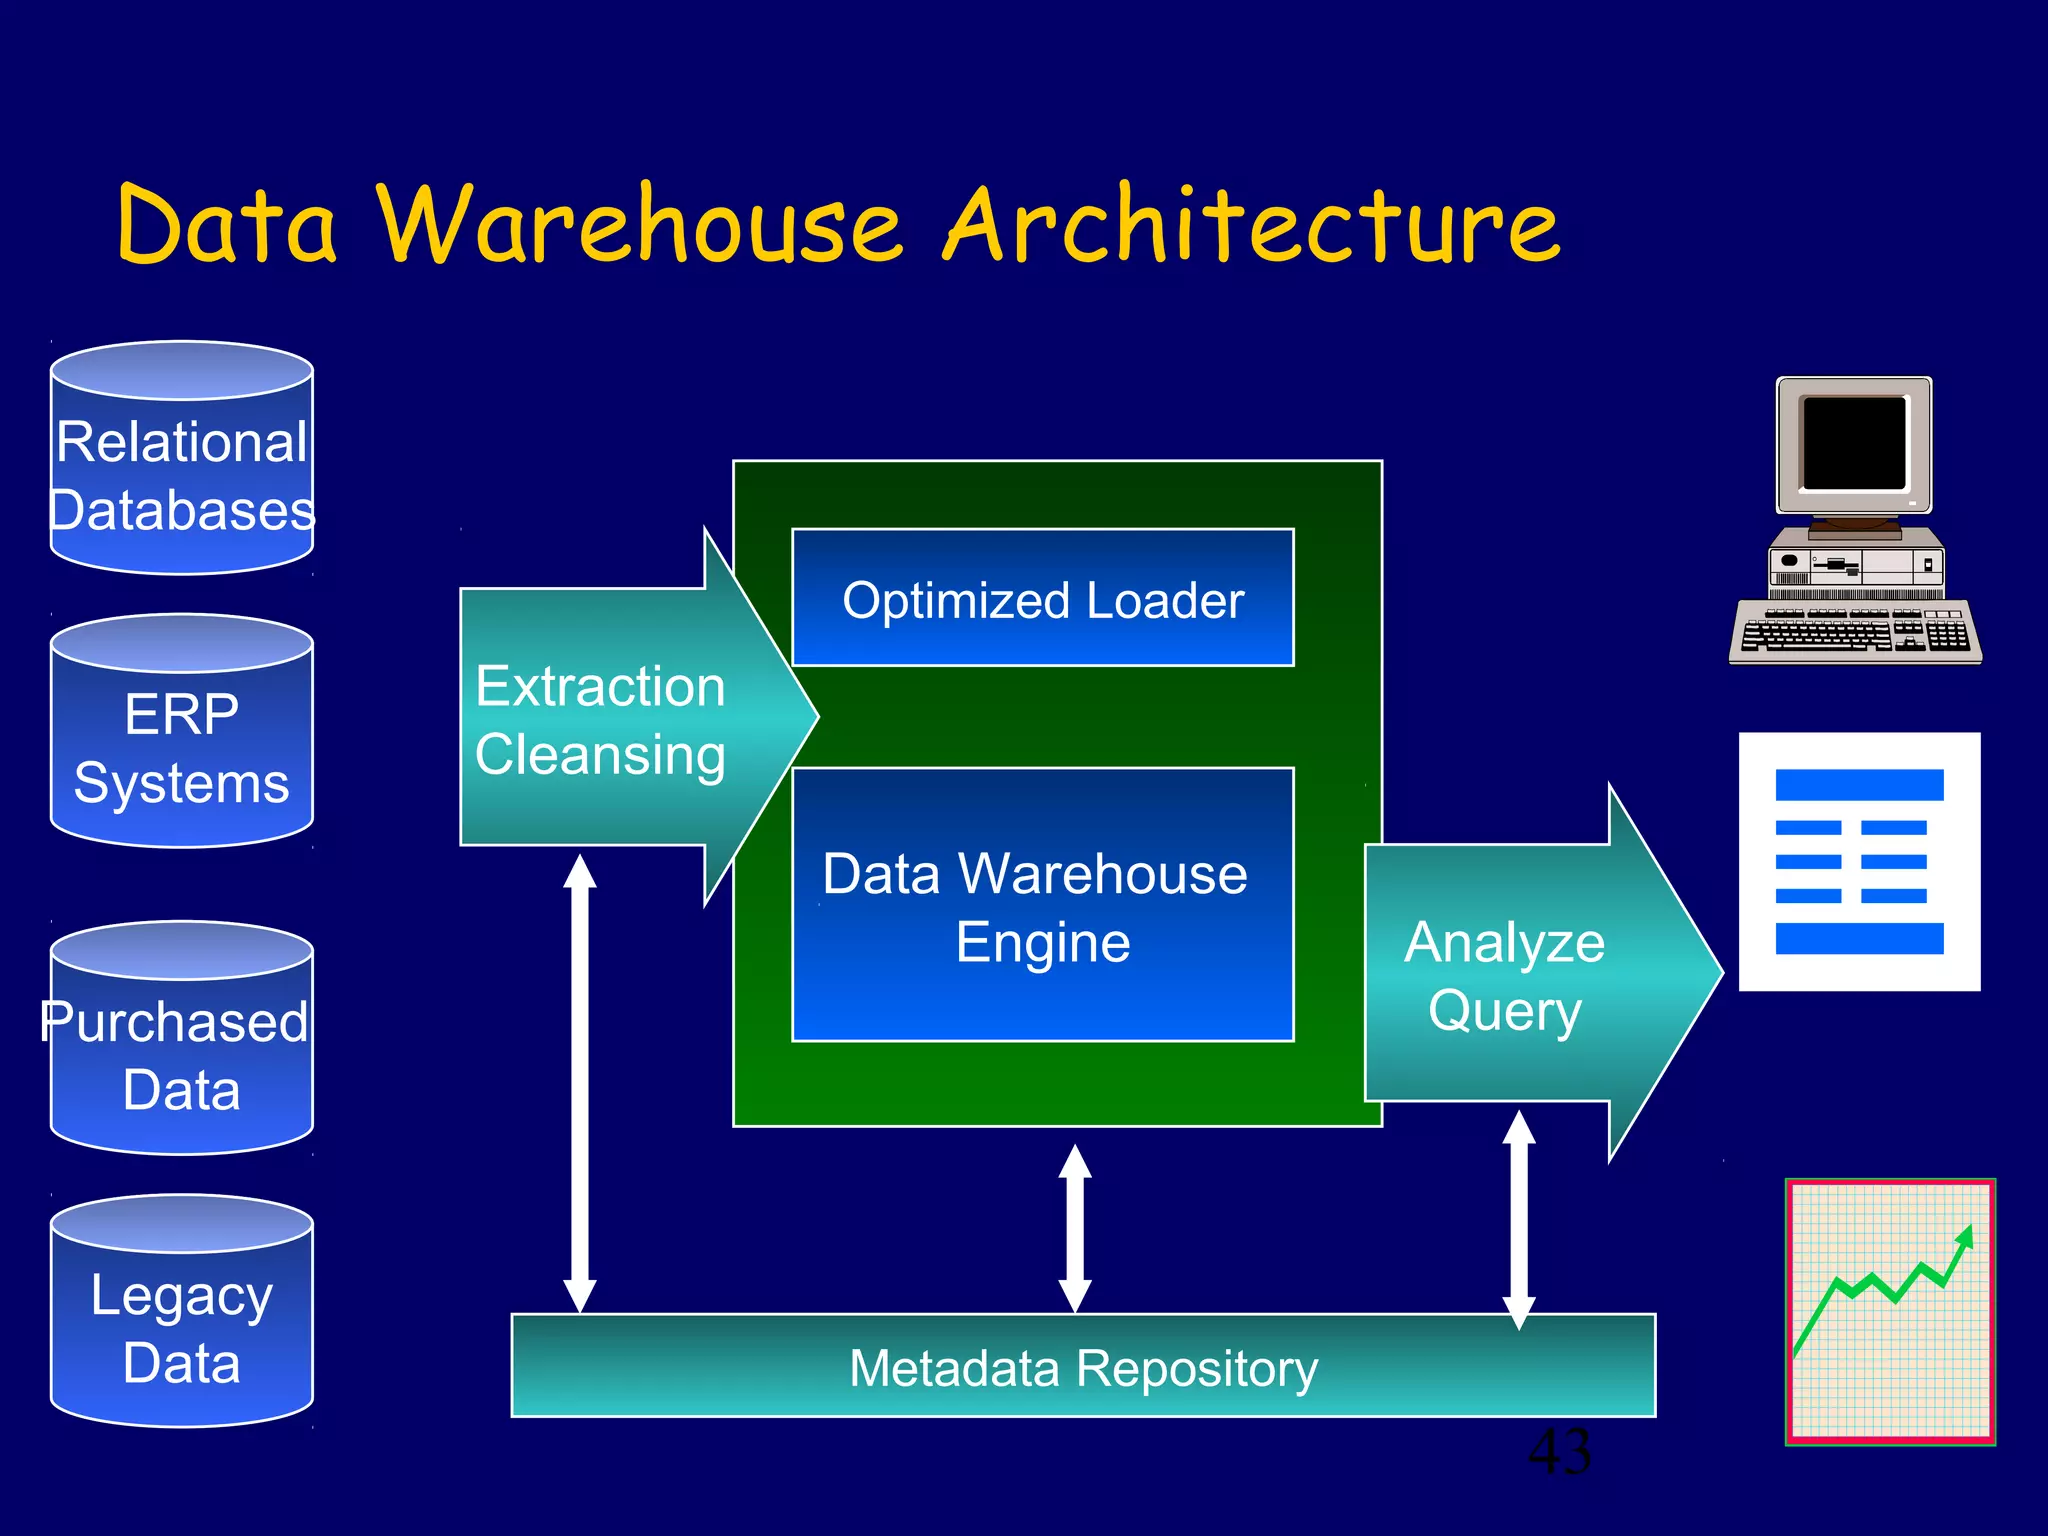
What is a Data Warehouse?
A single, complete and
consistent store of data
obtained from a variety
of different sources
made available to end
users in a what they
can understand and use
in a business context.
[Barry Devlin]](https://image.slidesharecdn.com/13500892-data-warehousing-and-data-mining-140321050239-phpapp01/75/13500892-data-warehousing-and-data-mining-6-2048.jpg)
![8
What is Data Warehousing?
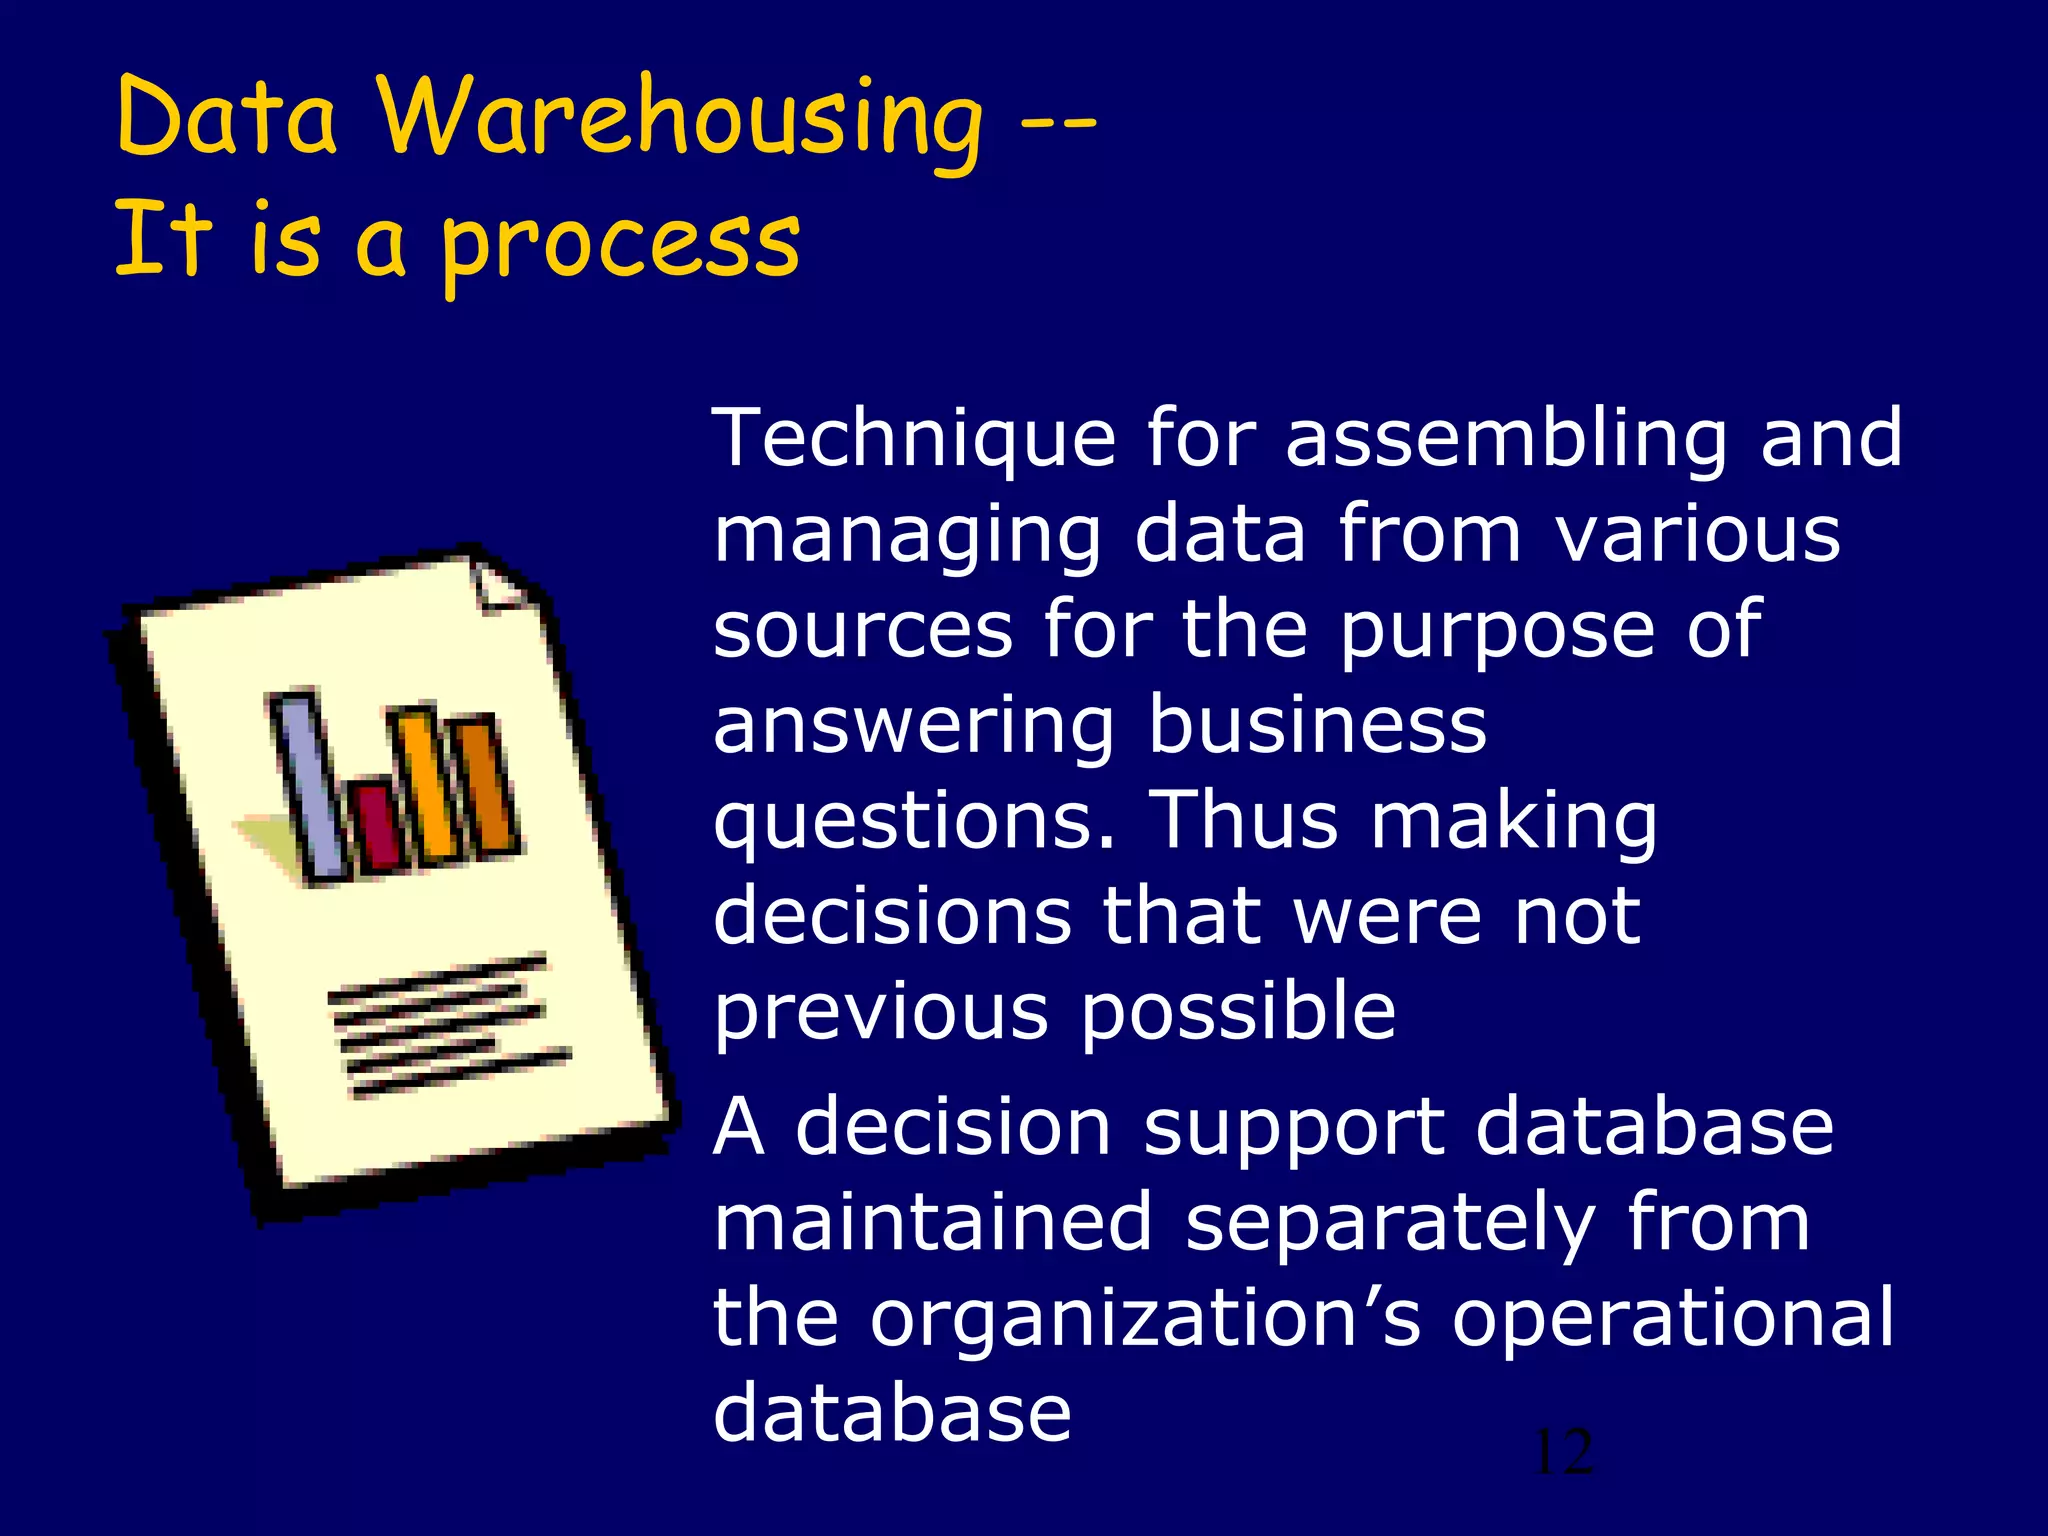
A process of
transforming data into
information and
making it available to
users in a timely
enough manner to
make a difference
[Forrester Research, April
1996]Data
Information](https://image.slidesharecdn.com/13500892-data-warehousing-and-data-mining-140321050239-phpapp01/75/13500892-data-warehousing-and-data-mining-8-2048.jpg)
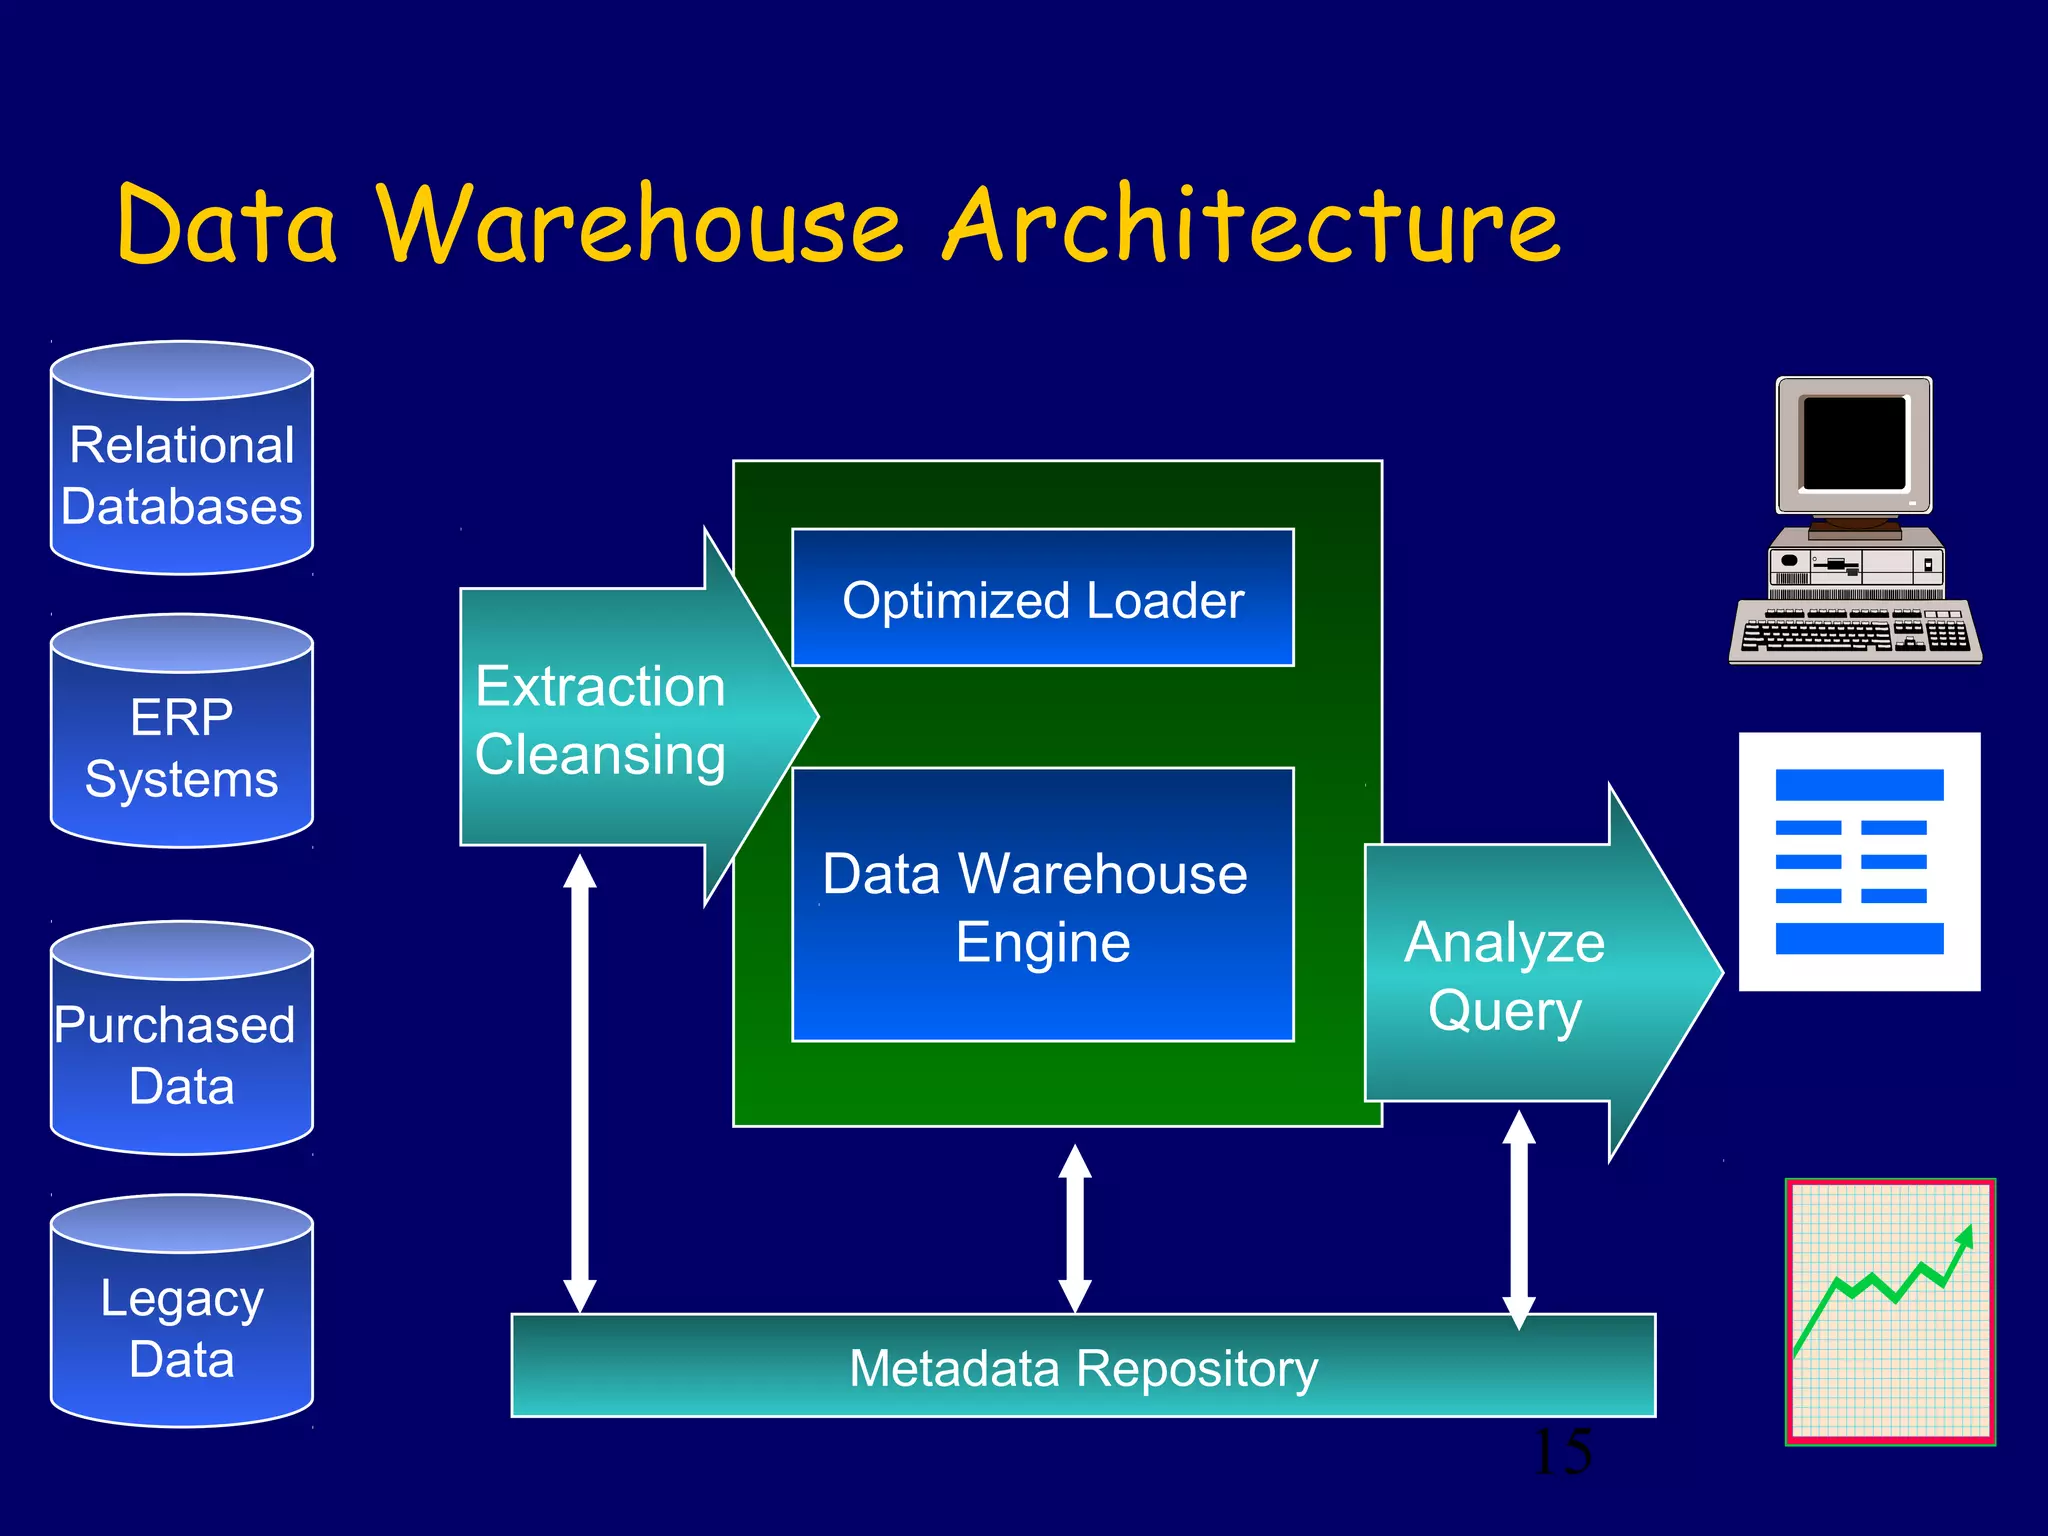
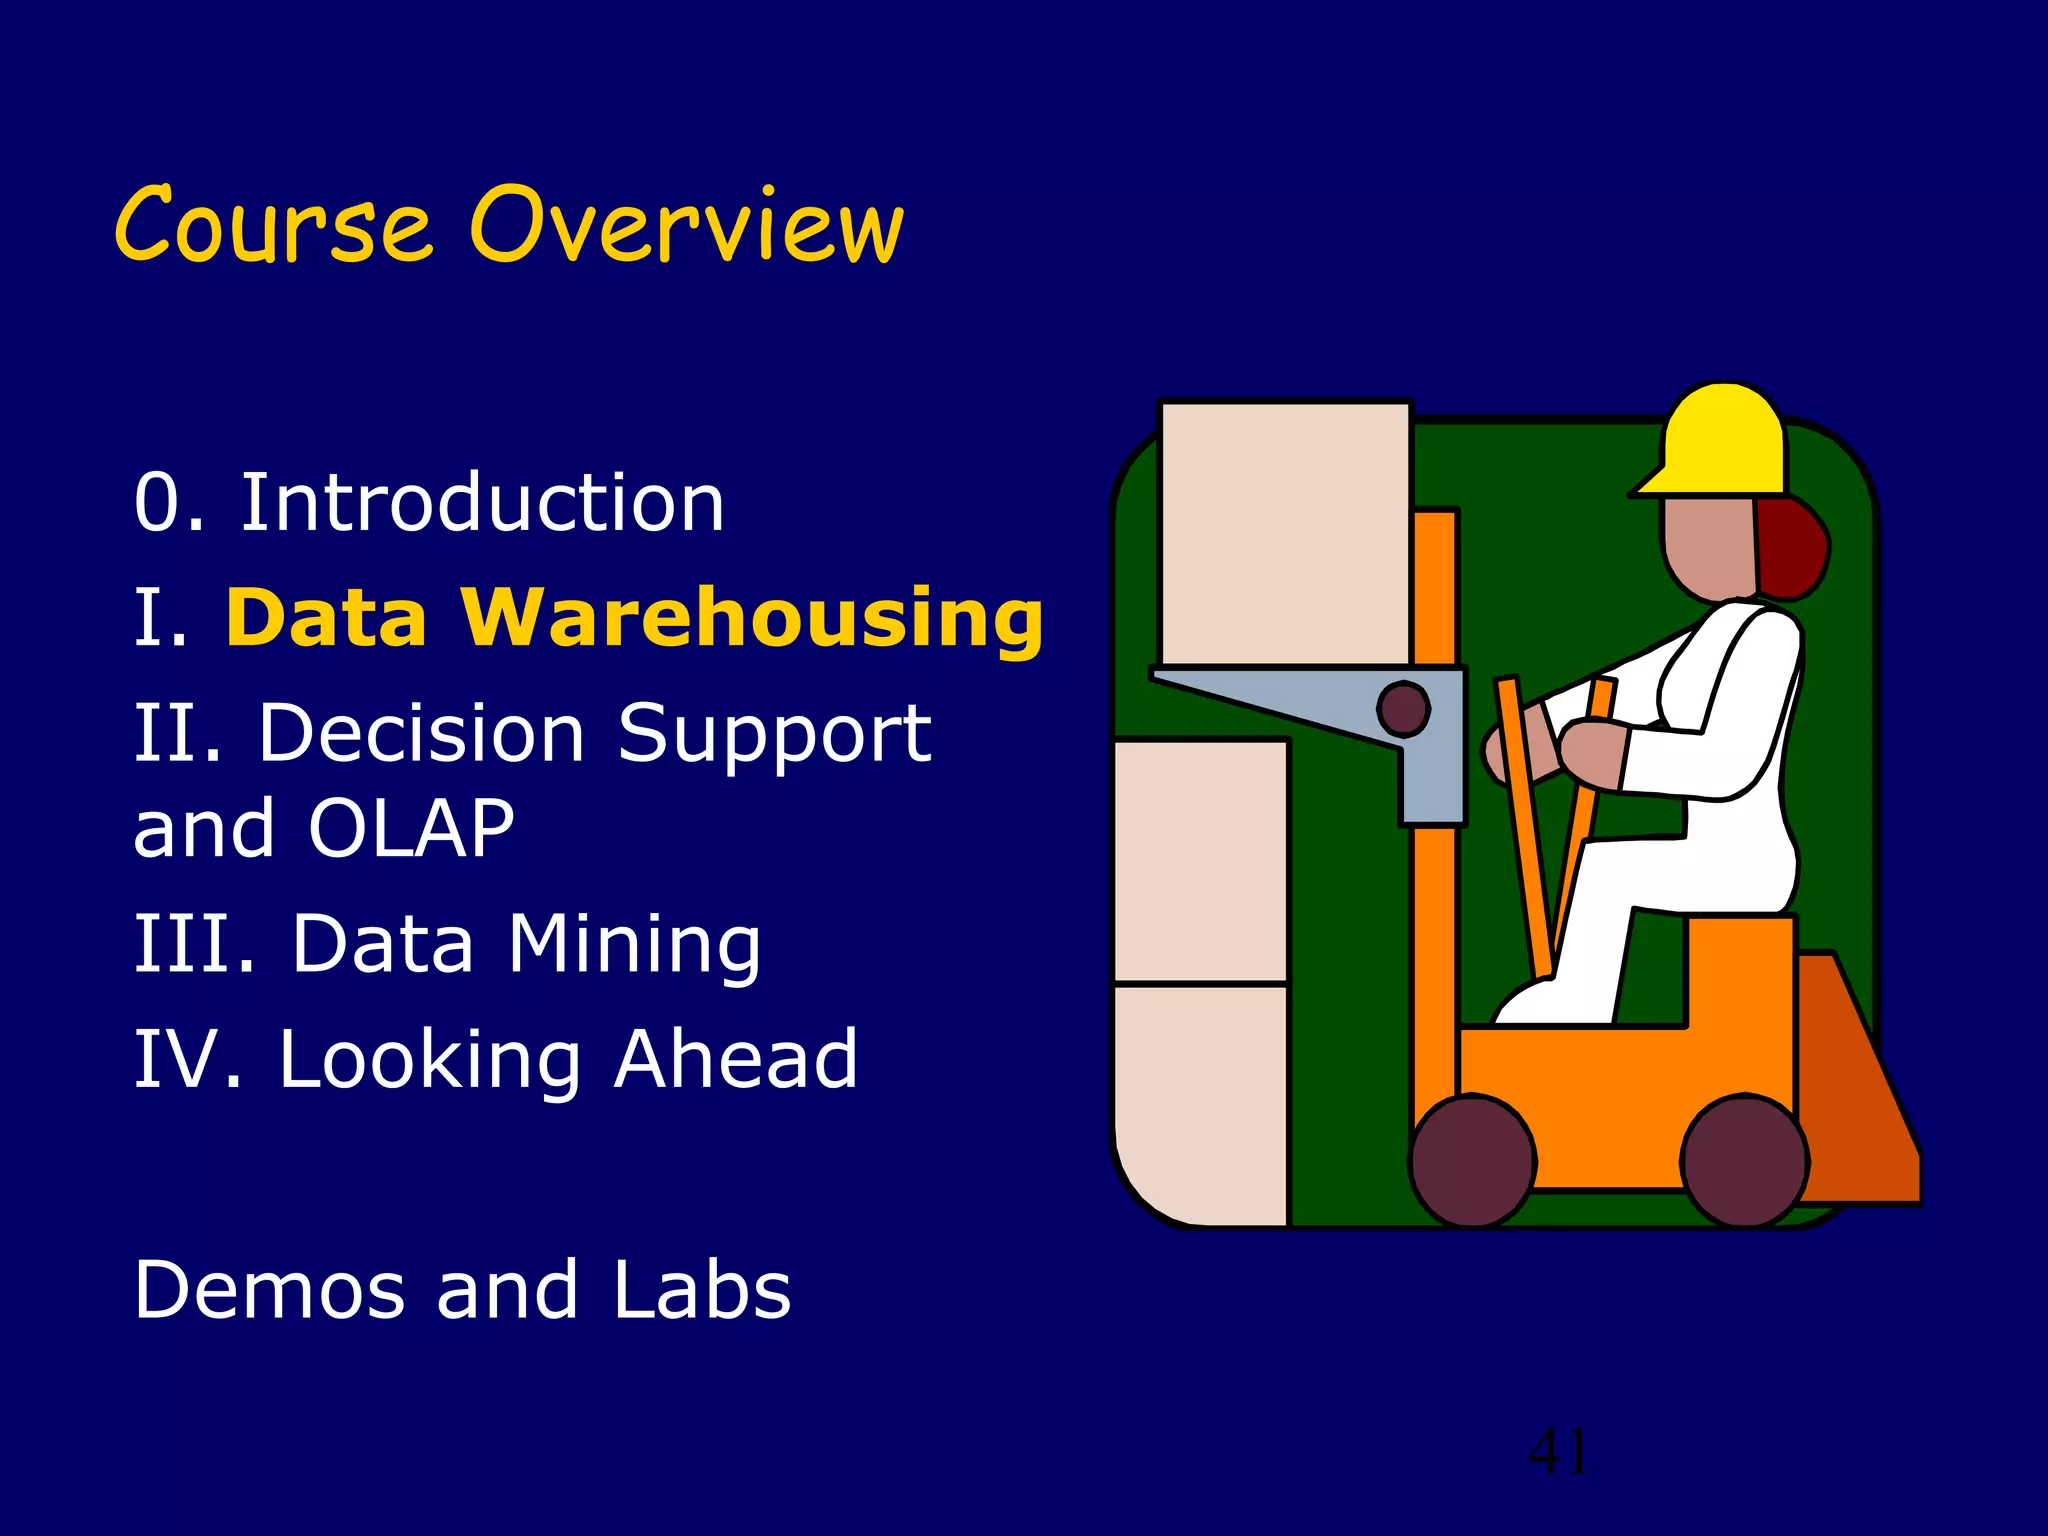
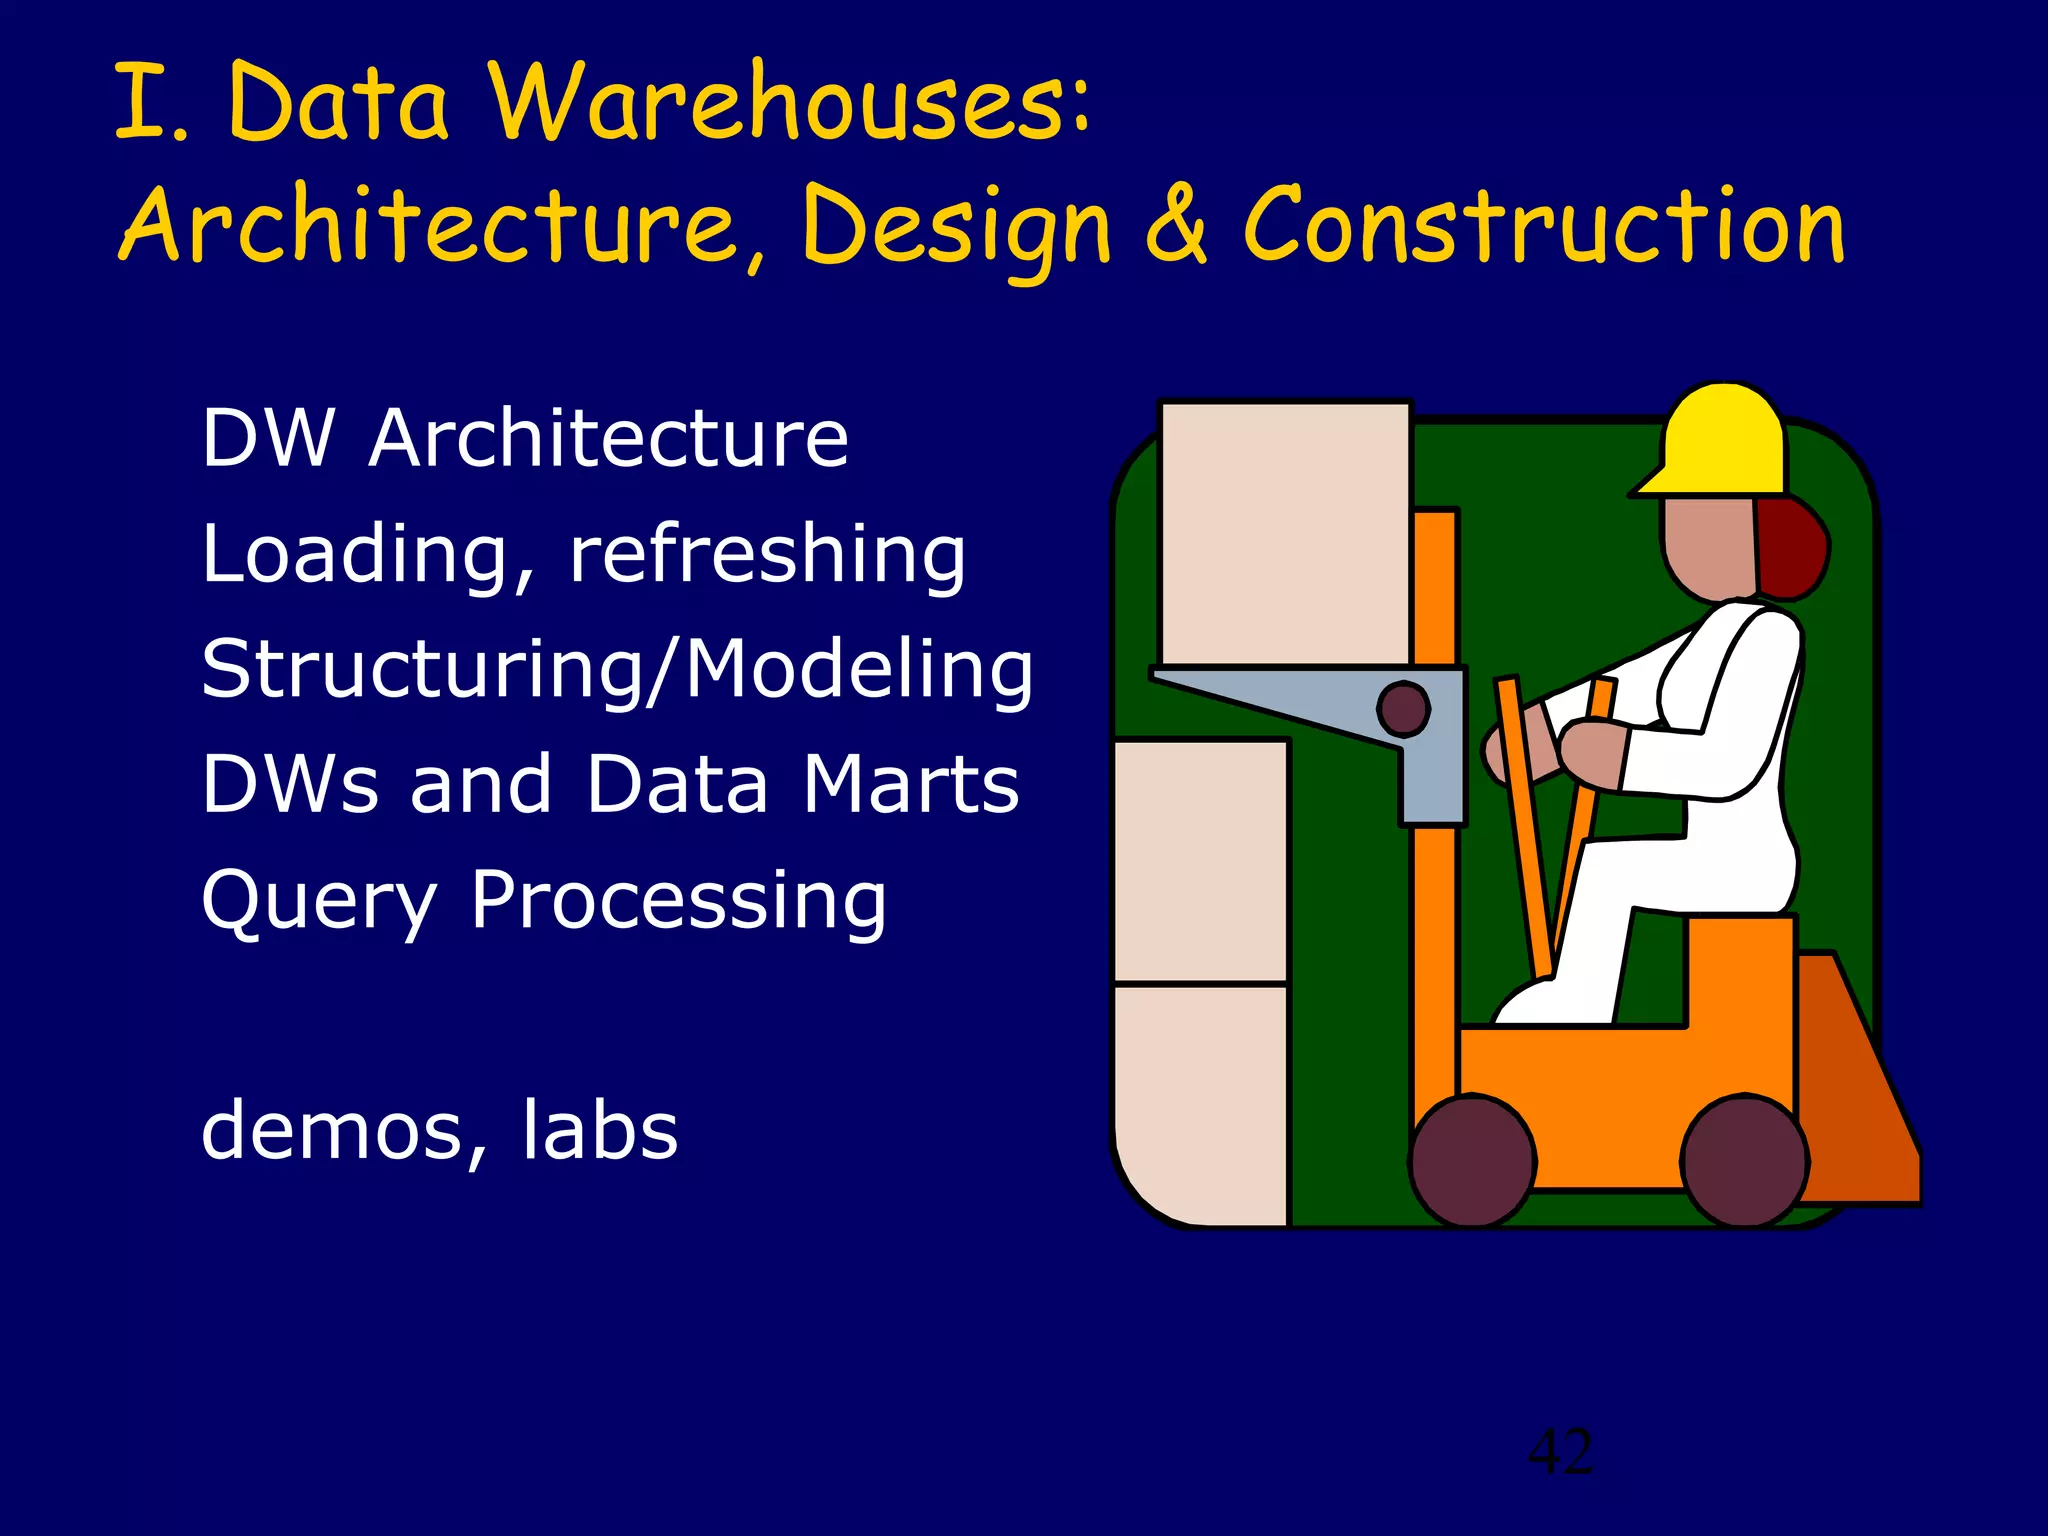
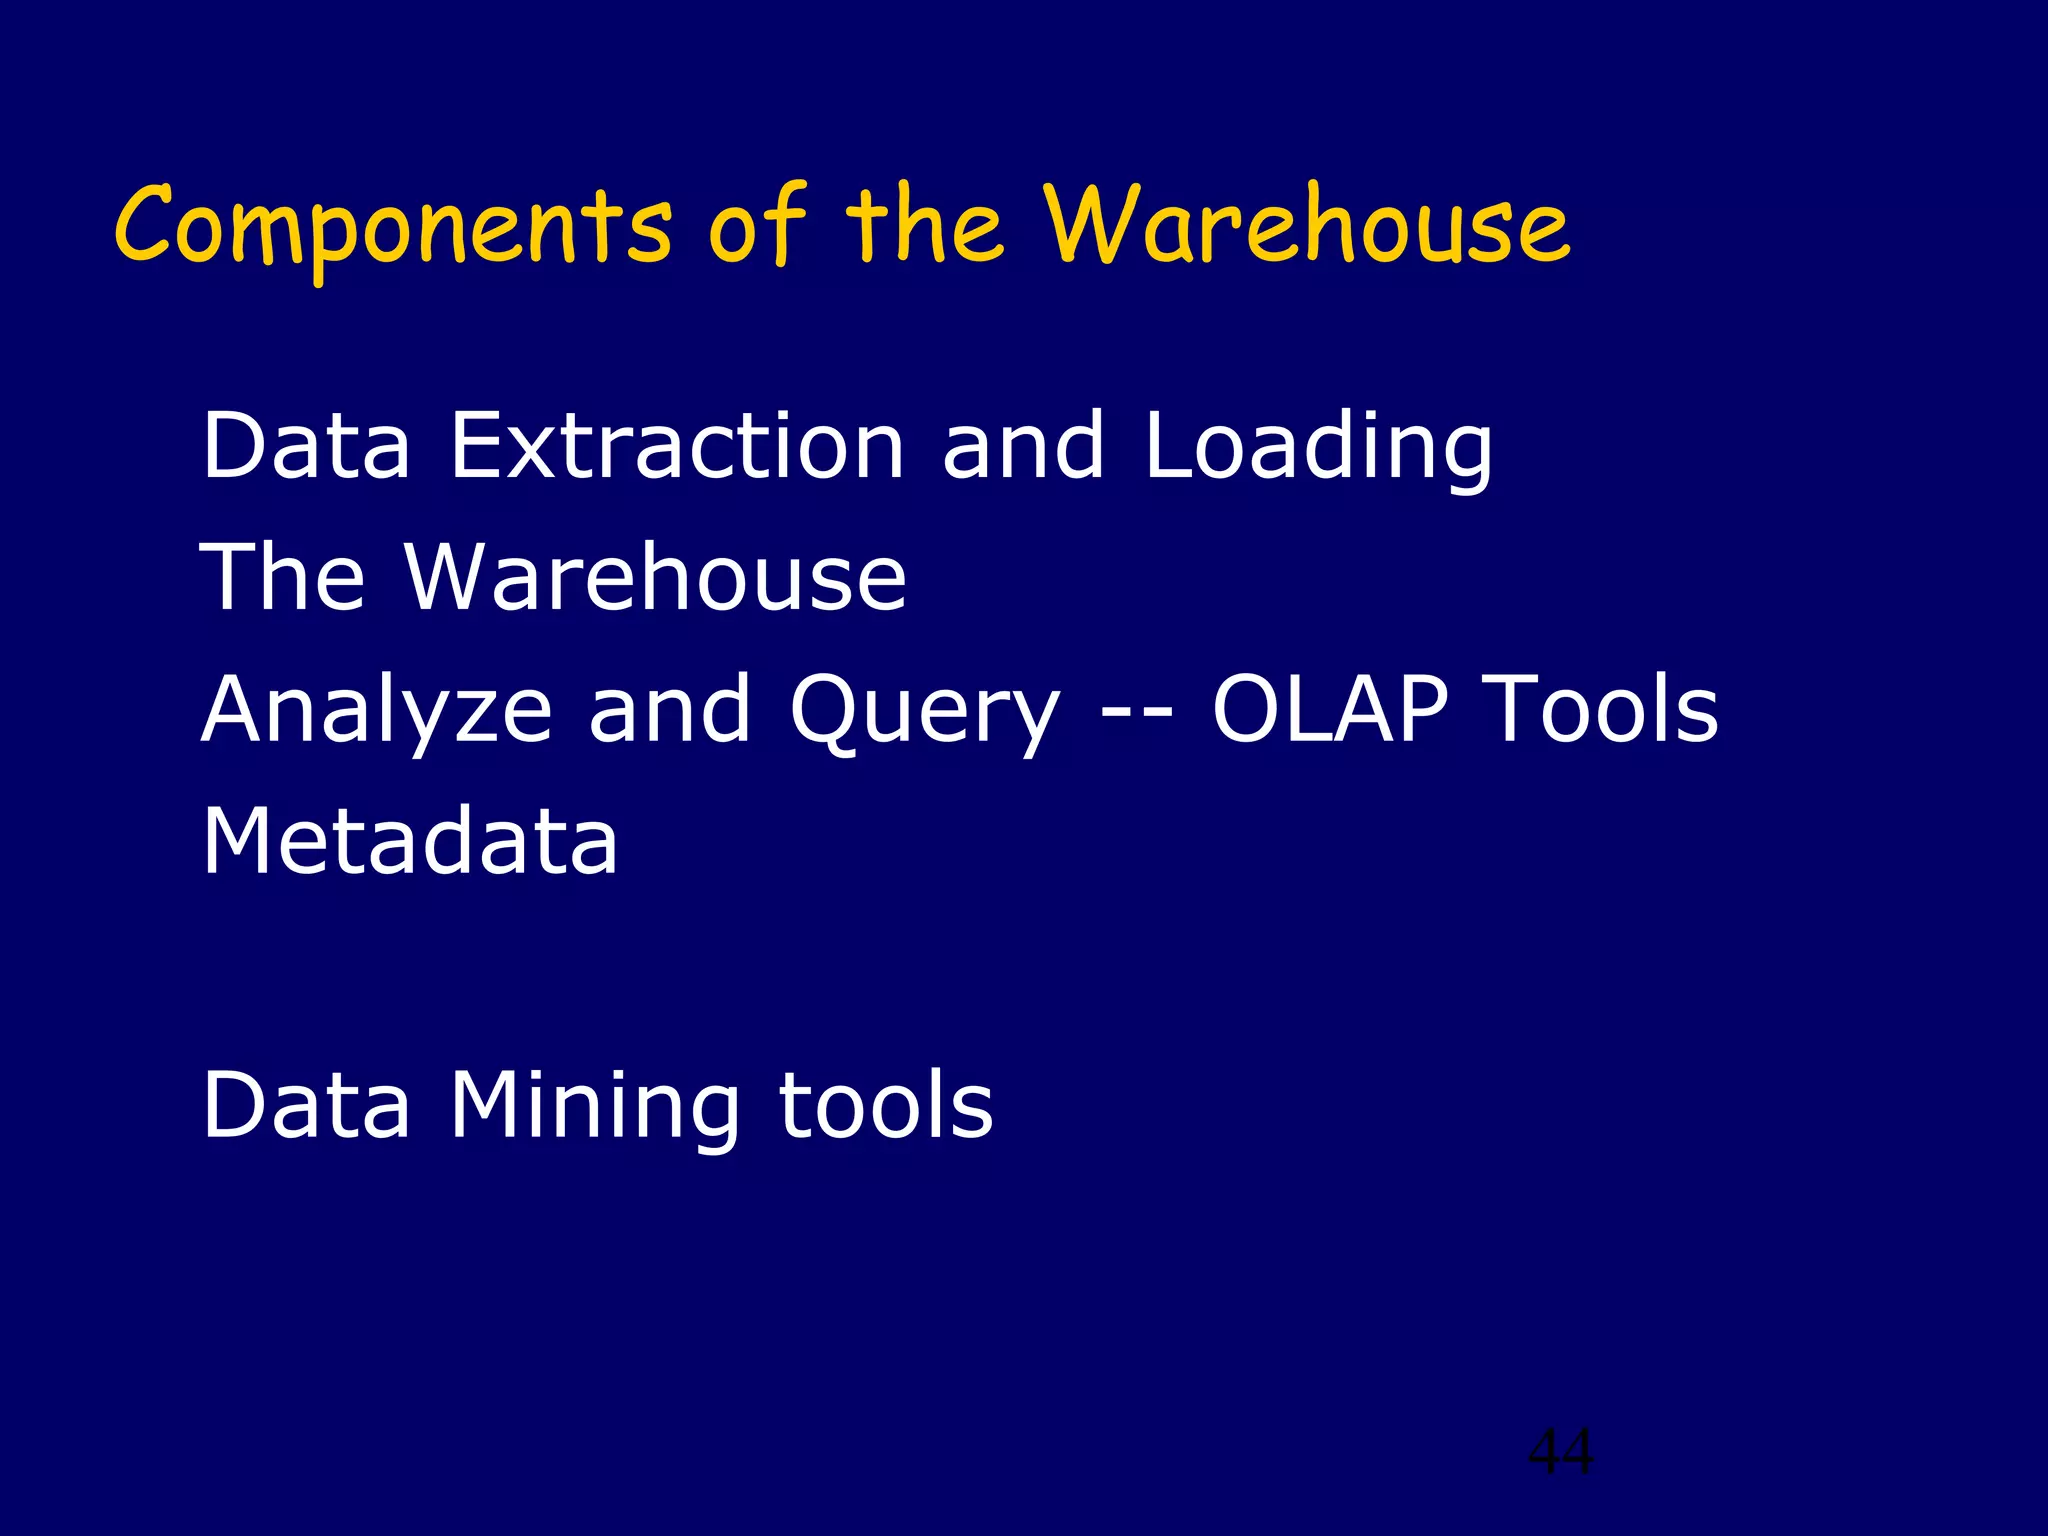

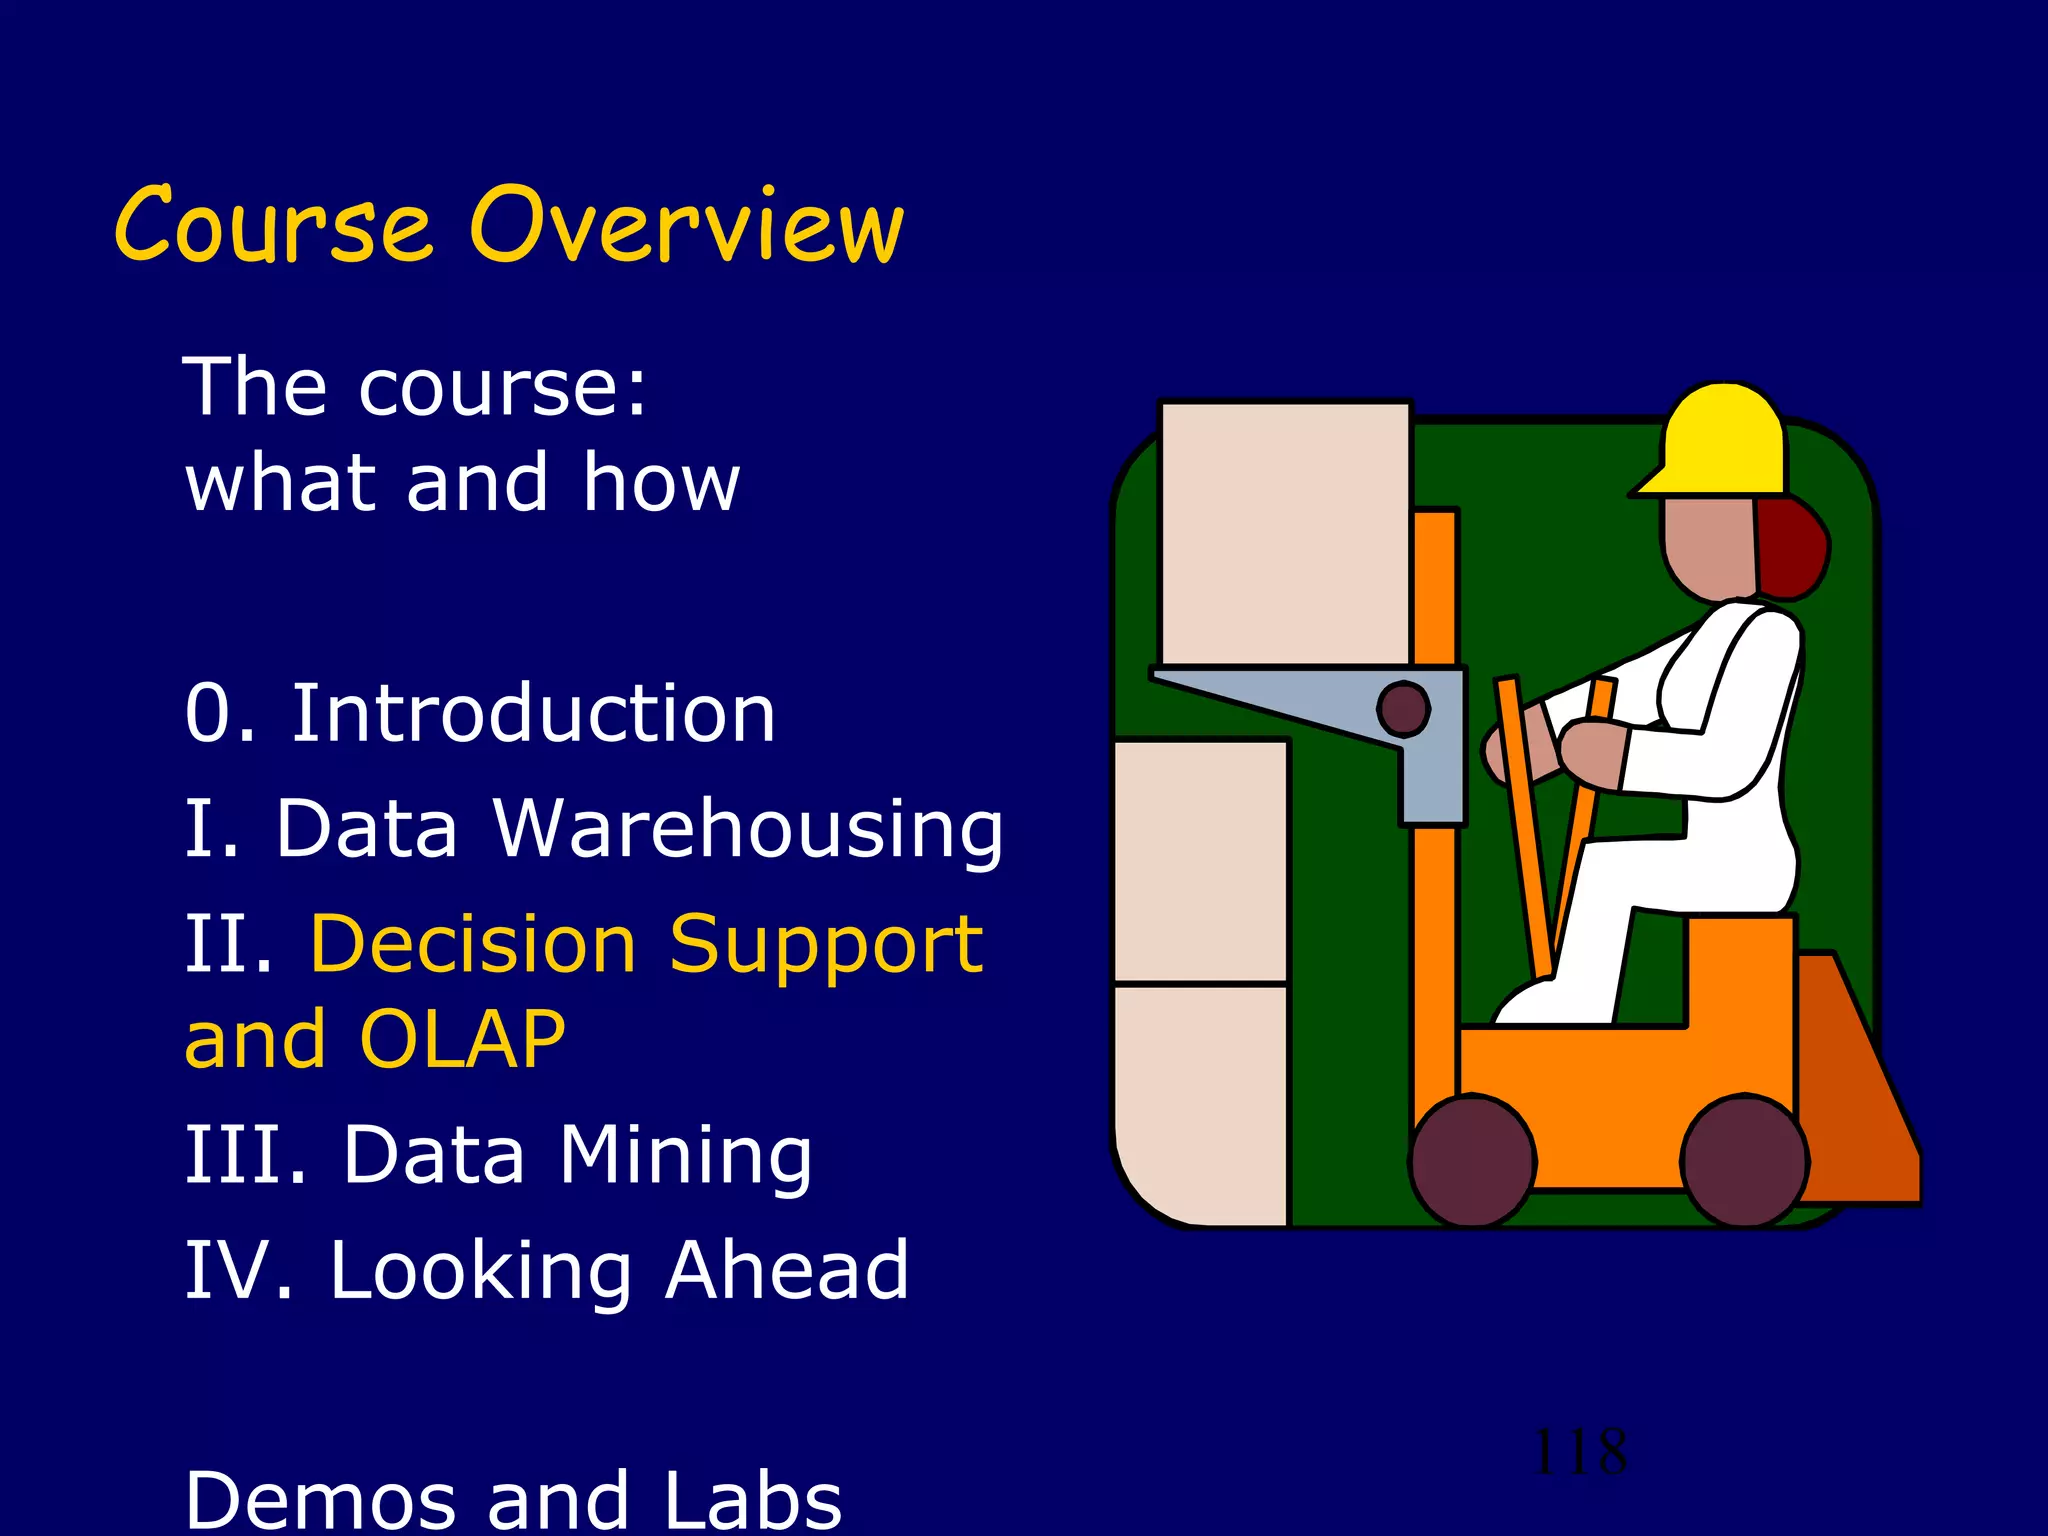


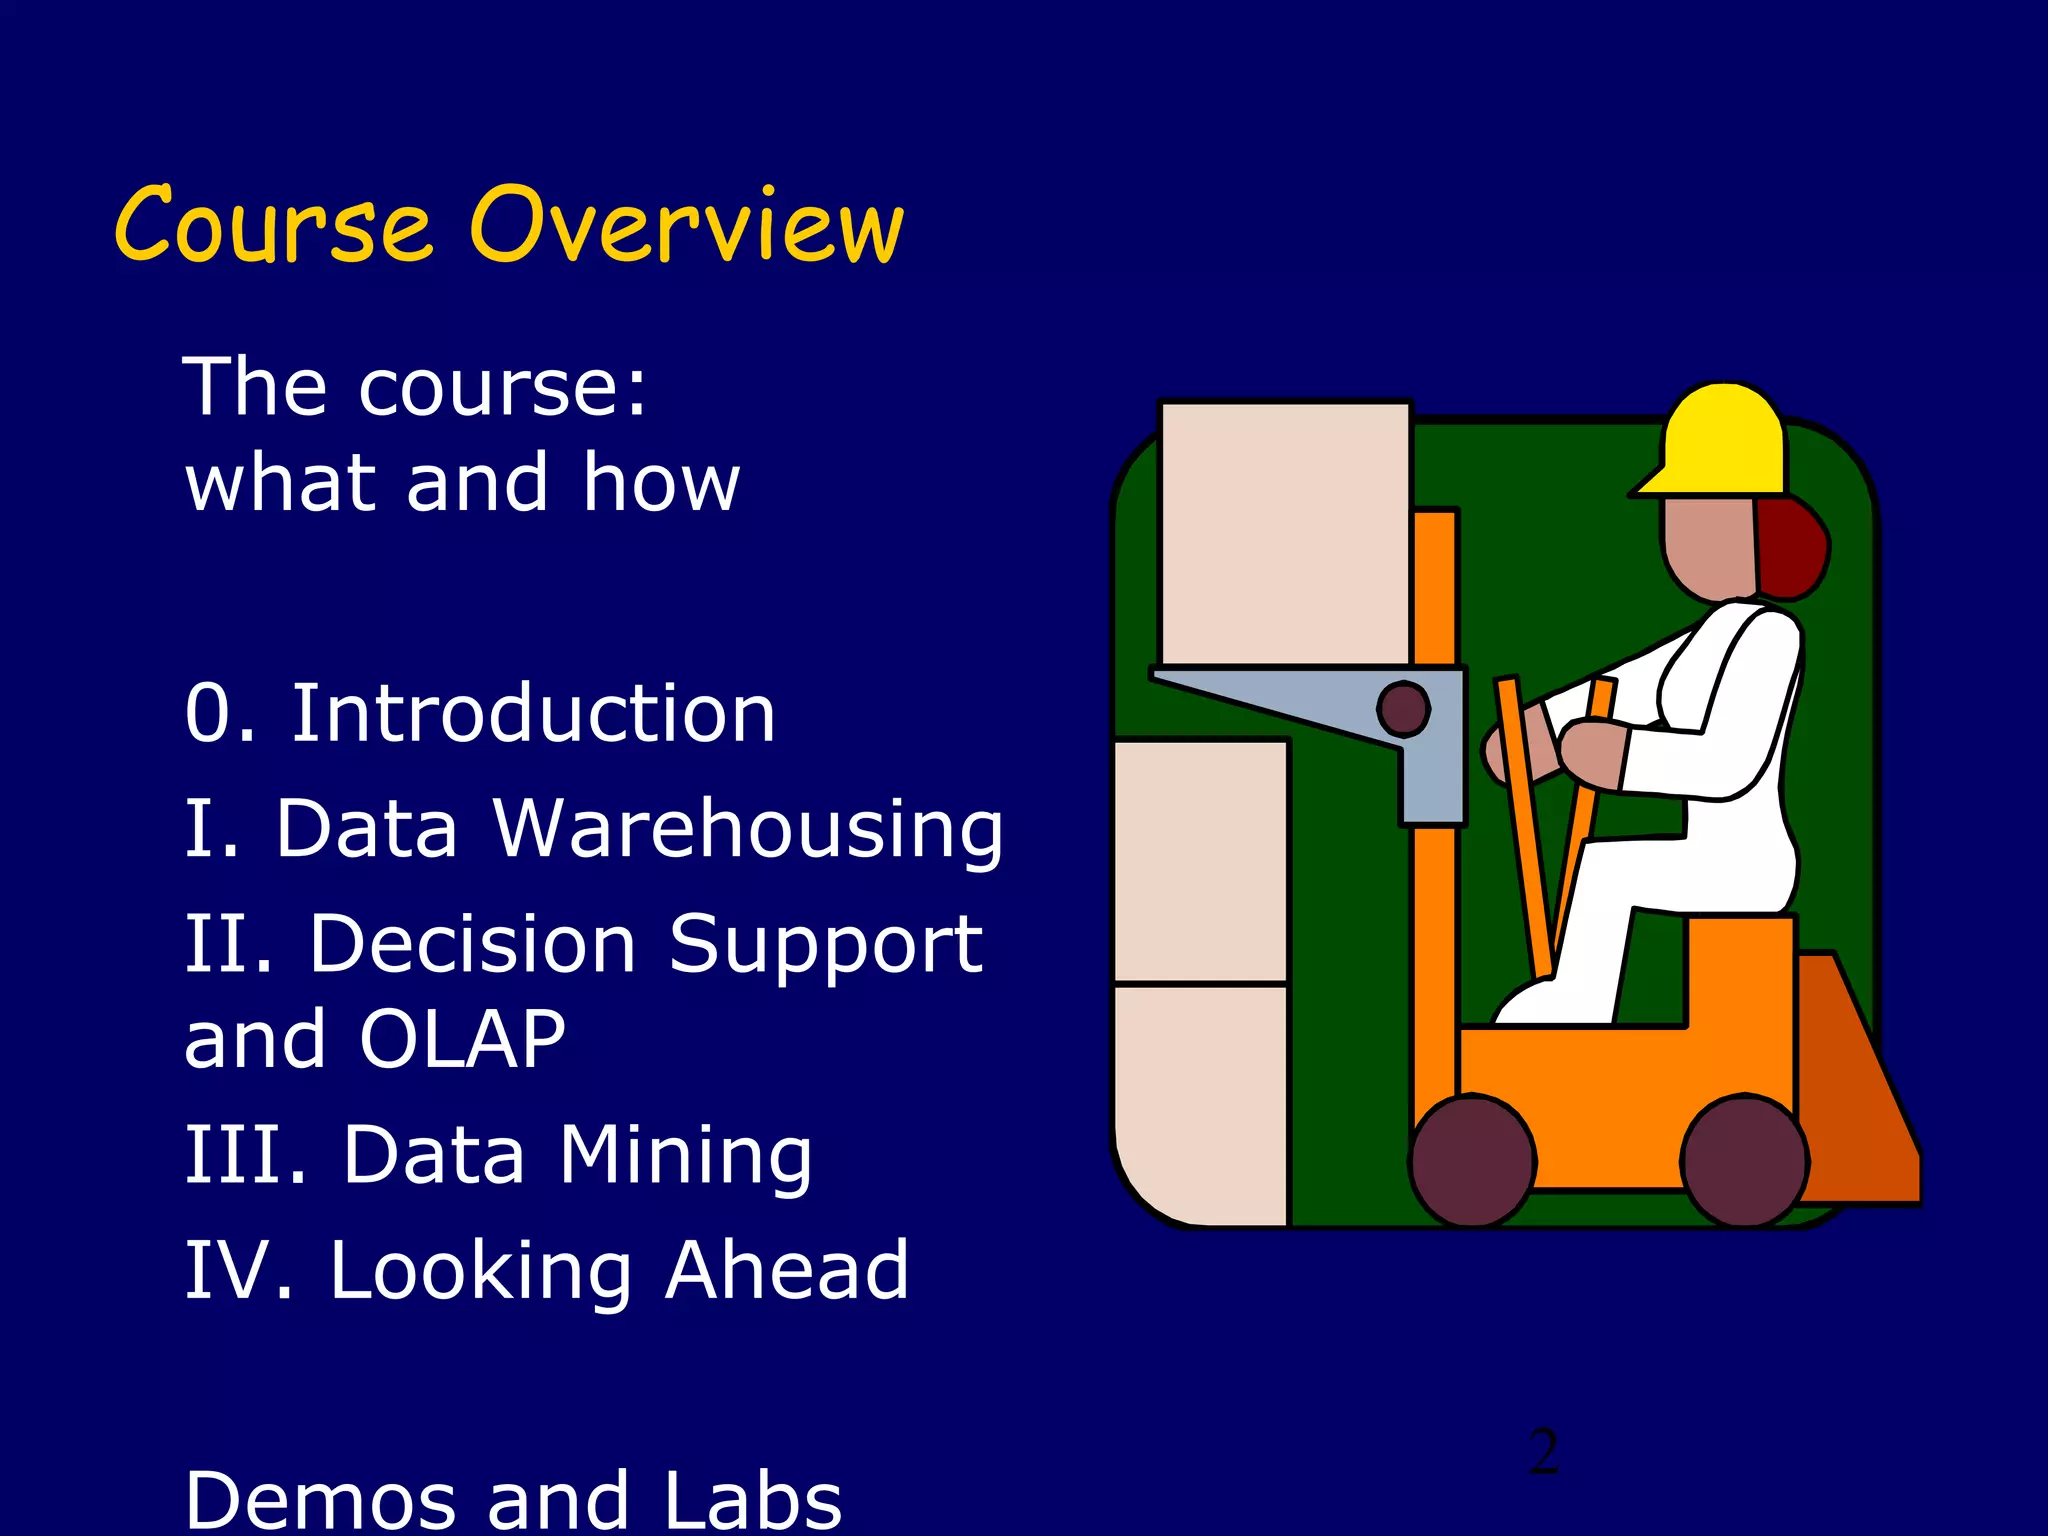
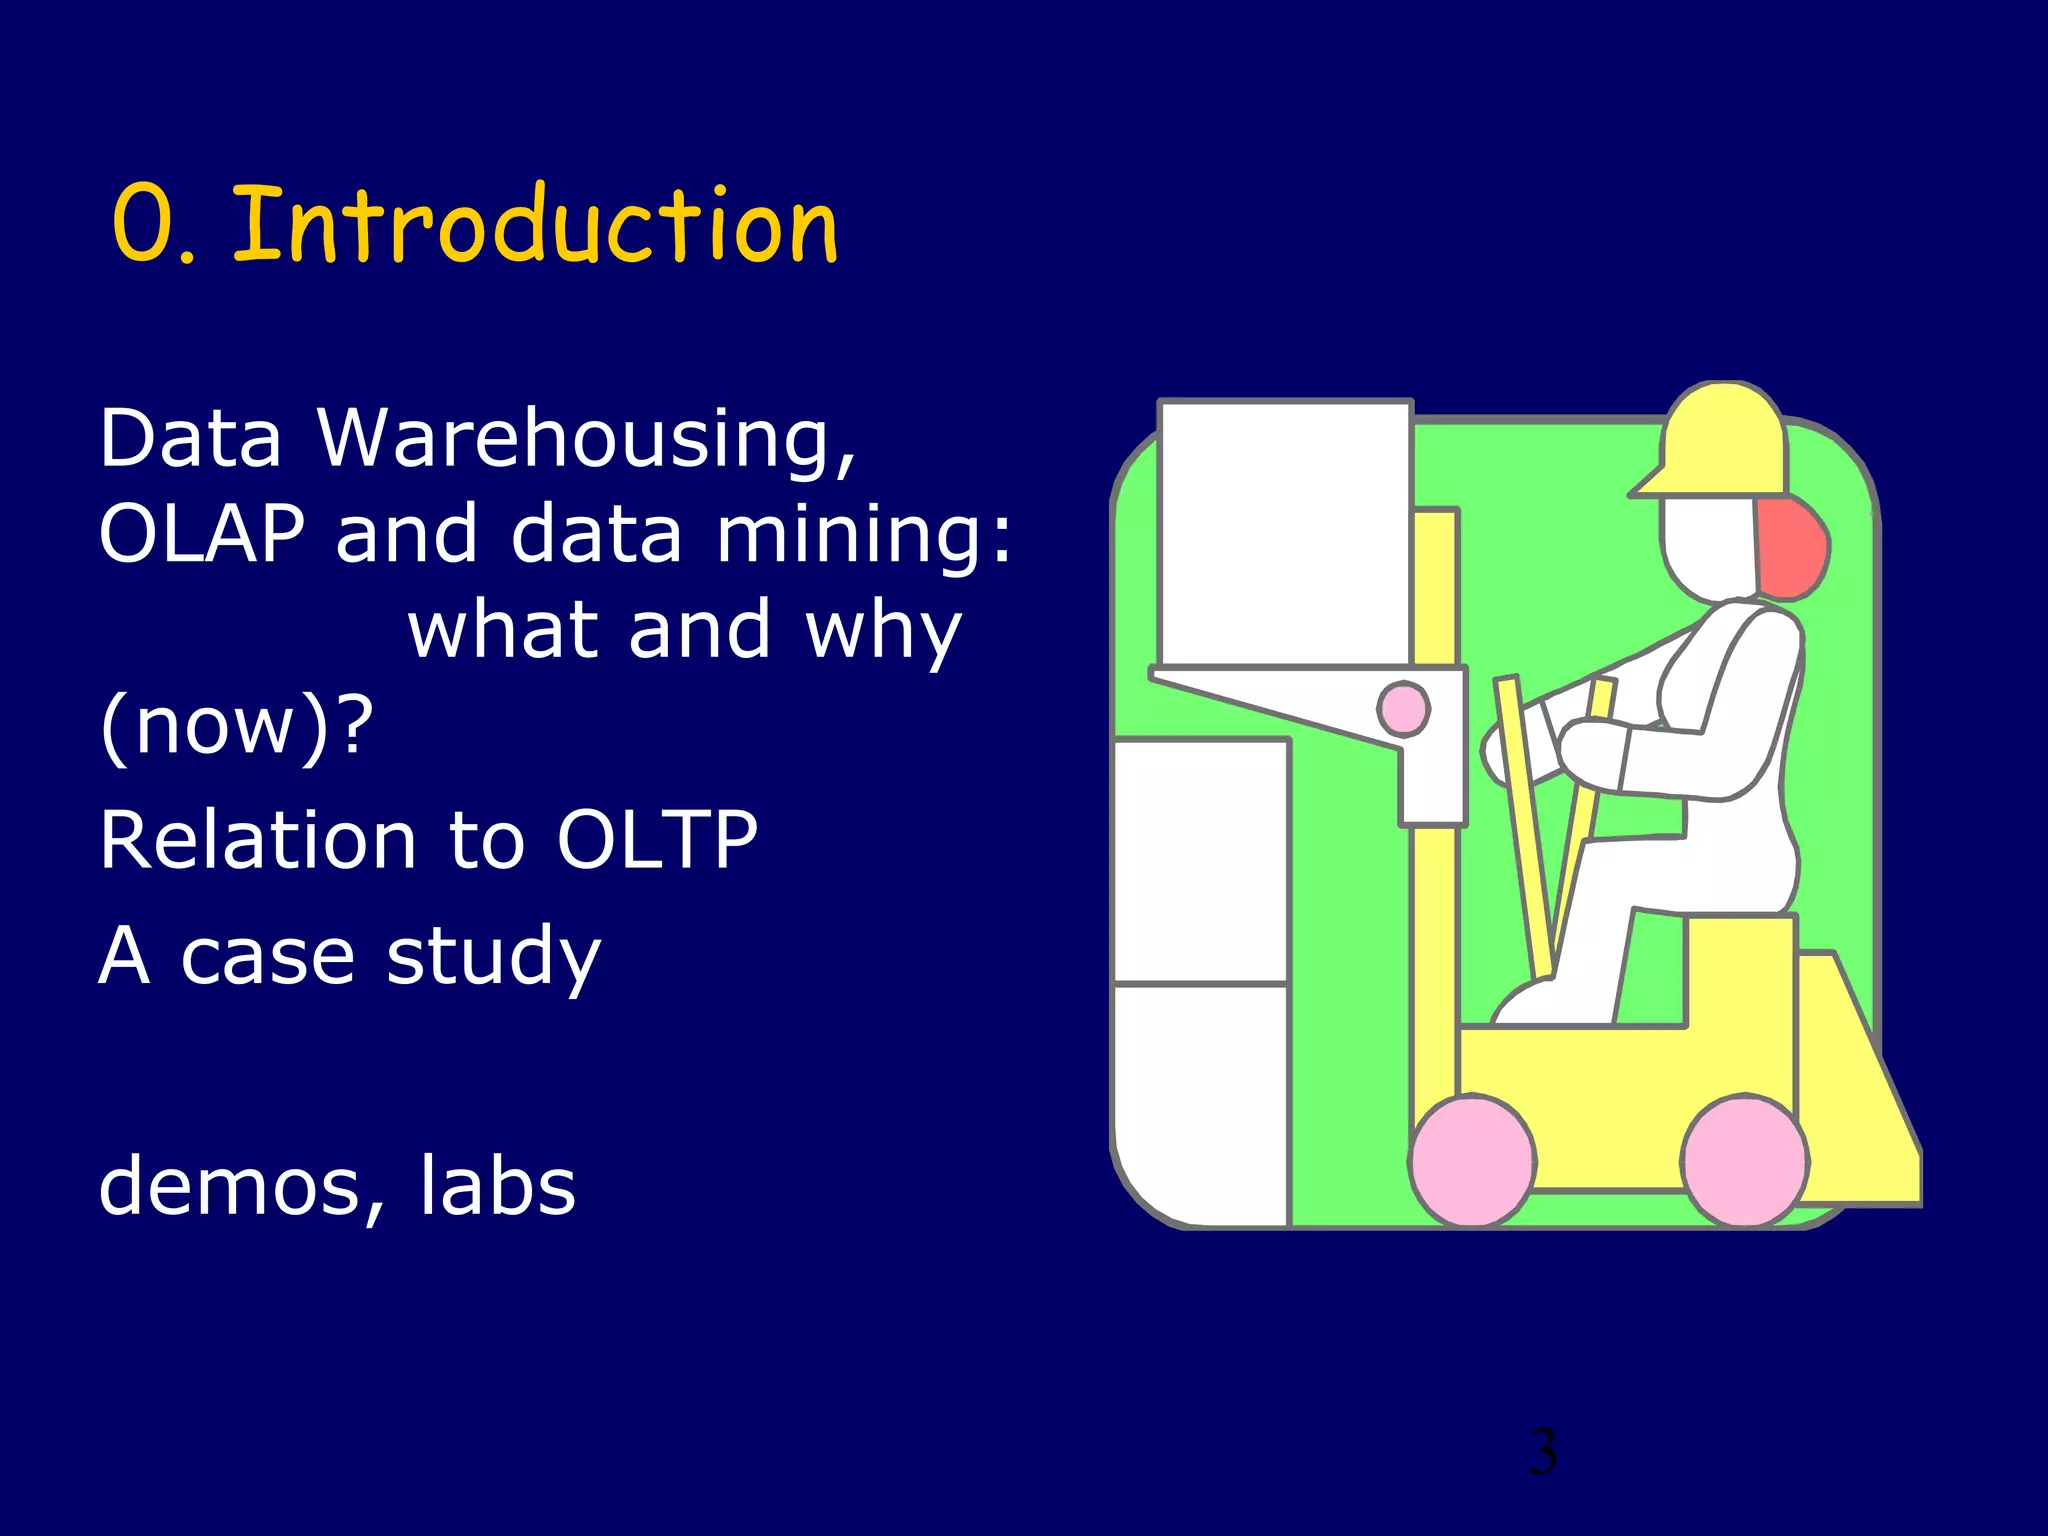
This document provides an overview of a course on data warehousing, decision support, and data mining. It discusses key topics that will be covered, including data warehousing architecture, loading and transforming data, online analytical processing (OLAP), and data mining techniques. The course aims to explain how these tools and techniques can help organizations make better data-driven decisions.


