Download to read offline


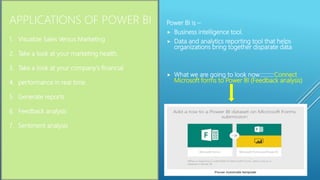

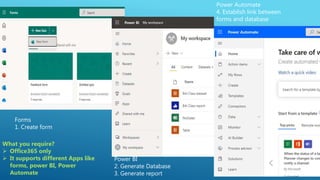
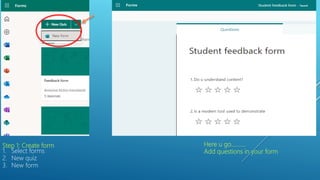
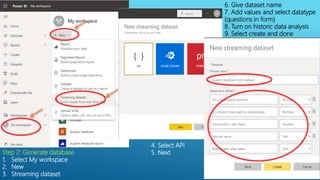
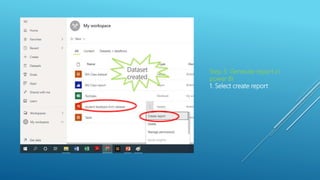
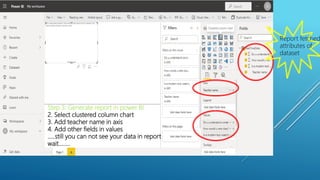
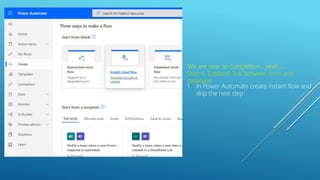
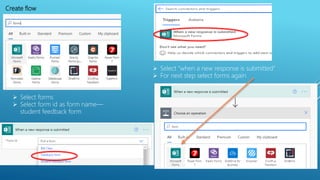
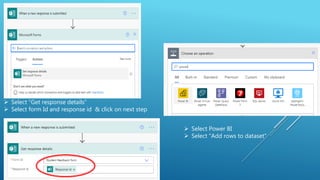
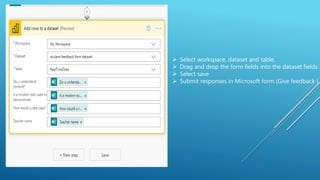
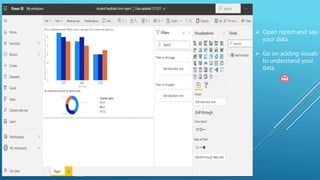

The document outlines the steps to connect Microsoft Forms to Power BI for data visualization, specifically focusing on feedback analysis. It details the process of creating a form, generating a database, and linking the form responses to Power BI for report creation. Additionally, it emphasizes the requirement of Office 365 and the use of Power Automate in establishing connections between the tools.