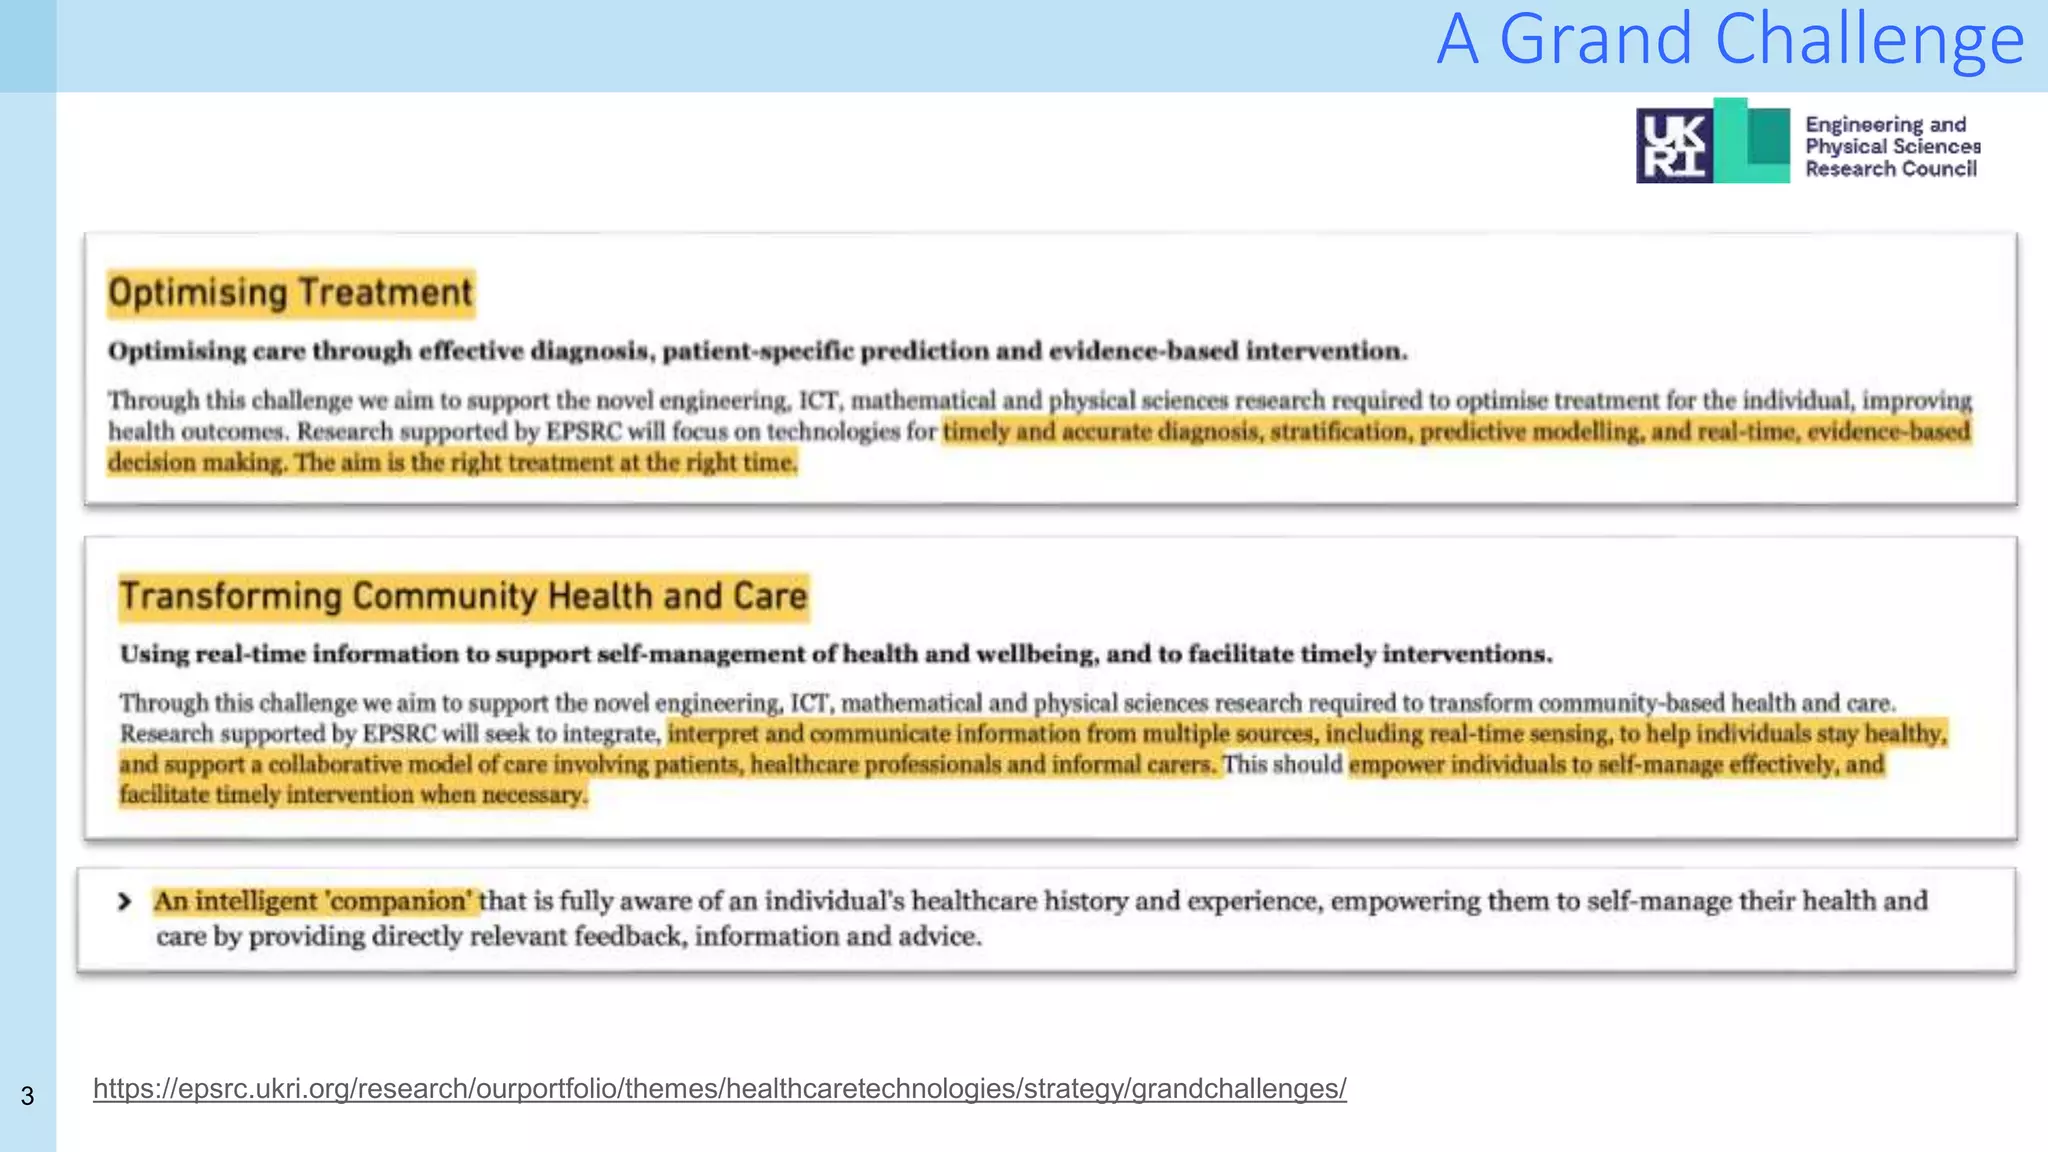
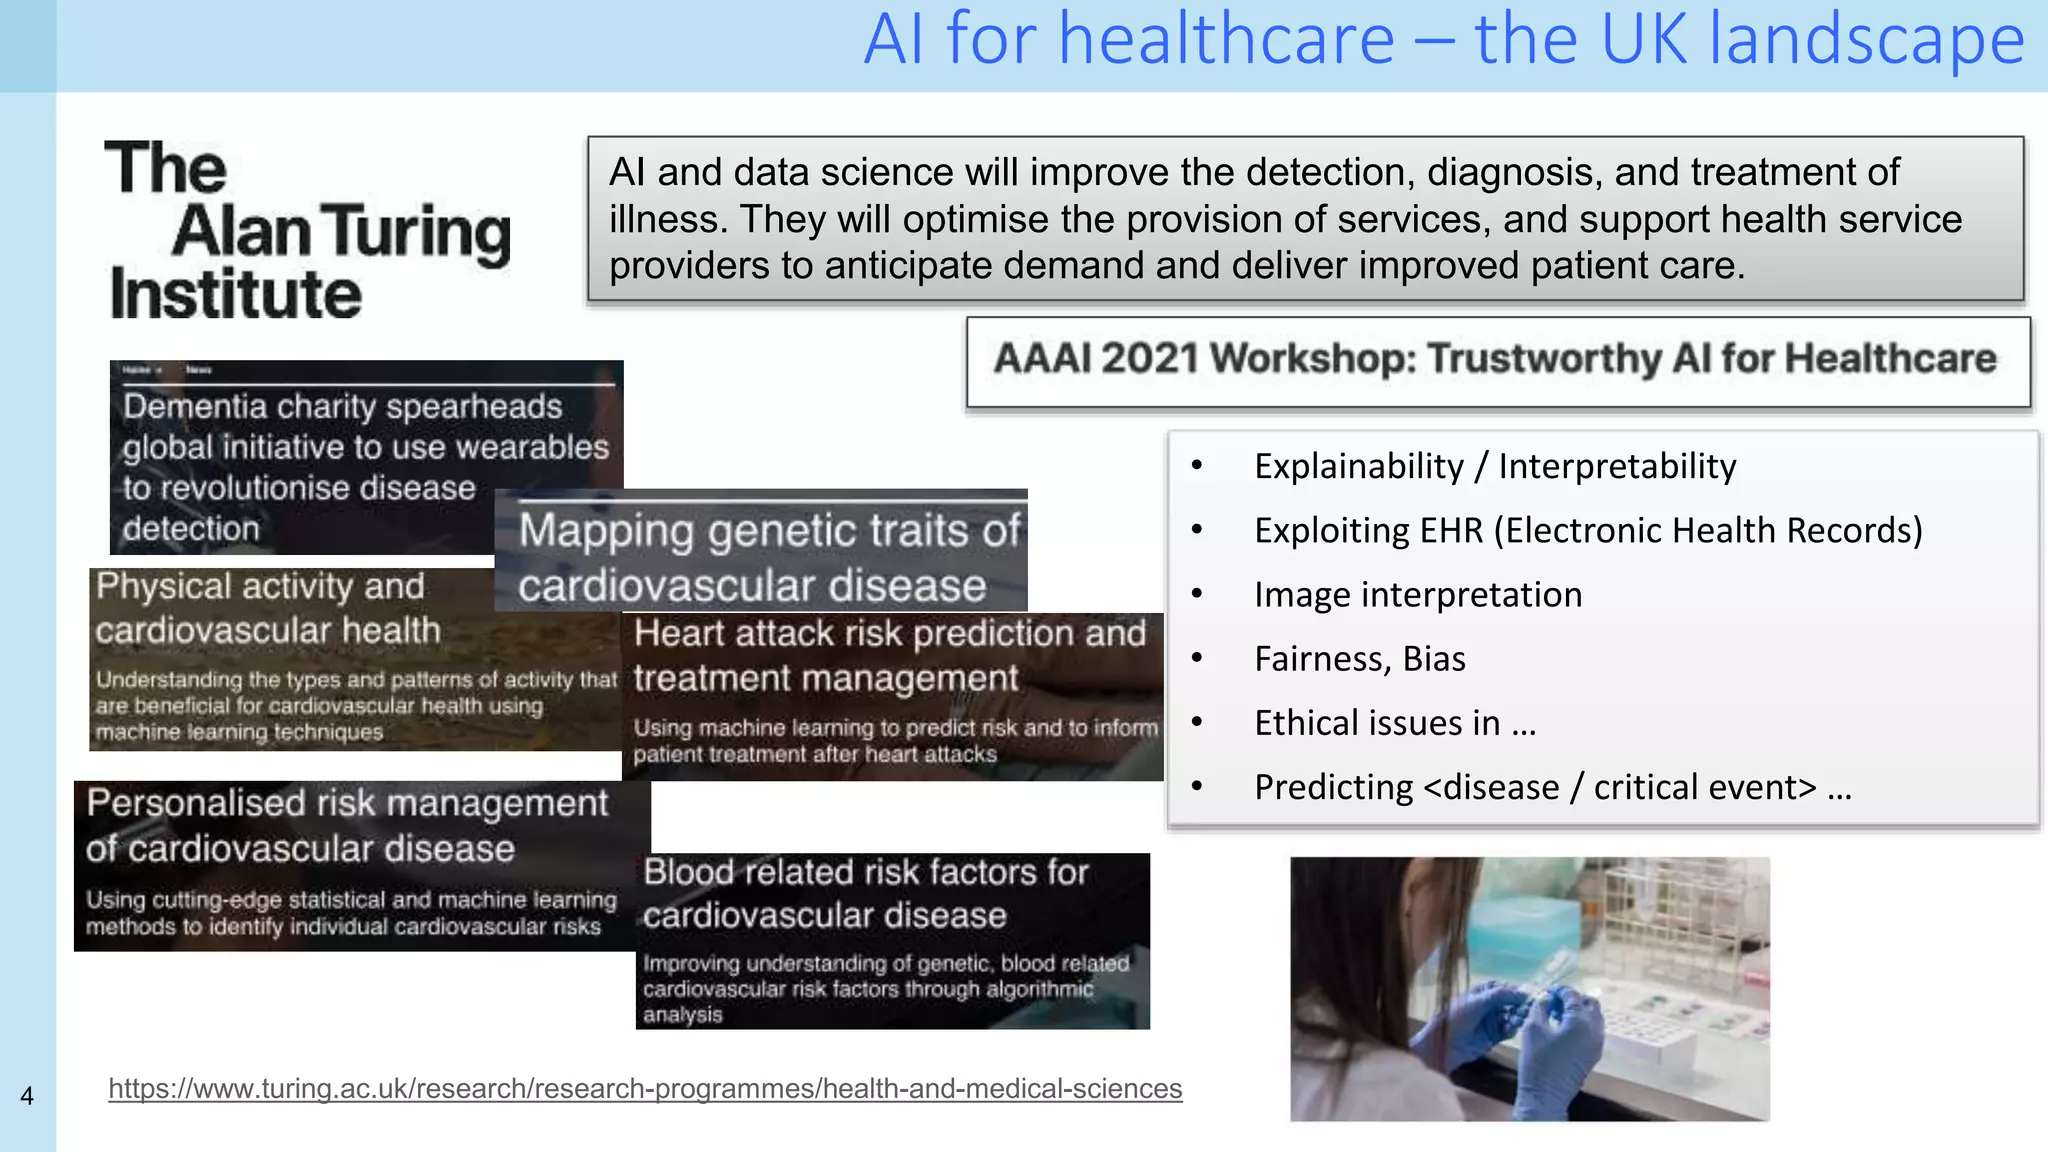
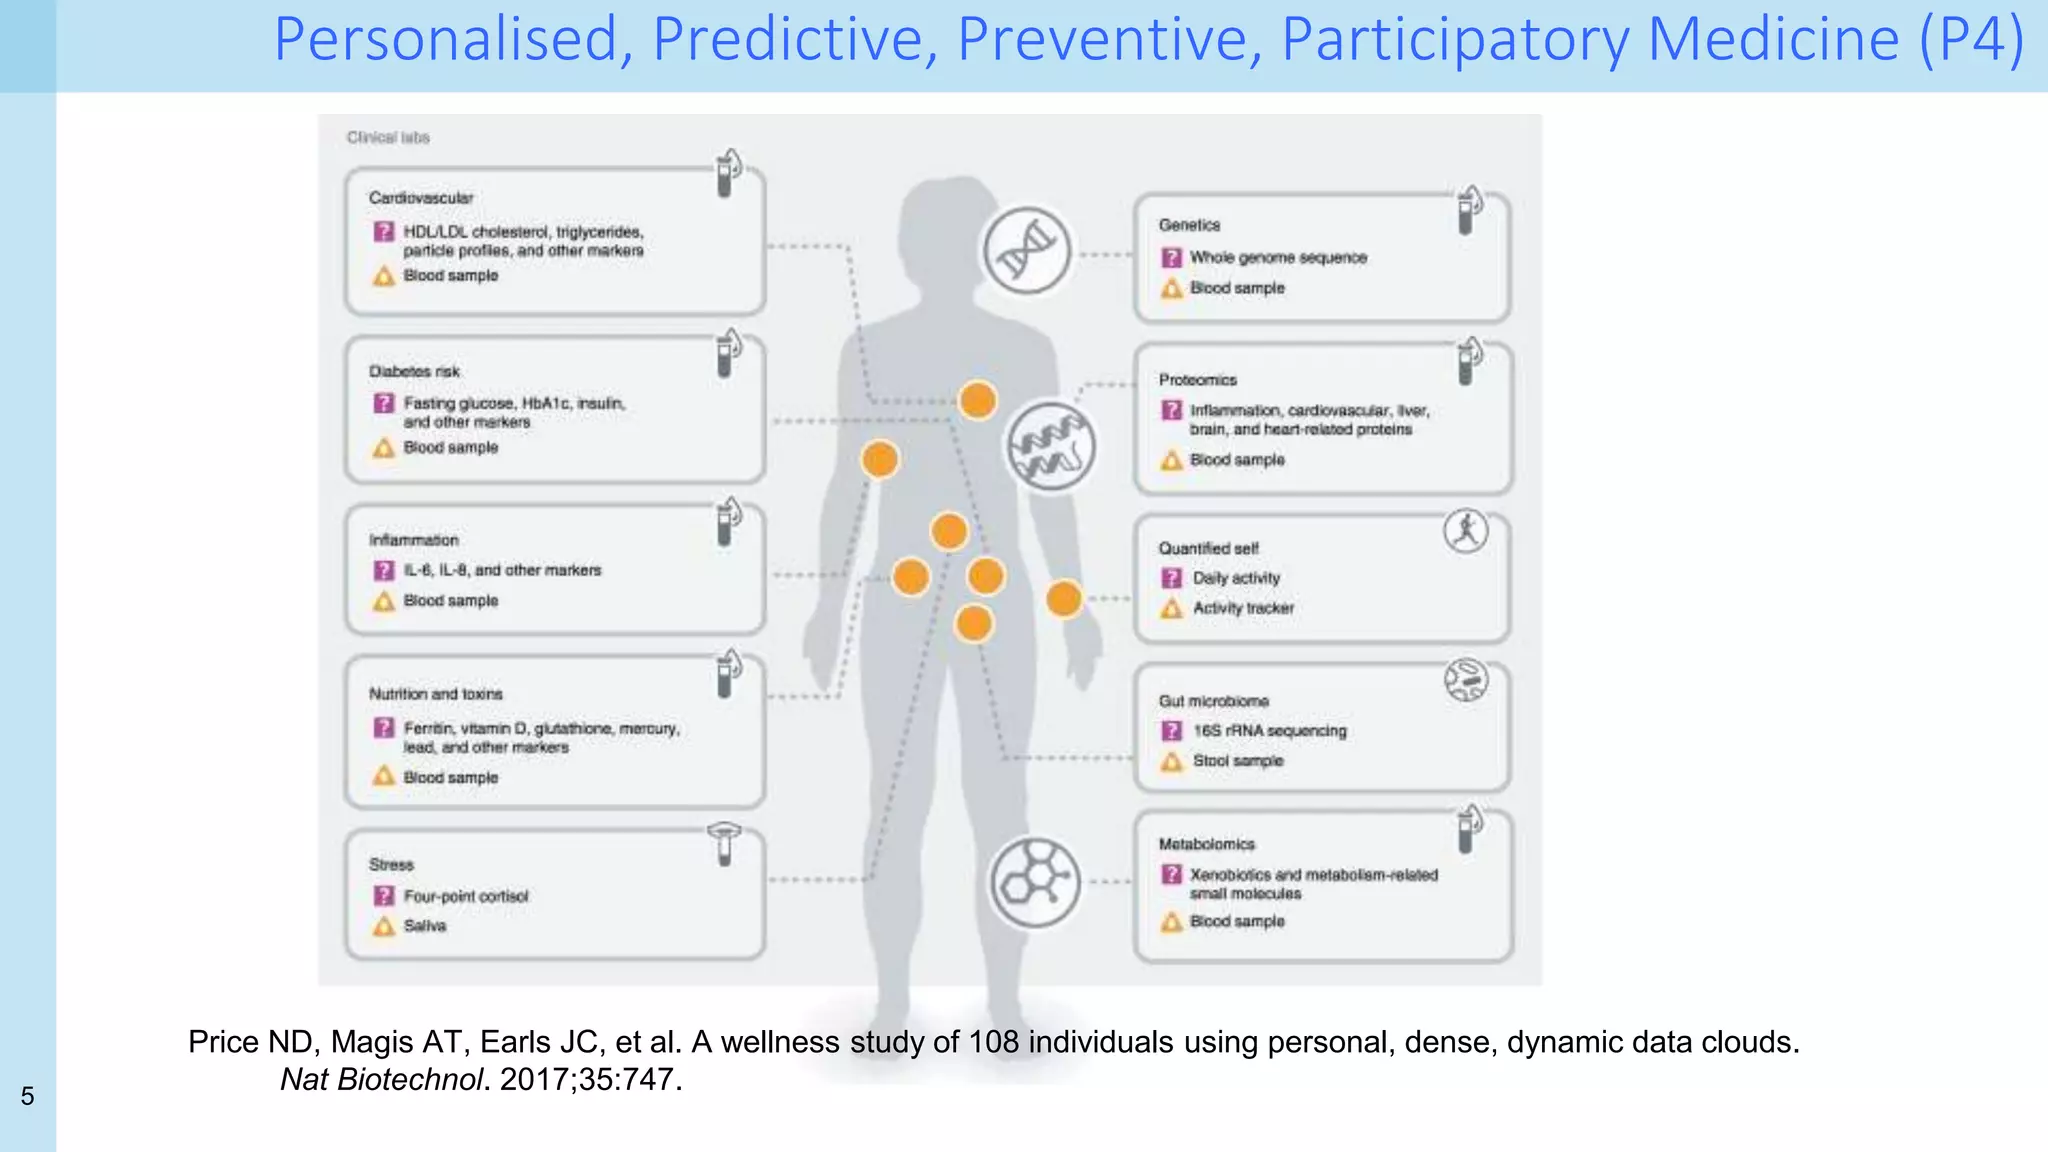
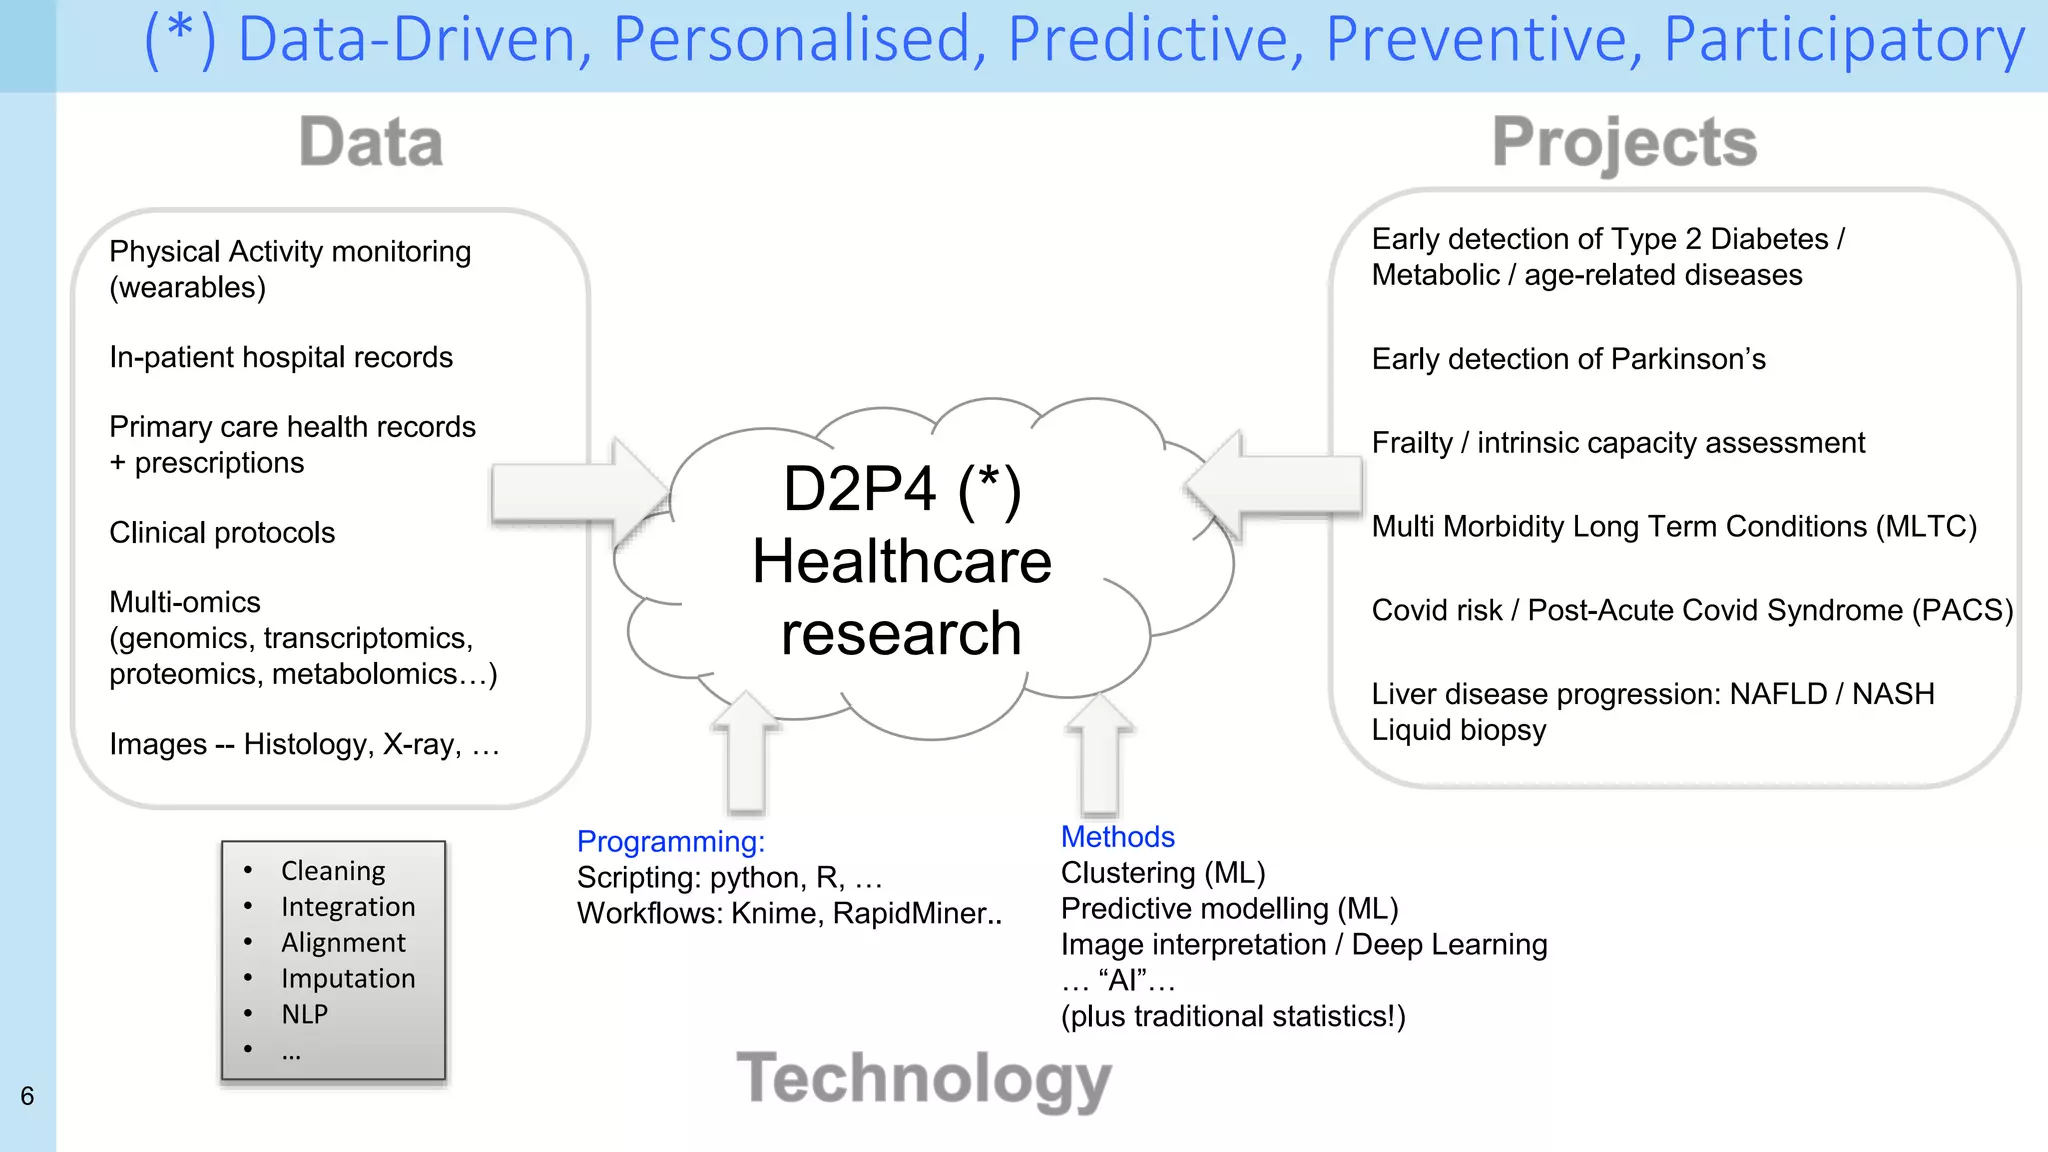
Download to read offline

![10
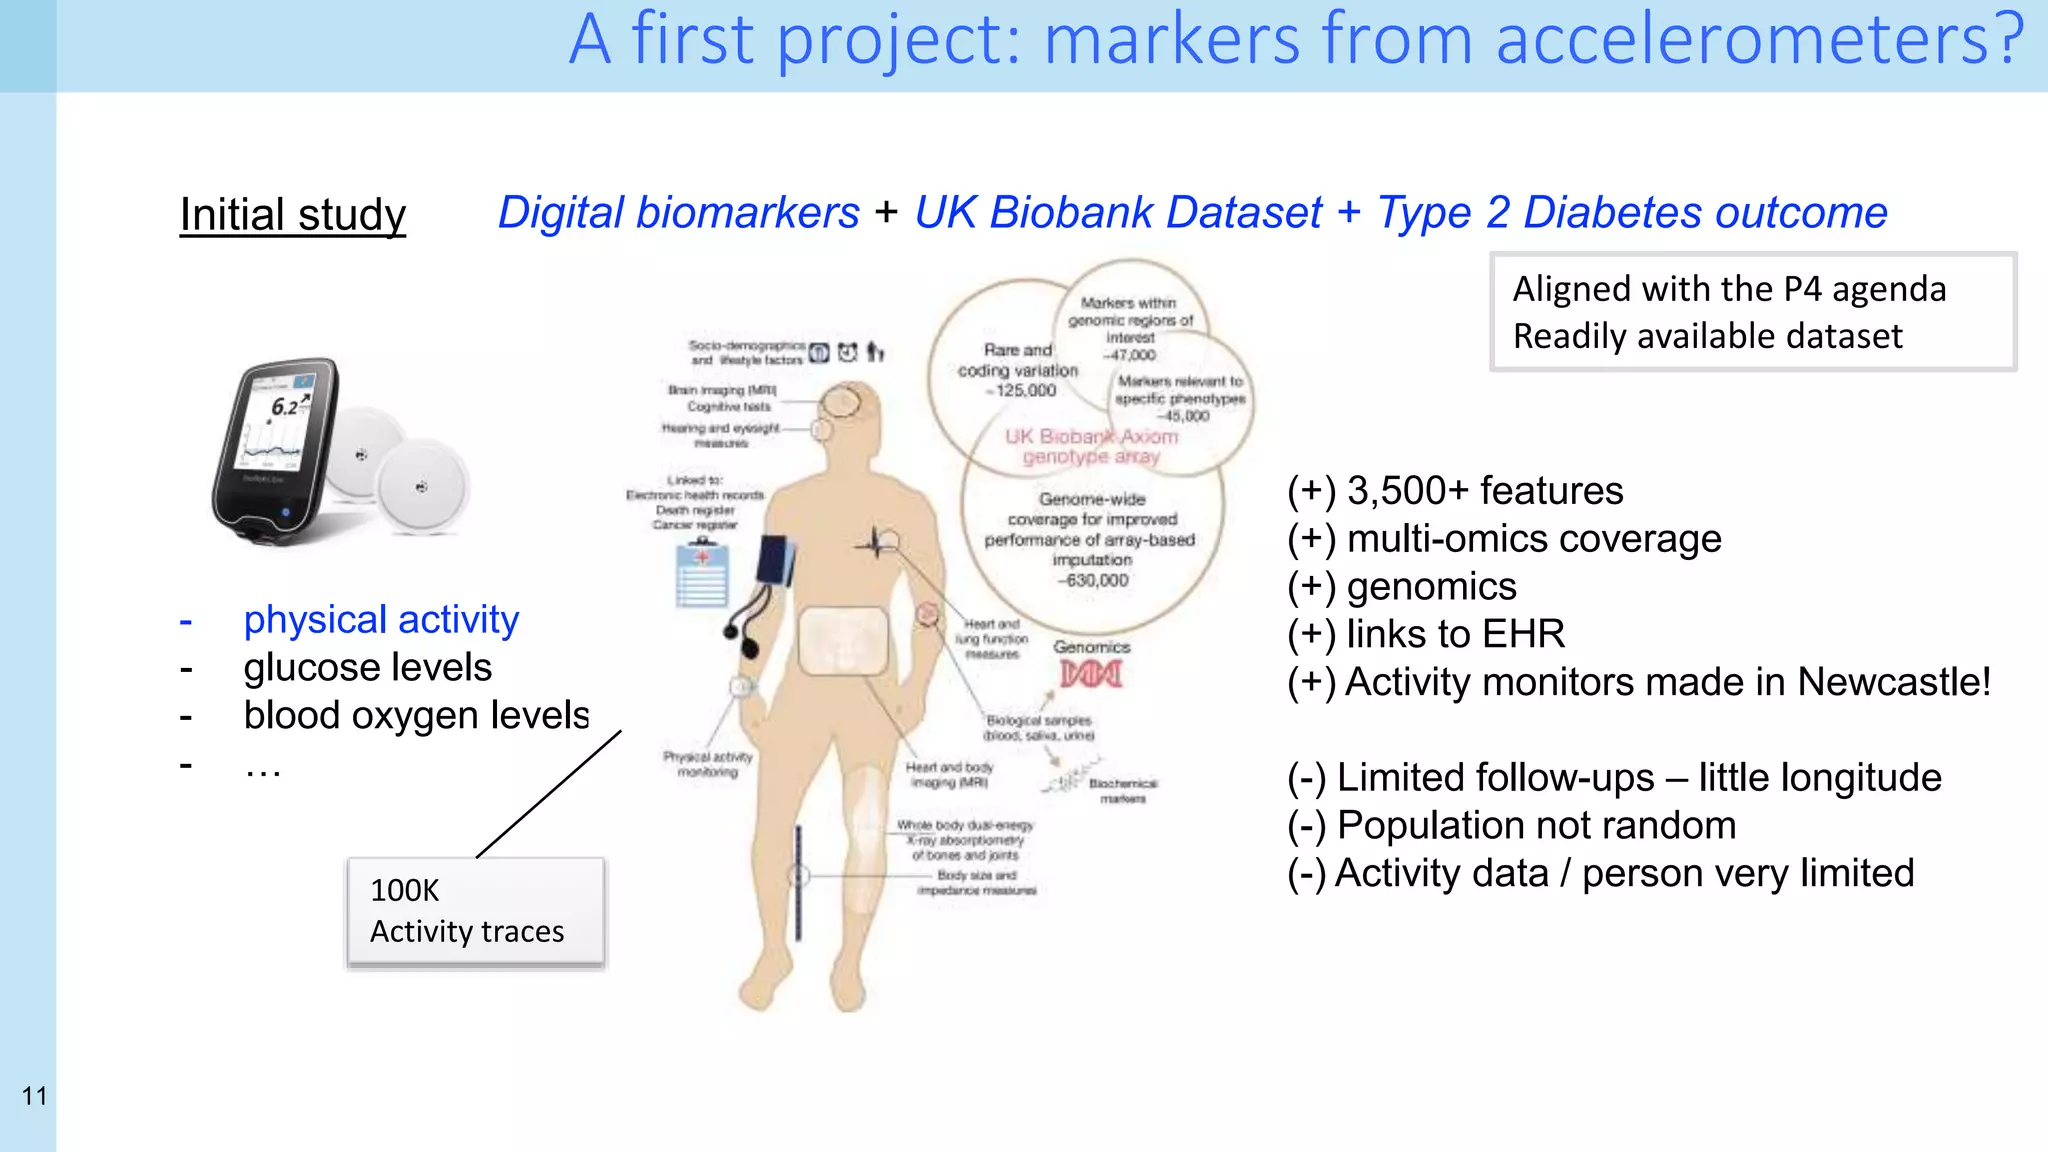
Digital biomarkers
Digital biomarkers come from "novel sensing systems capable of continuously tracking
behavioral signals […] capture people's everyday routines, actions, and physiological
changes that can explain outcomes related to health, cognitive abilities, and more”
(Choudhury 2018).
Choudhury, Tanzeem. 2018. “Making Sleep Tracking More User Friendly.” Communications of the ACM 61 (11): 156–156.
https://doi.org/10.1145/3266285
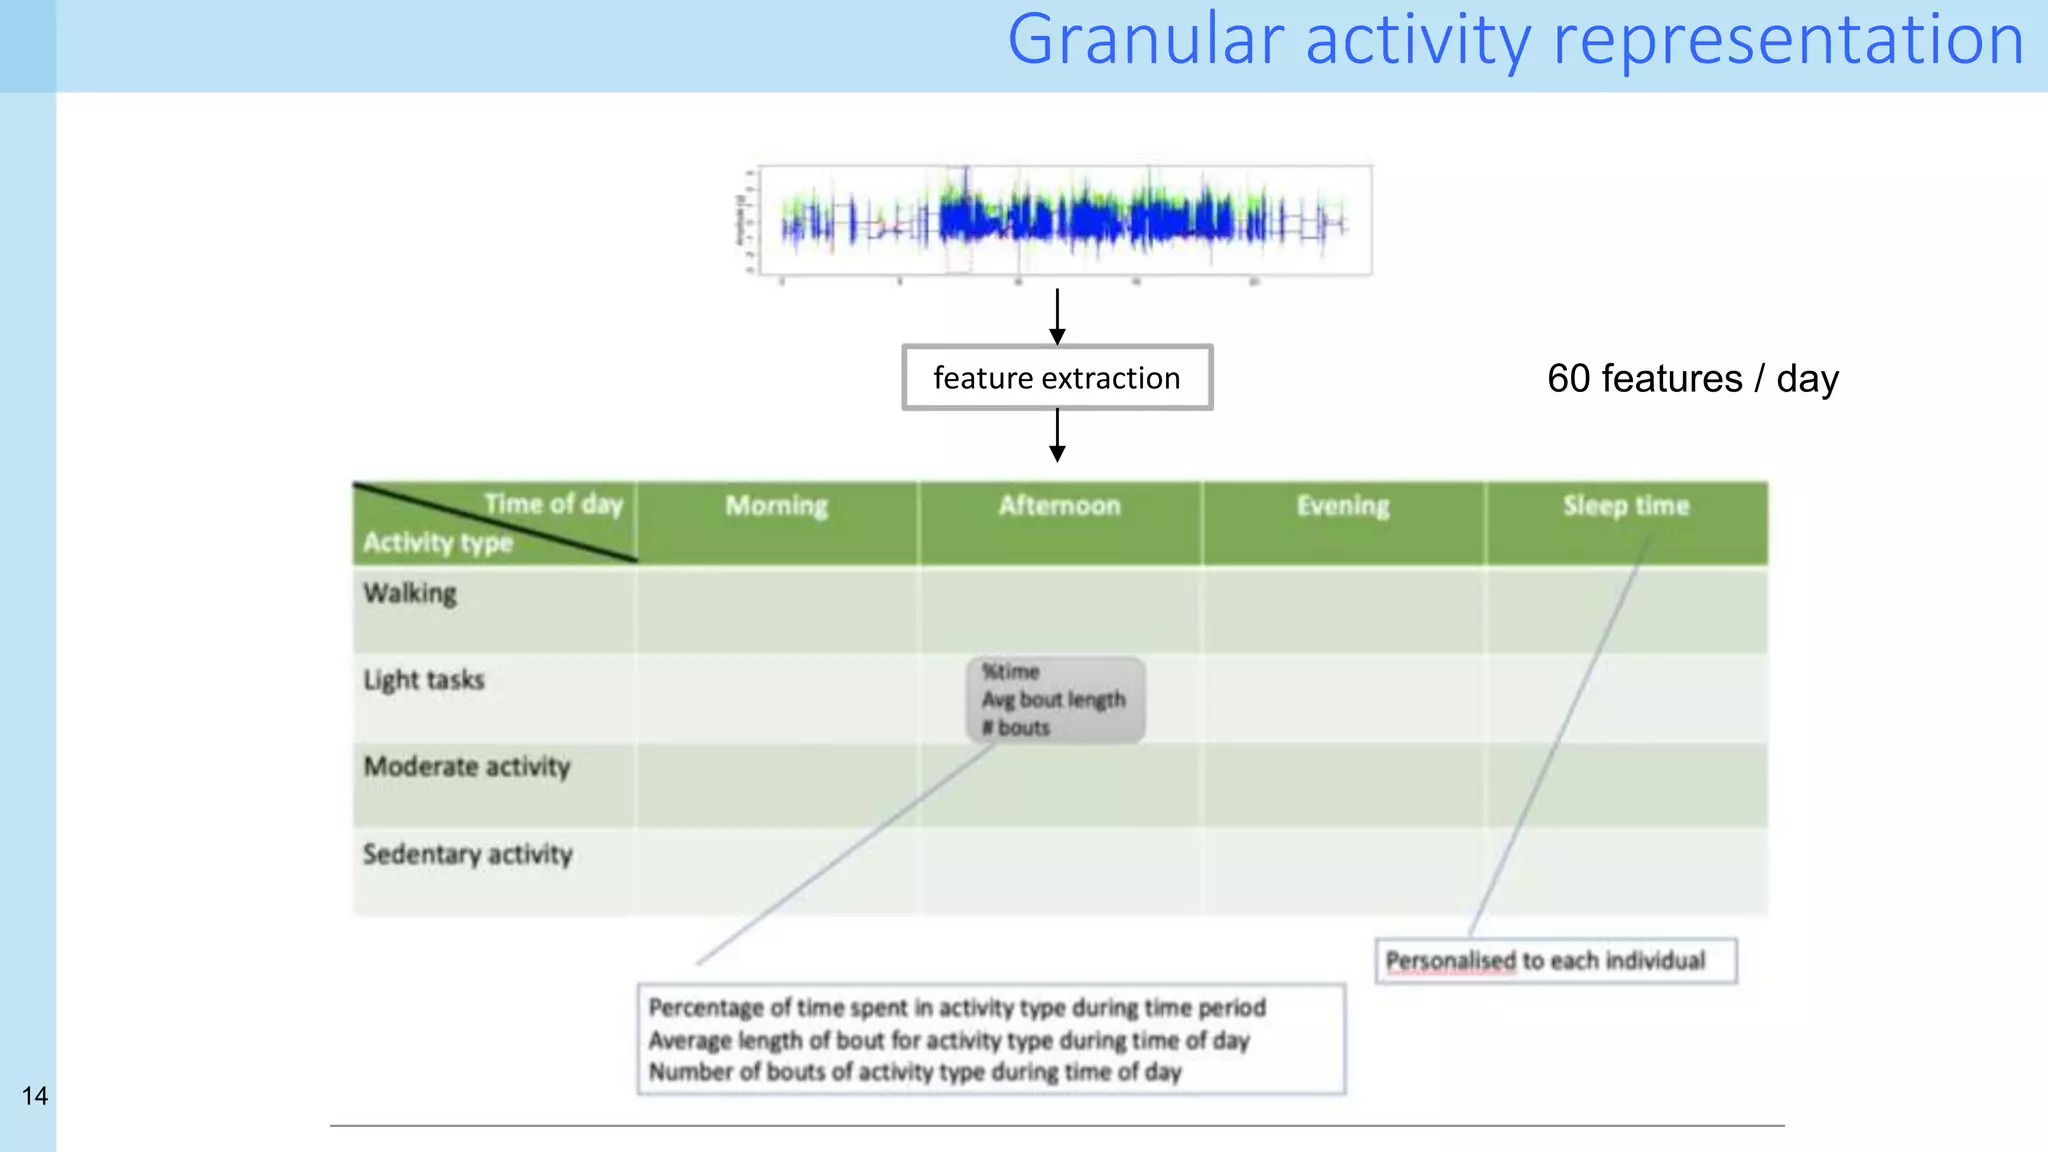
- physical activity
- glucose levels
- blood oxygen
levels
- …
Inexpensive scalable personalised self-monitoring](https://image.slidesharecdn.com/uiuc-ischool-march-21-210319221849/75/Data-Science-for-Health-Science-tales-from-a-challenging-front-line-and-how-to-cross-a-few-T-s-9-2048.jpg)
![46
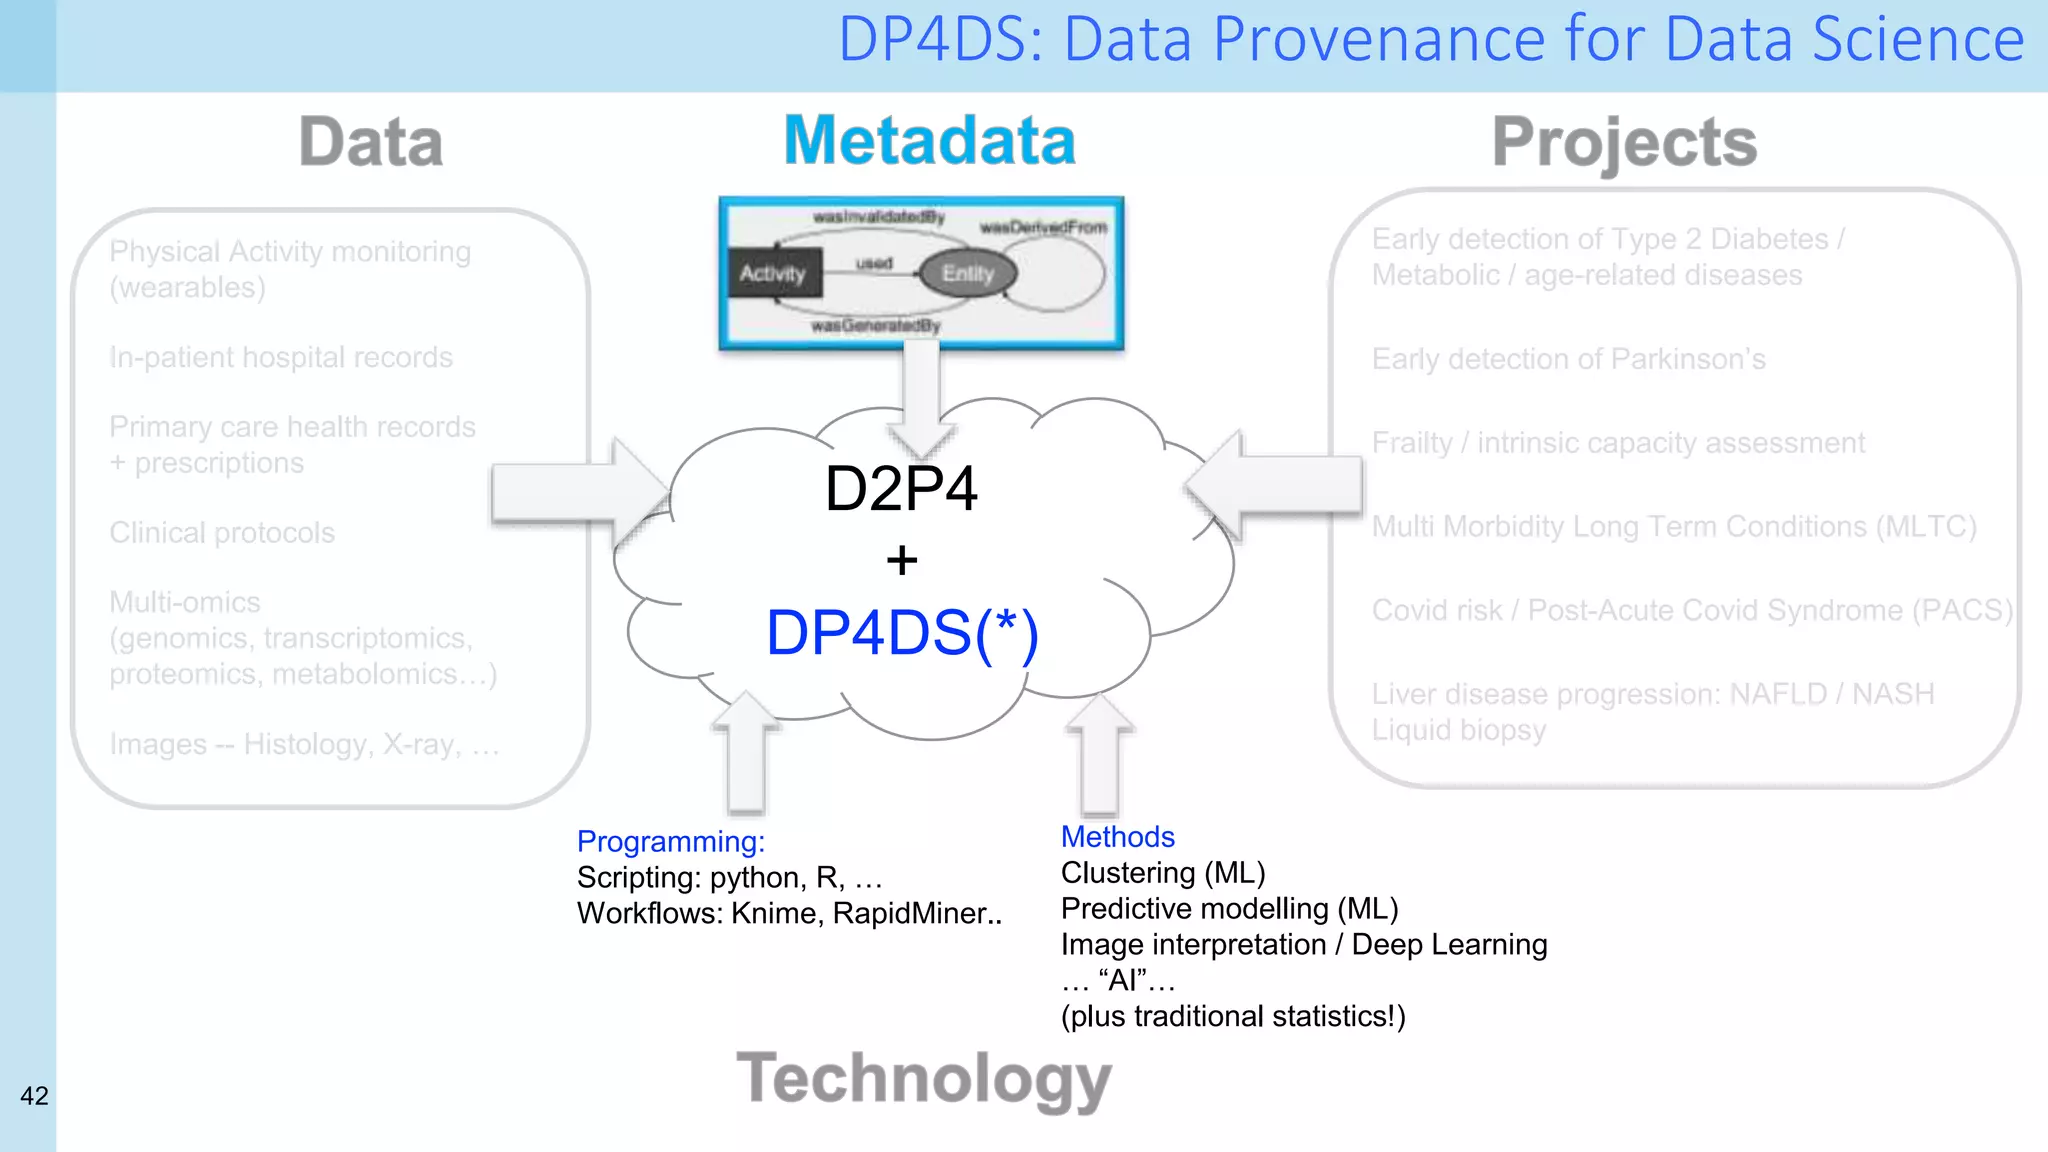
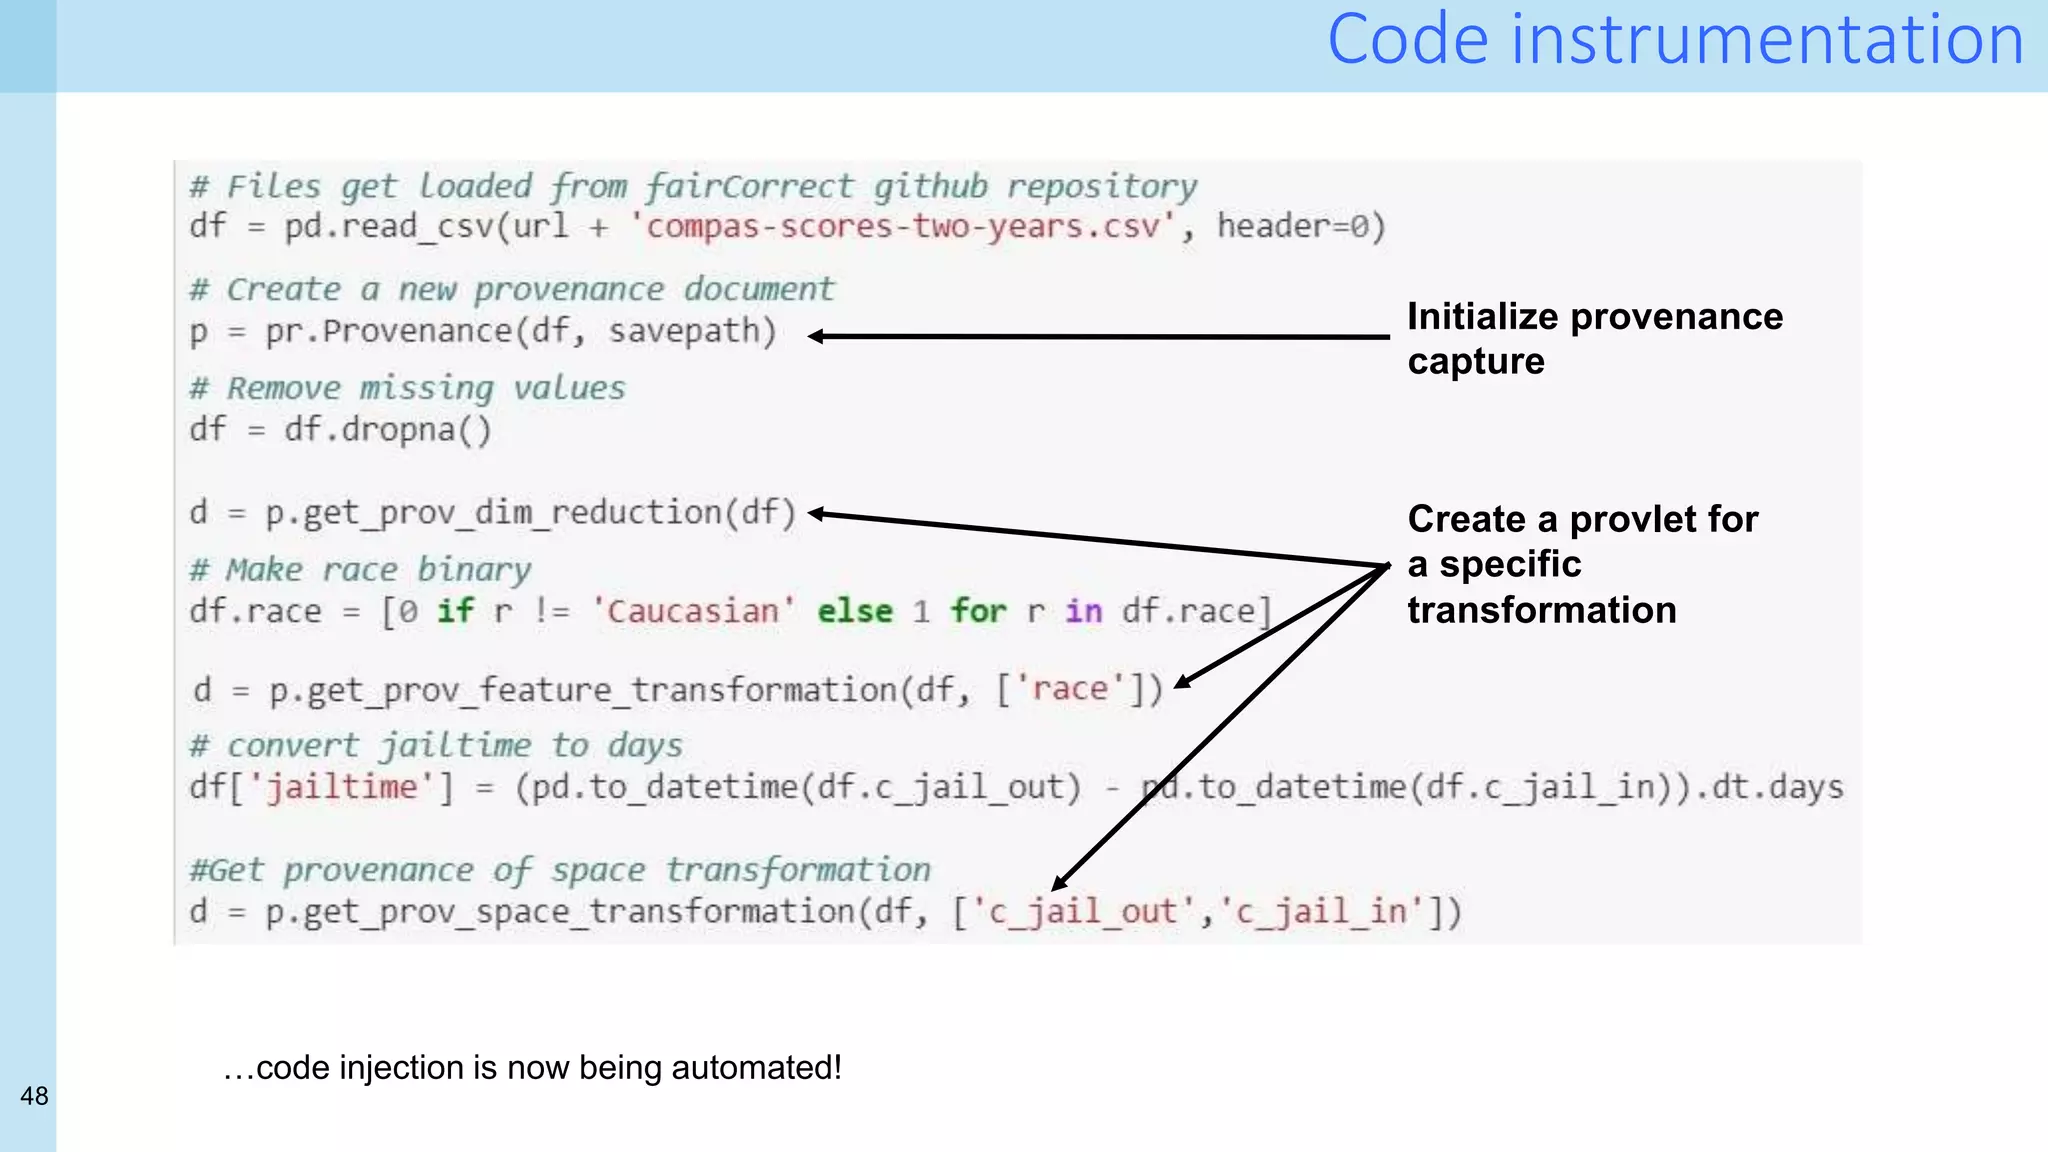
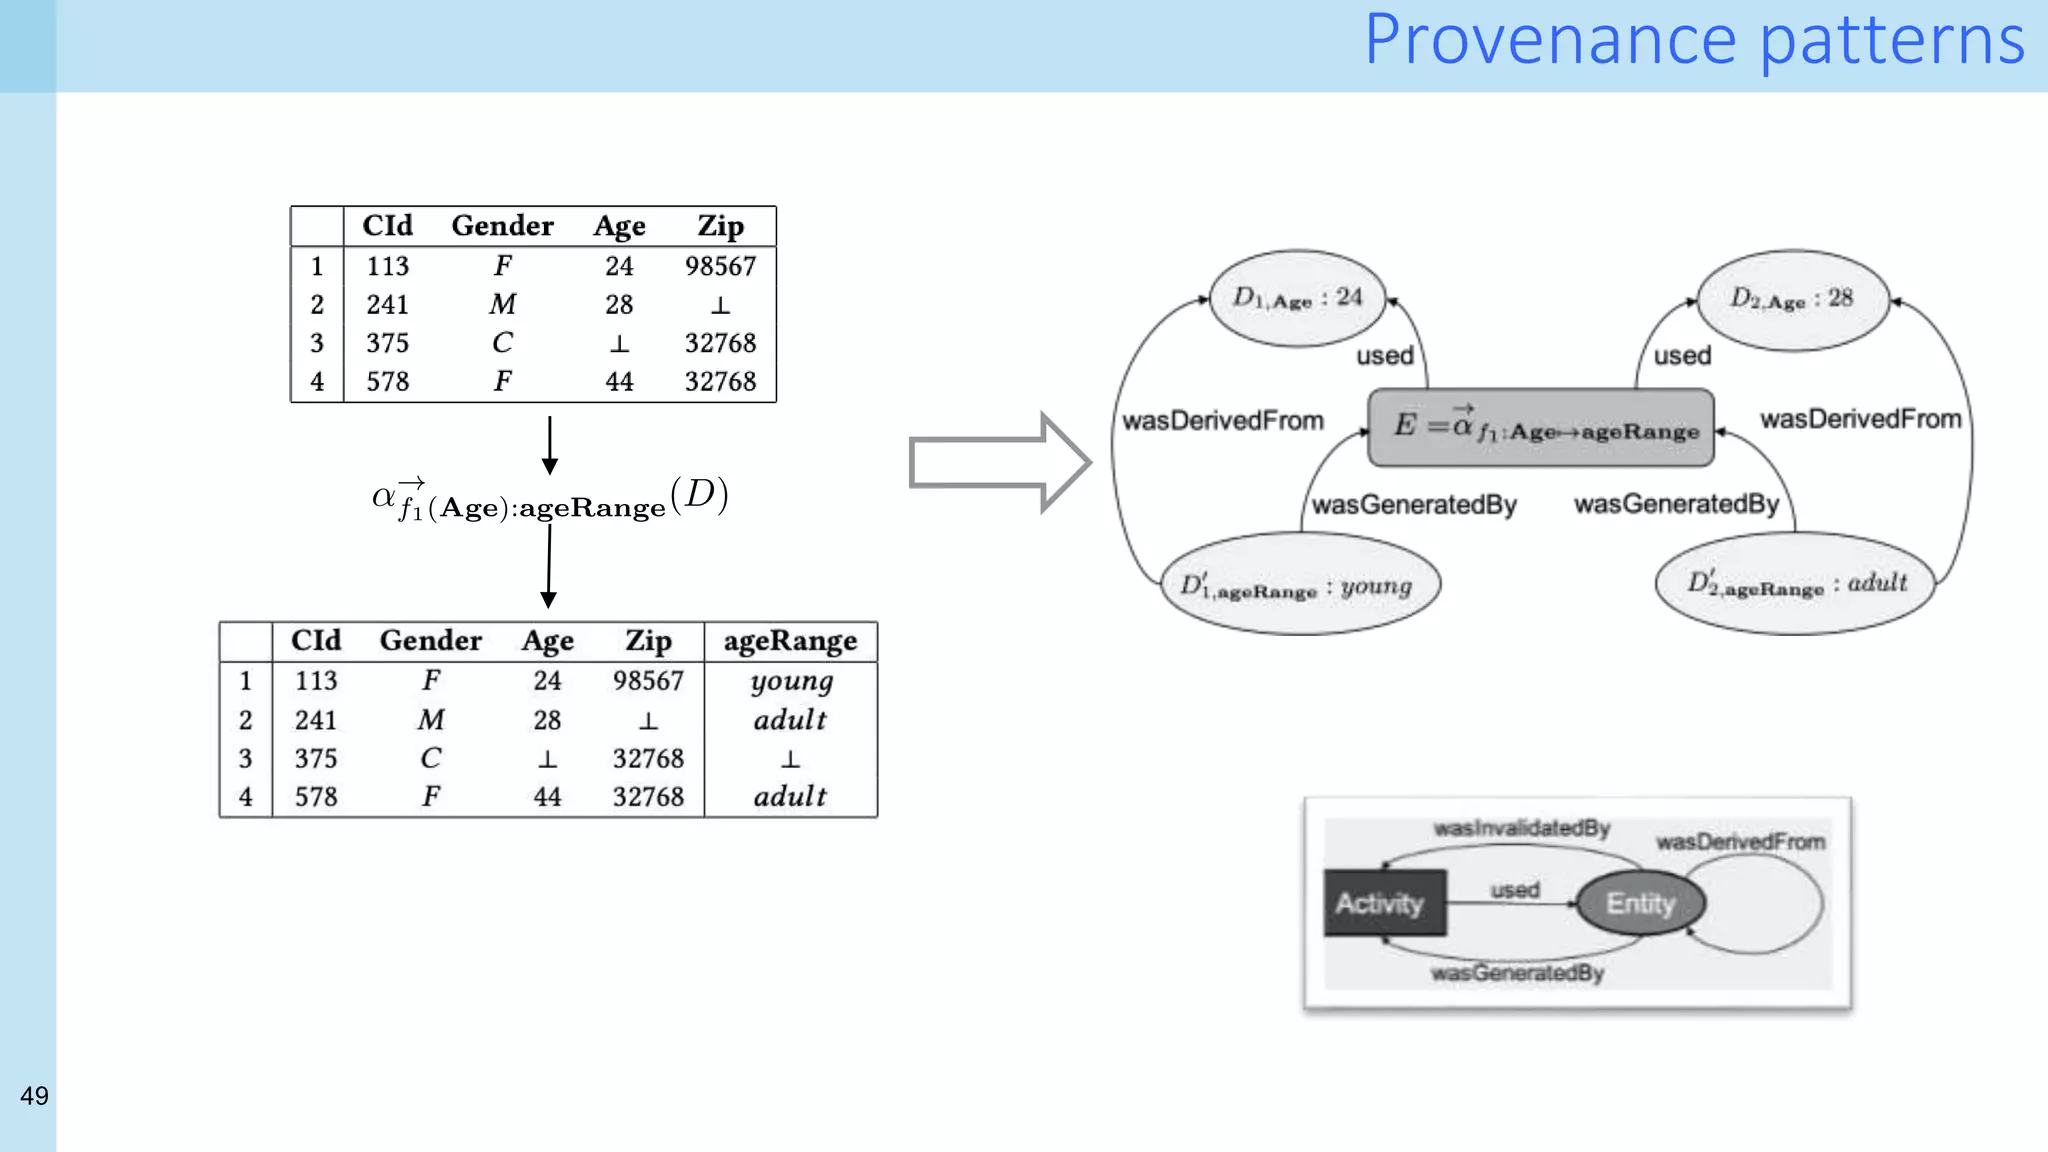
Recent early results
A small grassroots project… [1]
- Formalisation of provenance patterns for pipeline operators
- Systematic collection of fine-grained provenance from (nearly) arbitrary pipelines
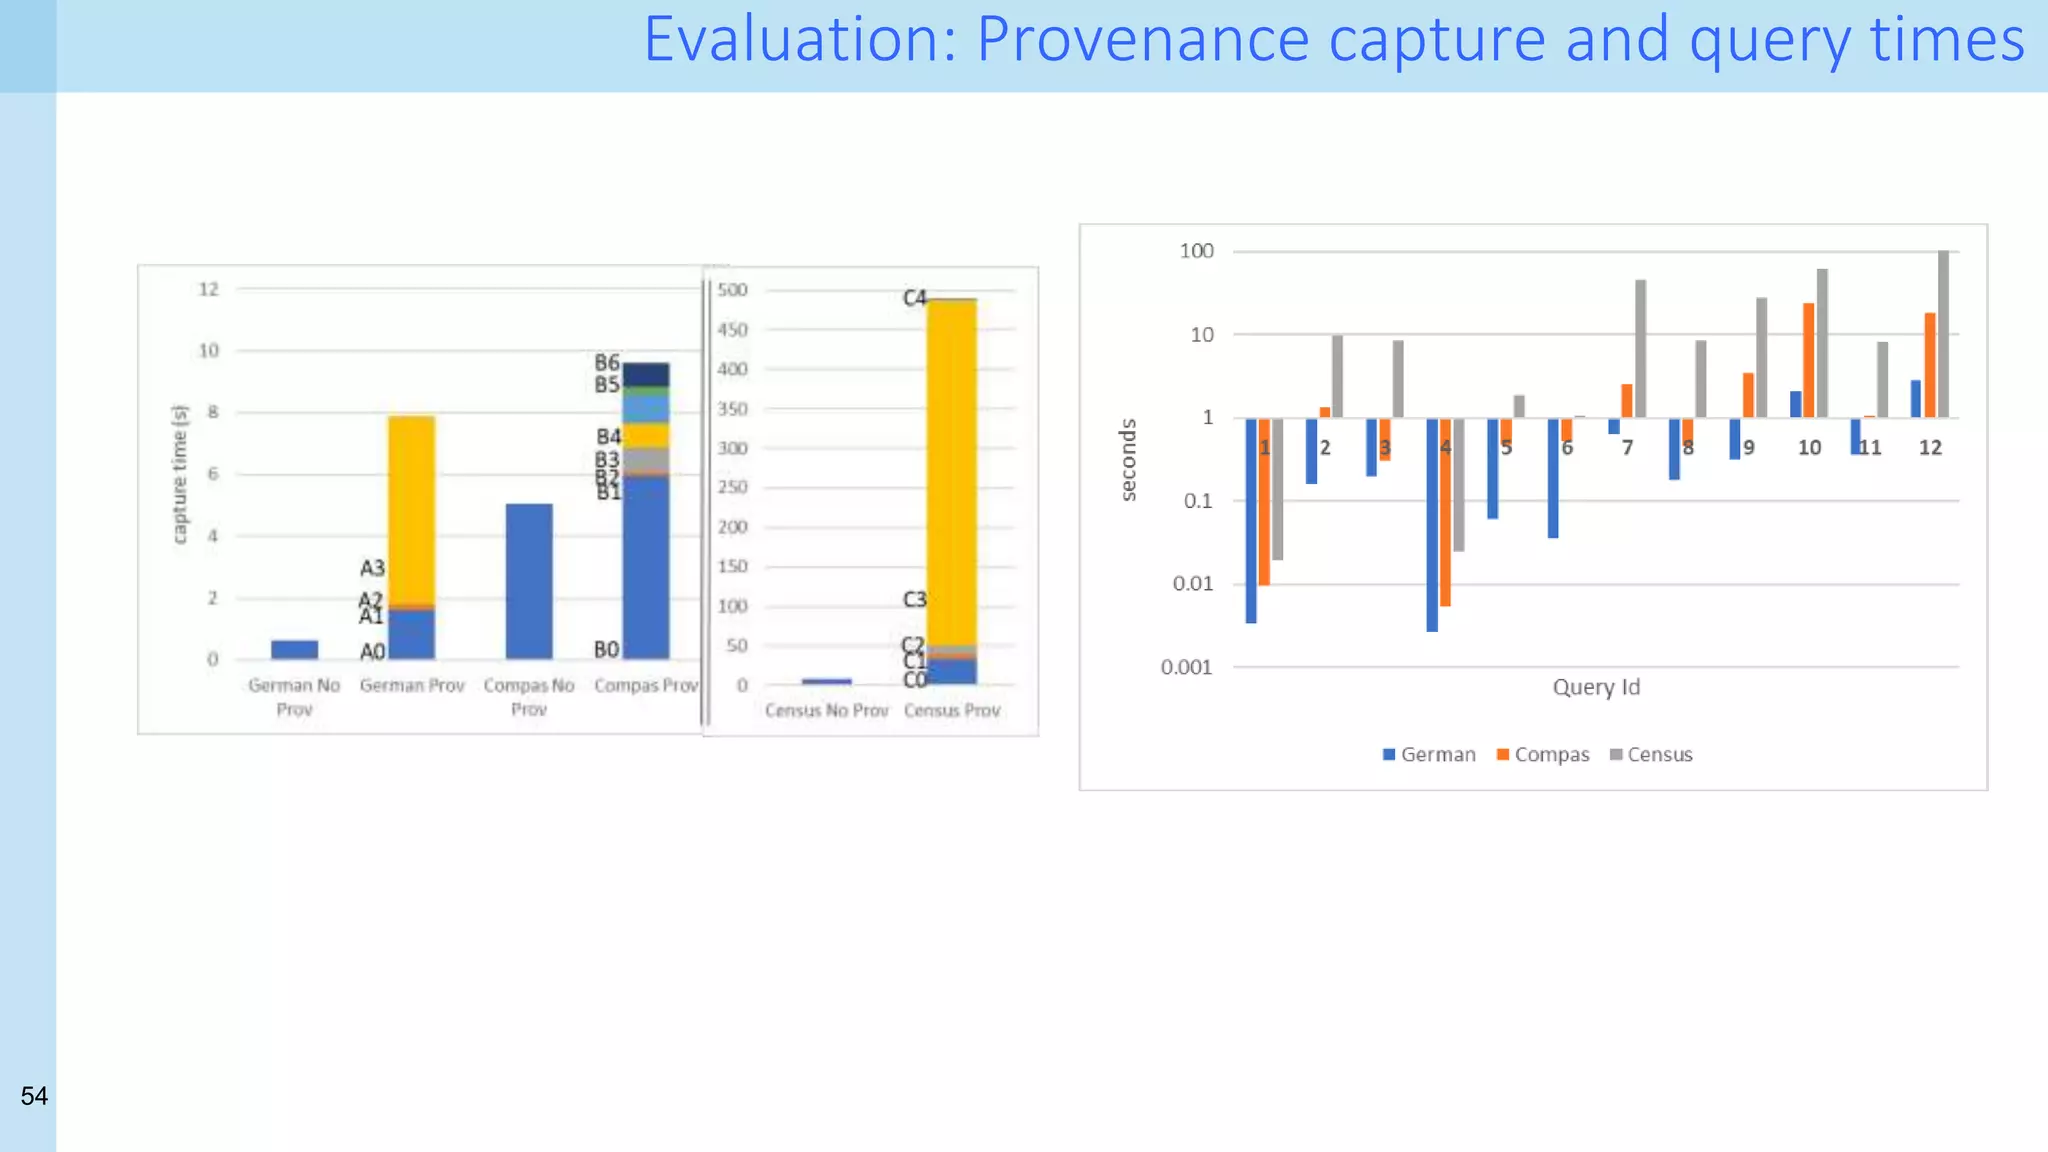
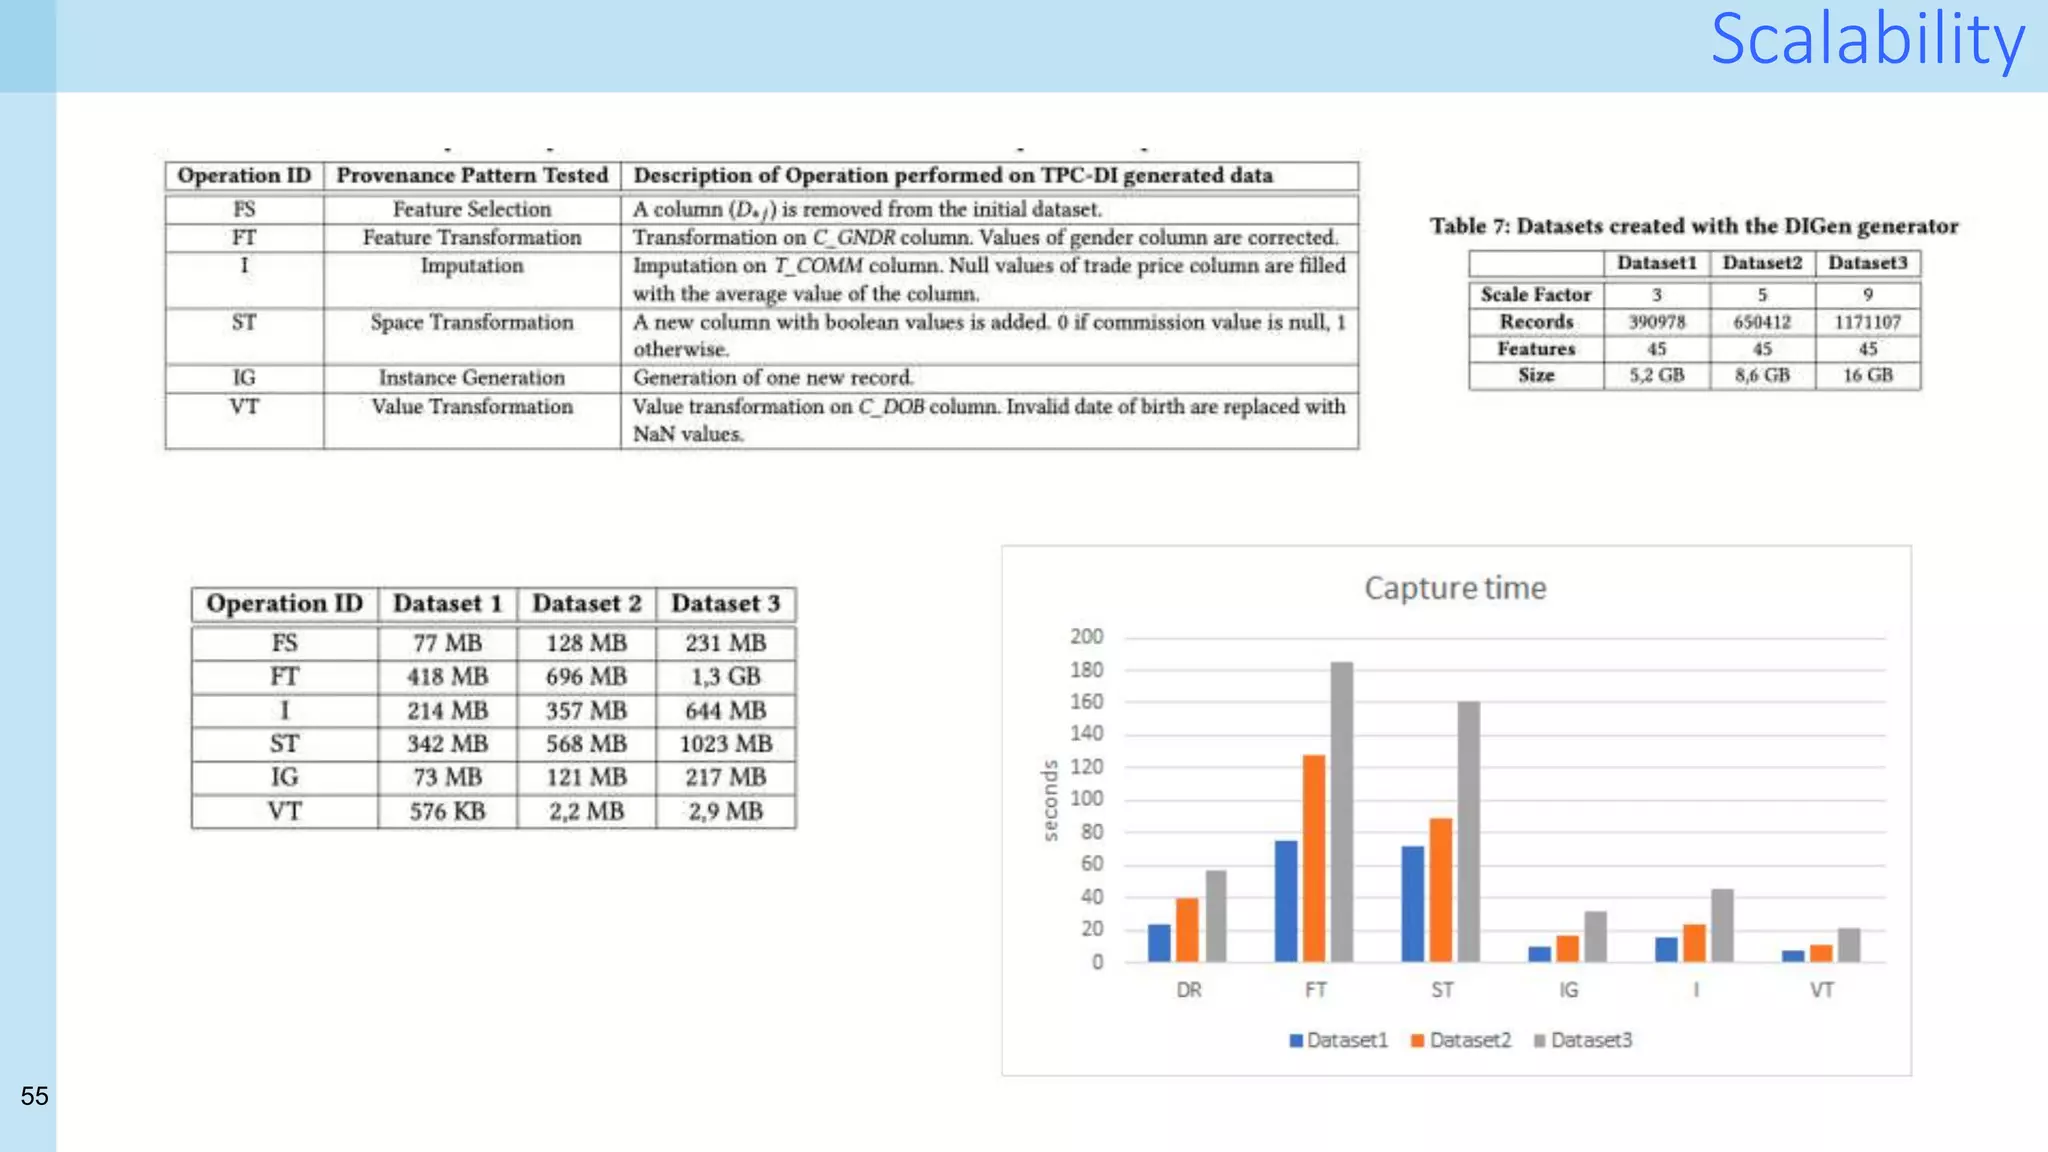
- Reality check:
- How much does it cost? provenance volume
- Does it help? queries against the provenance database
[1]. Capturing and Querying Fine-grained Provenance of Preprocessing Pipelines in Data Science. Chapman, A., Missier,
P., Simonelli, G., & Torlone, R. PVLDB, 14(4):507-520, January, 2021.](https://image.slidesharecdn.com/uiuc-ischool-march-21-210319221849/75/Data-Science-for-Health-Science-tales-from-a-challenging-front-line-and-how-to-cross-a-few-T-s-37-2048.jpg)

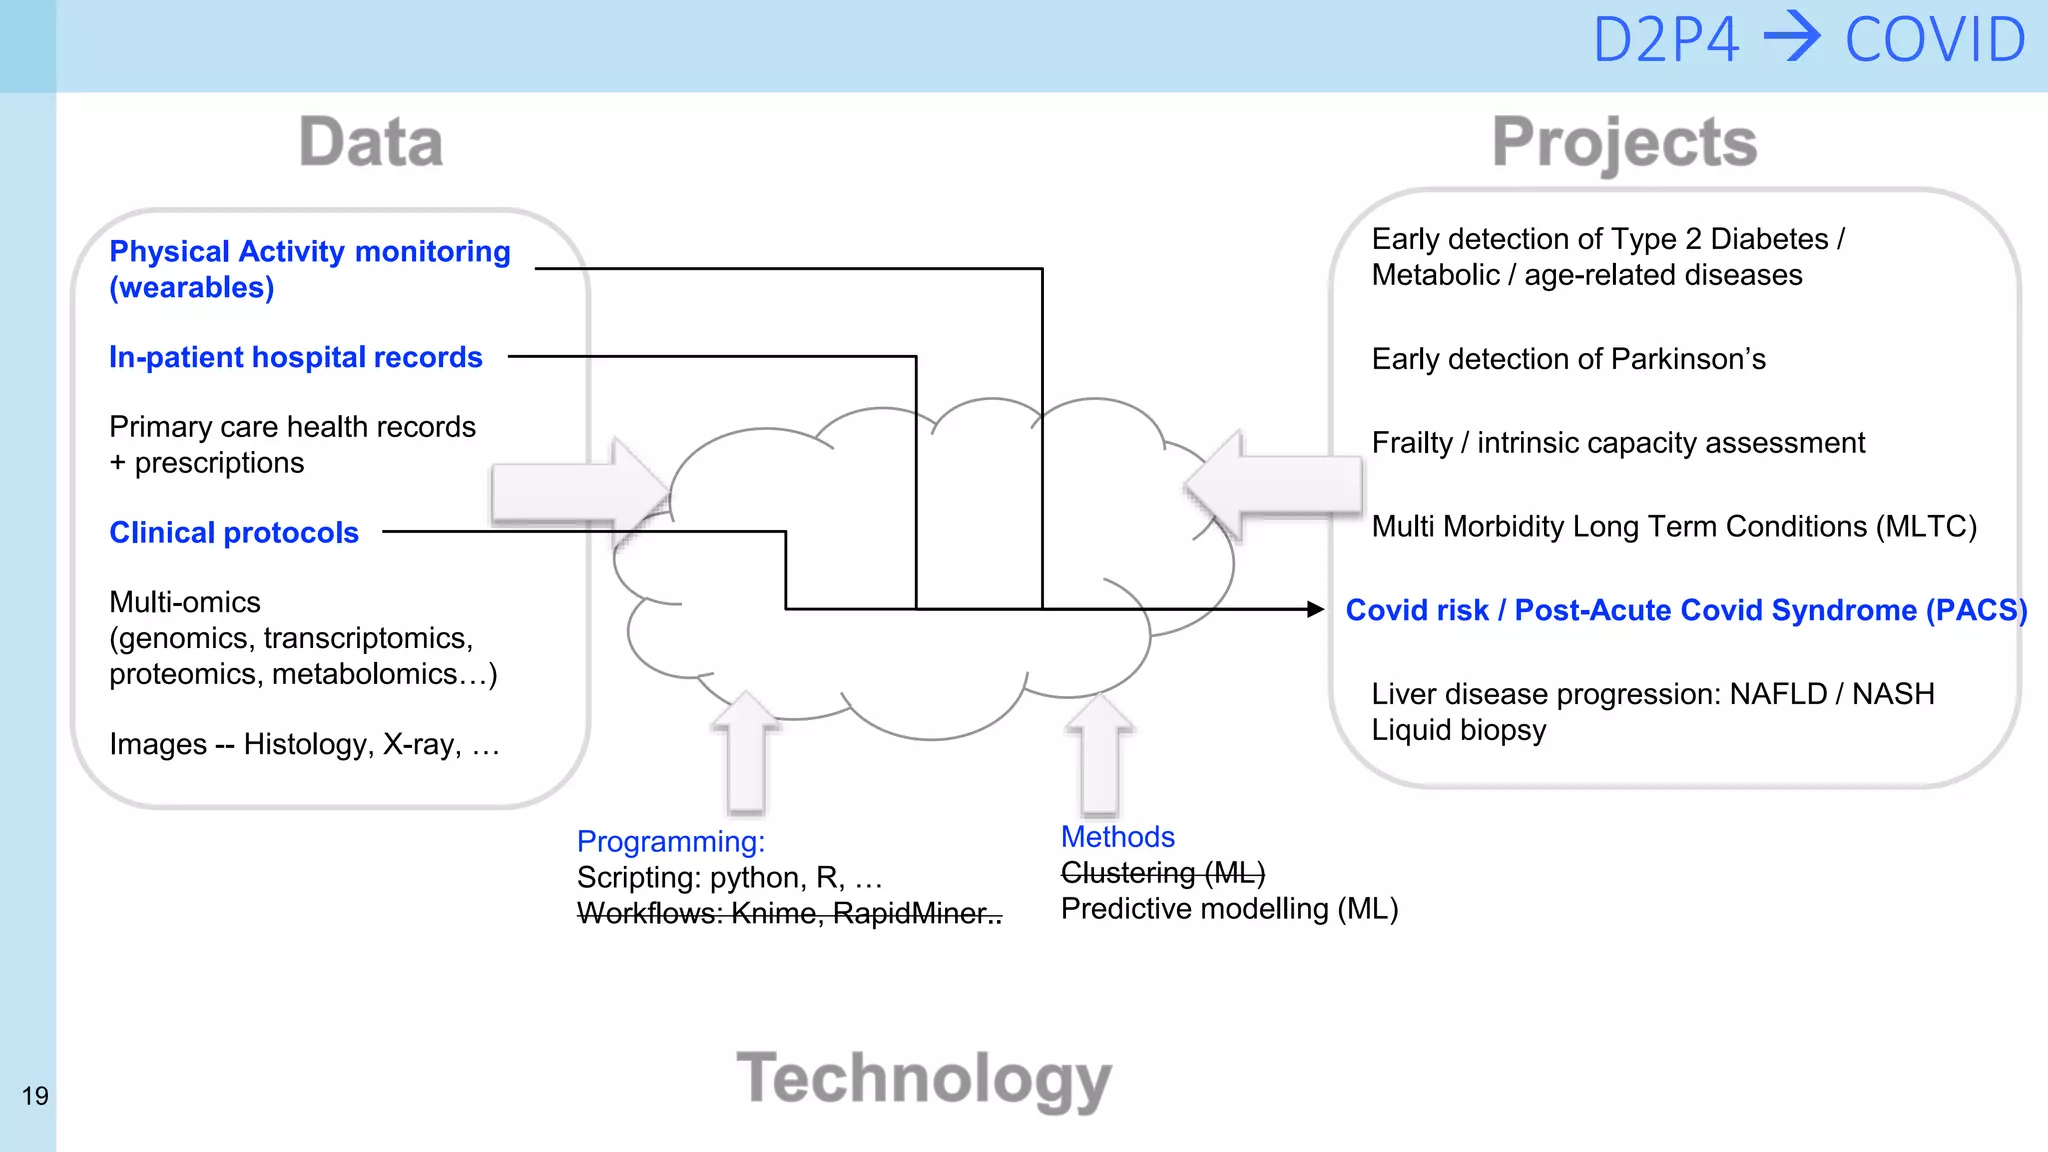
The document discusses the challenges and opportunities of applying data science and AI in health care, emphasizing the importance of data quality and ethical considerations. It explores projects aimed at personalized medicine and predictive analysis, particularly in areas like diabetes prediction, monitoring of chronic conditions, and COVID-19 management. A significant focus is on the integration of diverse health data sources and the use of machine learning techniques to improve clinical decision-making and patient outcomes.