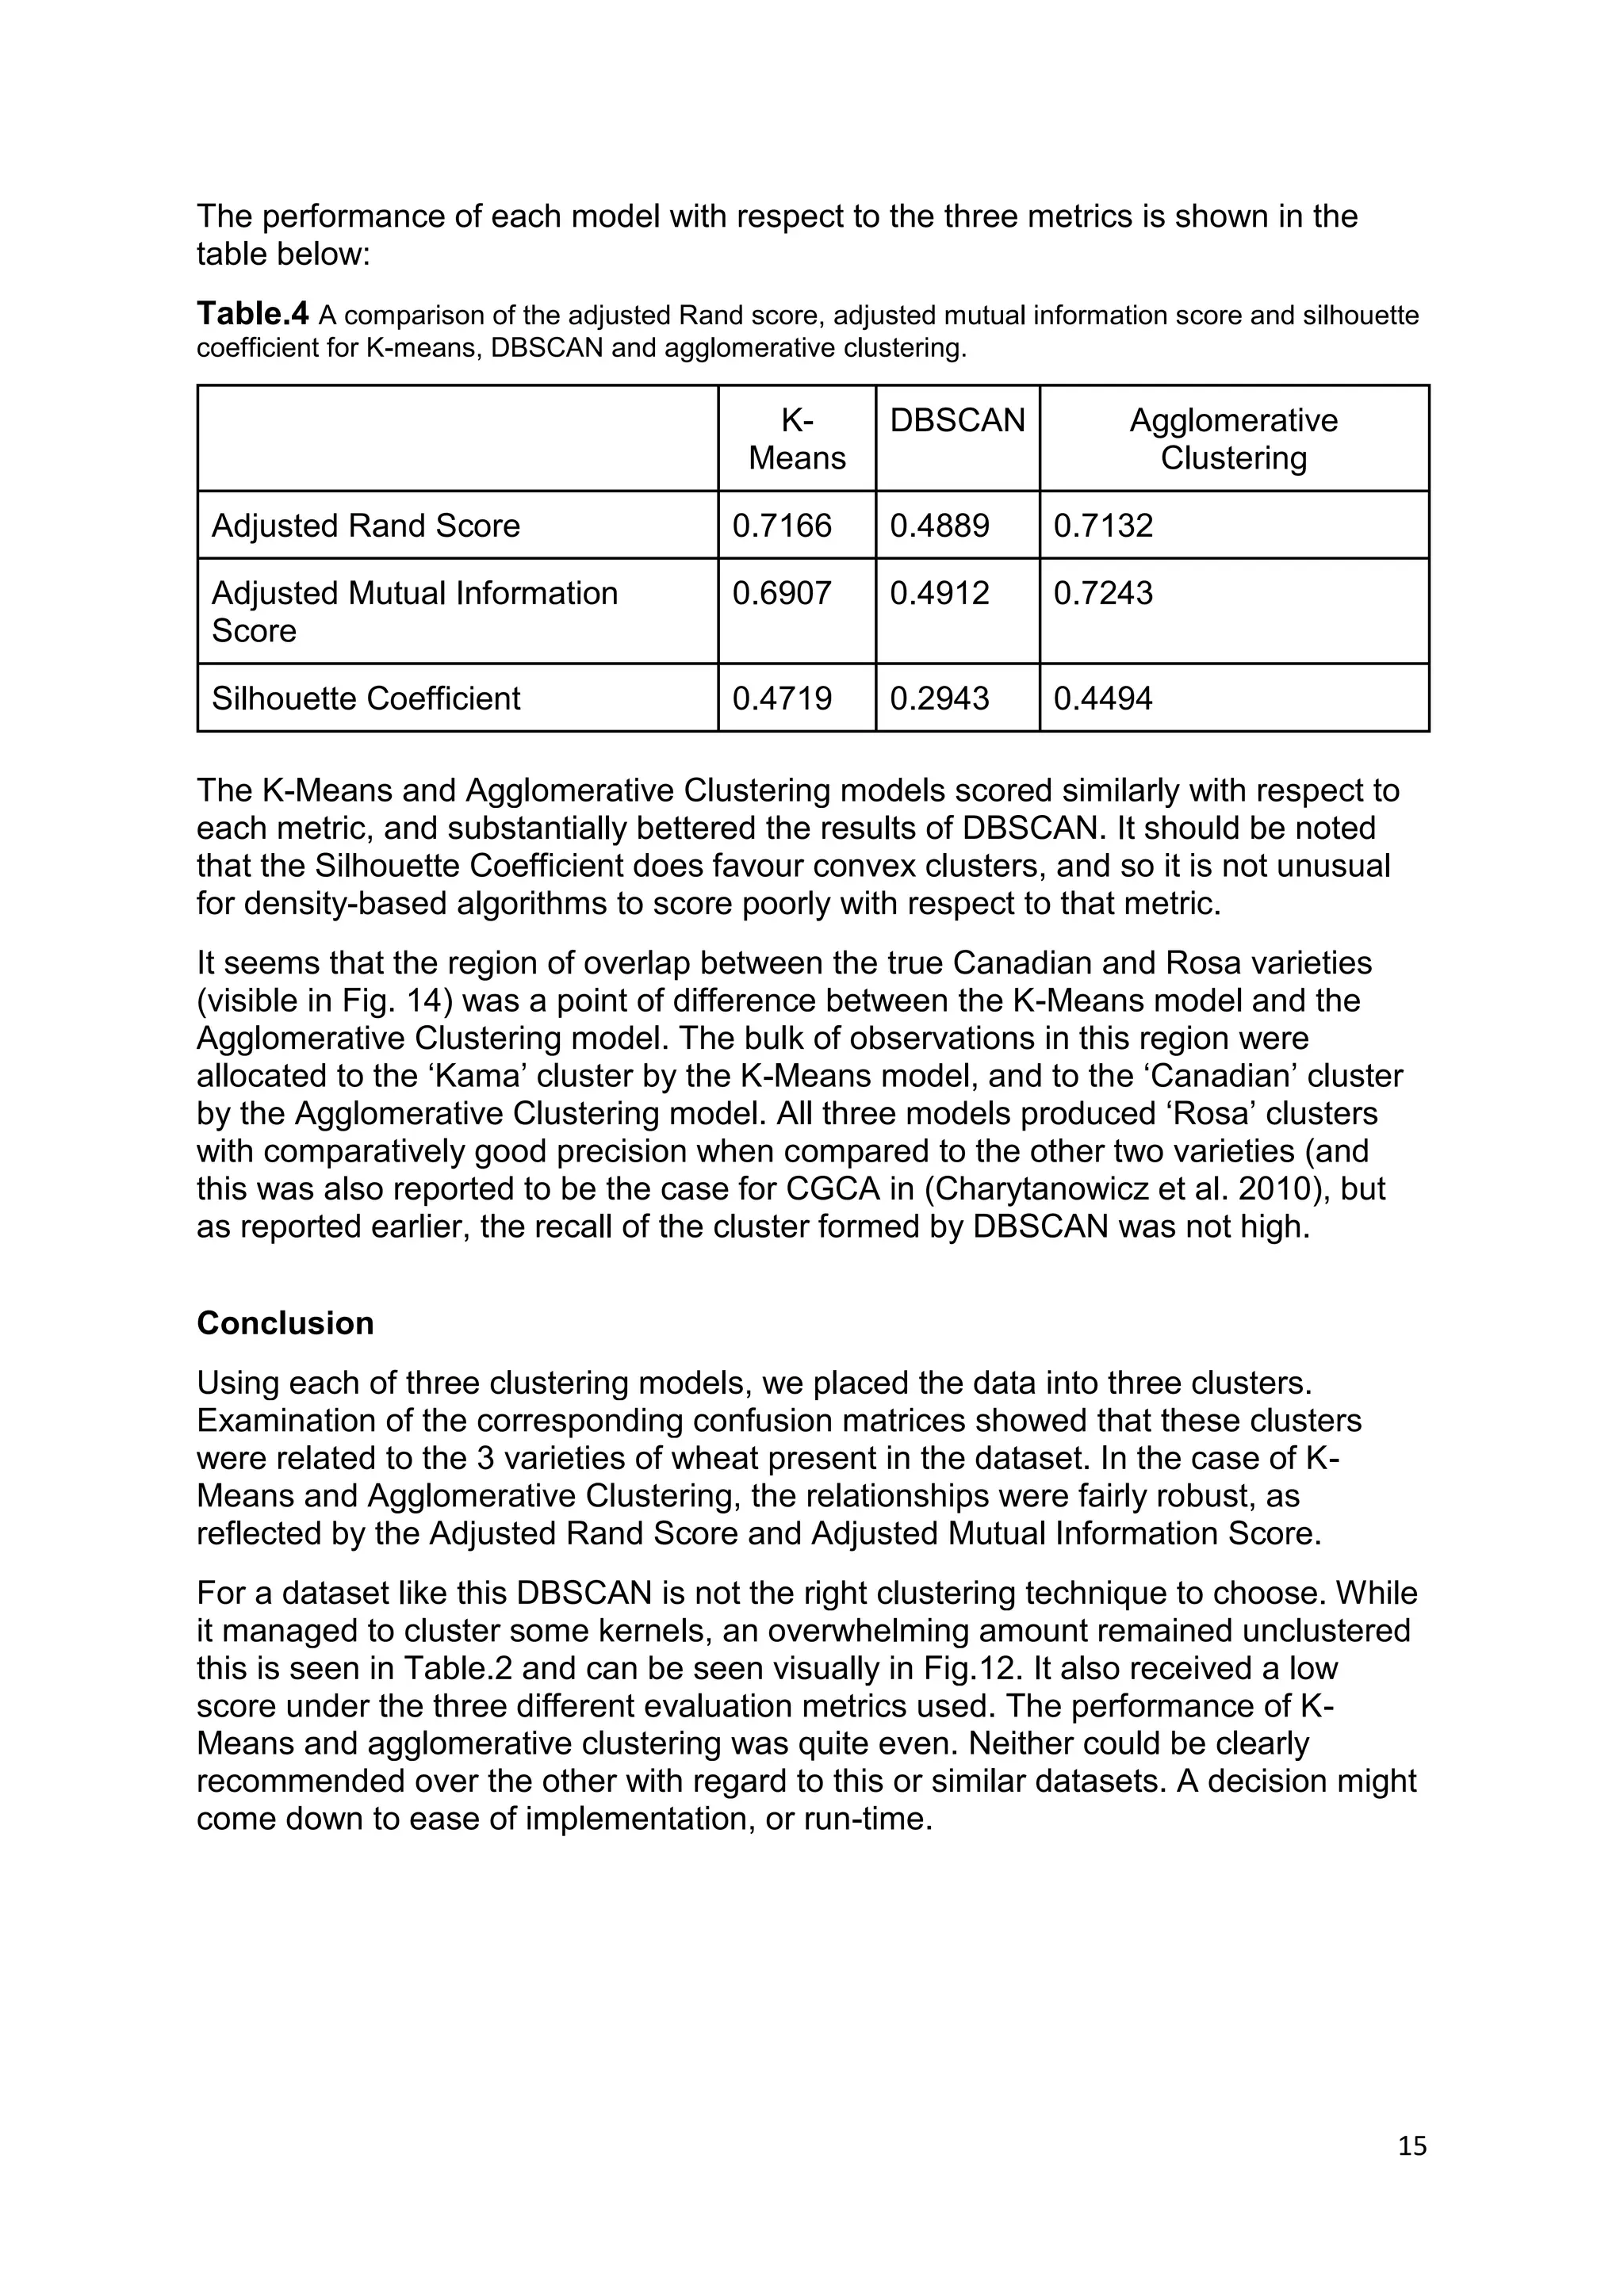
SlideShare a Scribd company logo
1
COSC 2670 — Practical Data Science
Assignment 2: Data Modelling and Presentation
Nicholas Davis(s3712731), Luke Daws (s3322003)
RMIT
nicholas.davis@student.rmit.edu.au, luke.daws@student.rmit.edu.au
Saturday 26th of May
Table of Contents
Abstract 2
Introduction 2
Methodology 2
Results 4
Discussion 13
Conclusion 15
References 16
2
Abstract
Our aim for this assignment was to use clustering methods to group together wheat
kernels by looking for similar characteristics in their physical properties. We expect
these groupings to reflect the different varieties of the wheat kernels in the dataset.
The dataset was taken from the UCI repository, and we applied 3 clustering
techniques to it: K-means, DBSCAN and Agglomerative Clustering. Along with a
confusion matrix, each model was evaluated with an Adjusted Rand Score, Adjusted
Mutual Information Score and a Silhouette Coefficient. We found that K-means and
Agglomerative Clustering performed quite well overall, with each slightly
outperforming the other under different metrics. DBSCAN didn’t perform as well. It
would be recommended when analysing this dataset or similar to use a clustering
method like K-means or agglomerative clustering over a density based clustering
algorithm like DBSCAN.
Introduction
This assignment is focused on data modelling, and specifically clustering. We will be
using three different clustering models with the goal of grouping the ‘seeds’ dataset
from the UCI Machine Learning Repository into meaningful clusters. The dataset
consists of the values of 7 attributes (area A, perimeter P, compactness C =
4*pi*A/P^2, length of kernel, width of kernel, asymmetry coefficient length of kernel
groove) for 70 kernels of wheat from each of 3 different varieties. (Kama, Rosa and
Canadian). This dataset was used in (Charytanowicz et al. 2010) to compare the
performance of a proposed new clustering model they name Complete Gradient
Clustering Algorithm to that of the K-Means algorithm.
We will repeat the analysis for K-Means and compare the results to those of the
DBSCAN and Agglomerative Clustering algorithms, as implemented by the Python
machine learning library scikit-learn. The variety of each wheat kernel is given in the
dataset, so we are able to compare each clustering result against these labels and
evaluate each model under the assumption that useful clusters will correspond to the
wheat varieties.
Methodology
Given that we retrieved our data from the UCI repository, we did not anticipate
needing to spend too much time with data-cleaning. There were some extra tab
characters in the supplied text file, so we did check to make sure that they did not
adversely affect data-loading. We also checked to make sure each attribute had
been assigned the correct data type, which was float64 in each instance.
Before beginning the data modelling phase, we carried out an exploration of the
data. The first step was to separate the data itself from the target values. Target
values were stored in a separate DataFrame and given more meaningful names. We
made histograms of all the attributes (Fig.1 - 7) to provide some visualisation, then
all the attributes were compared against each other using a scatter matrix (fig.8).
Since there were only 7 attributes, with no missing or obviously incorrect data, we
decided to train our models on all the attributes.
3
K-means
The K-means model requires as input the value of K, which corresponds to the
desired number of clusters. Clearly, we expect that K=3 will provide the best results,
but its choice can also be justified without reference to the target values. When we
plotted the value of the inertia for each set of results against K, we saw a clear elbow
in the graph at K=3. (The inertia is an inbuilt attribute of the K-Means model on sci-kit
learn that records a sum of the squared distances of each sample to its closest
cluster center.)
Agglomerative Clustering
The Agglomerative Clustering model also requires as input the desired number of
clusters, however it works in a very different way. Each observation begins in its own
cluster, and these clusters are recursively merged based on distance. The
specification of the desired number of clusters is therefore necessary to halt the
algorithm before all clusters are merged. We selected the value 3 based on its
validity for the K-means model.
DBSCAN
DBSCAN is an entirely different type of model, being density based. Two parameters
are required, MinPts and eps, but the number of clusters to be found is not
predetermined. Our eventual choice of parameters was MinPts = 11 and Eps = 0.9.
4
Results
Fig.1 Histogram showing the Area of wheat seeds and their frequency
Fig.2 Histogram showing the perimeter of wheat seeds and their frequency
5
Fig.3 Histogram showing the compactness of wheat seeds and their frequency
Fig.4 Histogram showing the length of wheat seeds and their frequency
6
Fig.5 Histogram showing the width of wheat seeds and their frequency
Fig.6 Histogram showing the Asymmetry coefficient of wheat seeds and their frequency
7
Fig.7 Histogram showing the Length of kernel groove of wheat seeds and their frequency
8
Fig.8 Scatter matrix comparing all attributes against each other in a scatter plot also displaying the
above histograms (Fig.1-7).
9
KMeans
Fig.9 Elbow Graph of K vs inertia indicating the curve is slowing around K = 3
Table.1 Clustering results of the K-means algorithm
Clusters for K-Means
0 1 2
target Canadian 0 68 2
Kama 1 9 60
Rosa 60 0 10
Adjusted Rand Score: 0.7166
10
Fig.10 Scatterplot of the K-means model showing 3 clusters
For the K-Means model cluster 0 is clearly associated with the Rosa variety, and
contains only 1 grain from a different variety. However, 10 grains of the Rosa variety
ended in cluster 2, which is otherwise strongly associated to the Kama variety. 9
grains of the Kama variety ended in cluster 1, which otherwise contained nearly all
grains of the Canadian variety.
DBSCAN
Fig.11 14-distance graph
11
Table.2 Clustering results of the DBSCAN algorithm
Clusters for DBSCAN
0 1 2 unclustered
target Canadian 0 58 0 12
Kama 47 5 0 18
Rosa 2 0 37 31
Adjusted Rand Score: 0.4889
Fig.12 Scatterplot of the DBSCAN model and the clusters that it had predicted.
In the DBSCAN model, Cluster 0 could be considered the Kama variety cluster, but it
contains only 47 grains of that type. Cluster 1 captured 58 grains of the Canadian
variety. Cluster 2 contained exclusively grains of the Rosa variety, so precision was
perfect. However, only just over half the Rosa grains were placed in that cluster.
Overall, 61 grains from the total of 210 were not placed in any cluster.
12
Agglomerative Clustering
Table.3 Clustering results of the Agglomerative clustering algorithm
Clusters for Agglomerative Clustering
0 1 2
target Canadian 70 0 0
Kama 16 0 54
Rosa 0 63 7
Adjusted Rand Score: 0.7132
Fig.13 Scatterplot of the Agglomerative Clustering model showing it’s associated clustering.
The agglomerative clustering model created a cluster containing exclusively grains of
the Rosa variety, but also misplaced a significant number in the cluster associated
with the Kama variety. All Canadian variety grains were place in cluster 0, however
this model placed 16 Kama grains in that cluster.
13
Fig.14 Scatterplot showing the true wheat varieties.
Yellow = Canadian Purple = Kama Green = Rosa
Discussion
For each model we obtained a ‘confusion matrix’ (Table 1-3) with rows
corresponding to the actual wheat varieties and columns recording which cluster the
observations were assigned to by the model. We also present a scatter plot (Fig.10,
12, 13) to help with visualisation of the result for each model. Following
(Charytanowicz et al. 2010), we projected the data onto the two greatest principal
components to generate these plots, rather than choosing any two of the attributes
for display. Interestingly, our data plots differently to that in Fig. 3 of Charytanowicz
et al. This suggests that the implementation of Principal Component Analysis in
scikit-learn differs from their implementation in some way, but they did not provide
details to investigate.
The K-means model was able to perform fairly well the precision for cluster 0 was
very good exclusively clustering the Rosa variety but the recall placed 10 in cluster 2.
The precision for cluster 2 wasn’t so great, although it can be considered the Kama
cluster it managed to assign 12 kernels of the other varieties to that cluster.
The DBSCAN model had trouble forming clusters on this data set, regardless of the
parameters chosen. For MinPts, we initially followed the suggestion in (Sander et al.
1998) of 2*(number of attributes) = 14. For a given value of MinPts, a good value of
Eps can theoretically be obtained by looking for an elbow in the corresponding k-
distance graph (Fig.11) (Ester et el. 1996). Using these parameters, DBSCAN only
formed a single cluster. Varying eps still did not yield good results as measure by the
adjusted rand score.
We also tried the default value MinPts=4 suggested originally by the authors in
(Ester et al. 1996), but were still unhappy with the results. Eventually, we conducted
a grid search of all values for MinPts from 4 to 14, and all values of eps from 0.3 to
14
2.0. The values that performed best with respect to both the adjusted rand score
metric and the adjusted mutual information metric were MinPts = 11 , eps = 0.9.
Even with this choice of parameters, the DBSCAN model scored much lower than
the other two models we evaluated. The clusters formed were quite precise, but a
large number of grains remained unclustered. Increasing eps in the hope of
capturing more points led to a merge of all clusters rather than simply making the
existing ones larger.
Our third model (Agglomerative Clustering) performed on par with the K-means
model. The recall for the Canadian variety was quite good clustering all 70 of them in
cluster 0 although it’s precision was not as good as it also clustered 16 of the Kama
variety with it. The precision of cluster 1 was good, only clustering the Rosa variety.
The adjusted rand score showed that the model does perform just as well as K-
means having only a difference of .0034.
Aside from creating a confusion matrix and exploring precision and recall, there are a
number of other metrics available to evaluate the performance of clustering models.
Many suffer from the drawback that it is necessary to know the ground truth classes,
but this does not affect us, as we know the variety of each grain of wheat. This
enabled us to compare our models using the Adjusted Rand Score and the Adjusted
Mutual Information Score. We also calculated the Silhouette Coefficient, which is an
internal evaluation for clustering models (meaning that it does not require the ground
truth classes.)
The Rand score is a measure of similarity for two partitions of a set. It gives the
proportion of all pairs of elements that are either in the same subset in both
partitions, or in different subsets in both. Details of this measure appear in (Hubert &
Arabie 1985)
The Mutual Information Score is calculated using the concept of information entropy.
In both cases, the adjusted score is a correction for chance. The Adjusted Rand
Score ranges from -1 to 1, while the Adjusted Mutual Information Score ranges from
0 to 1. In both case, a value of 1 indicates perfect agreement between the model and
the ground truth classes.
Finally, we evaluated each model using the Silhouette Coefficient. The Silhouette
Coefficient is an internal evaluation which seeks to quantify how well-defined the
clusters are without reference to ground class truths (which are normally
unknown/non-existent when using clustering models.)
15
The performance of each model with respect to the three metrics is shown in the
table below:
Table.4 A comparison of the adjusted Rand score, adjusted mutual information score and silhouette
coefficient for K-means, DBSCAN and agglomerative clustering.
K-
Means
DBSCAN Agglomerative
Clustering
Adjusted Rand Score 0.7166 0.4889 0.7132
Adjusted Mutual Information
Score
0.6907 0.4912 0.7243
Silhouette Coefficient 0.4719 0.2943 0.4494
The K-Means and Agglomerative Clustering models scored similarly with respect to
each metric, and substantially bettered the results of DBSCAN. It should be noted
that the Silhouette Coefficient does favour convex clusters, and so it is not unusual
for density-based algorithms to score poorly with respect to that metric.
It seems that the region of overlap between the true Canadian and Rosa varieties
(visible in Fig. 14) was a point of difference between the K-Means model and the
Agglomerative Clustering model. The bulk of observations in this region were
allocated to the ‘Kama’ cluster by the K-Means model, and to the ‘Canadian’ cluster
by the Agglomerative Clustering model. All three models produced ‘Rosa’ clusters
with comparatively good precision when compared to the other two varieties (and
this was also reported to be the case for CGCA in (Charytanowicz et al. 2010), but
as reported earlier, the recall of the cluster formed by DBSCAN was not high.
Conclusion
Using each of three clustering models, we placed the data into three clusters.
Examination of the corresponding confusion matrices showed that these clusters
were related to the 3 varieties of wheat present in the dataset. In the case of K-
Means and Agglomerative Clustering, the relationships were fairly robust, as
reflected by the Adjusted Rand Score and Adjusted Mutual Information Score.
For a dataset like this DBSCAN is not the right clustering technique to choose. While
it managed to cluster some kernels, an overwhelming amount remained unclustered
this is seen in Table.2 and can be seen visually in Fig.12. It also received a low
score under the three different evaluation metrics used. The performance of K-
Means and agglomerative clustering was quite even. Neither could be clearly
recommended over the other with regard to this or similar datasets. A decision might
come down to ease of implementation, or run-time.
16
References
M. Charytanowicz, J. Niewczas, P. Kulczycki, P.A. Kowalski, S. Lukasik, S. Zak (2010), “A Complete
Gradient Clustering Algorithm for Features Analysis of X-ray Images”.: Information Technologies in
Biomedicine, Ewa Pietka, Jacek Kawa (eds.), Springer-Verlag, Berlin-Heidelberg, 2010, pp. 15-24.
Ester, Martin; Kriegel, Hans-Peter; Sander, Jörg; Xu, Xiaowei (1996). Simoudis, Evangelos; Han,
Jiawei; Fayyad, Usama M., eds. “A density-based algorithm for discovering clusters in large spatial
databases with noise”. Proceedings of the Second International Conference on Knowledge Discovery
and Data Mining (KDD-96). AAAI Press. pp. 226–231.
Hubert, Lawrence and Arabie, Phipps (1985). "Comparing partitions". Journal of Classification. 2 (1): pp.
193–218.
Sander, Jörg; Ester, Martin; Kriegel, Hans-Peter; Xu, Xiaowei (1998). "Density-Based Clustering in
Spatial Databases: The Algorithm GDBSCAN and Its Applications". Data Mining and Knowledge
Discovery. Berlin: Springer-Verlag. 2 (2): 169–194.
Schubert, Erich; Sander, Jörg; Ester, Martin; Kriegel, Hans Peter; Xu, Xiaowei (July 2017). "DBSCAN
Revisited, Revisited: Why and How You Should (Still) Use DBSCAN". ACM Trans. Database Syst. 42
(3): 19:1–19:21.

More Related Content

What's hot

Intro to MATLAB and K-mean algorithm
Intro to MATLAB and K-mean algorithmIntro to MATLAB and K-mean algorithm
Intro to MATLAB and K-mean algorithm
khalid Shah
 
Low Power Adaptive FIR Filter Based on Distributed Arithmetic
Low Power Adaptive FIR Filter Based on Distributed ArithmeticLow Power Adaptive FIR Filter Based on Distributed Arithmetic
Low Power Adaptive FIR Filter Based on Distributed Arithmetic
IJERA Editor
 
Clustering
ClusteringClustering
Clustering
Md. Hasnat Shoheb
 
Sequential Extraction of Local ICA Structures
Sequential Extraction of Local ICA StructuresSequential Extraction of Local ICA Structures
Sequential Extraction of Local ICA Structures
topujahin
 
K-Means manual work
K-Means manual workK-Means manual work
K-Means manual work
Dr.E.N.Sathishkumar
 
Manifold Blurring Mean Shift algorithms for manifold denoising, presentation,...
Manifold Blurring Mean Shift algorithms for manifold denoising, presentation,...Manifold Blurring Mean Shift algorithms for manifold denoising, presentation,...
Manifold Blurring Mean Shift algorithms for manifold denoising, presentation,...
Florent Renucci
 
Dce a novel delay correlation
Dce a novel delay correlationDce a novel delay correlation
Dce a novel delay correlation
ijdpsjournal
 
Application of Gravitational Search Algorithm and Fuzzy For Loss Reduction of...
Application of Gravitational Search Algorithm and Fuzzy For Loss Reduction of...Application of Gravitational Search Algorithm and Fuzzy For Loss Reduction of...
Application of Gravitational Search Algorithm and Fuzzy For Loss Reduction of...
IOSR Journals
 
EXTENDED K-MAP FOR MINIMIZING MULTIPLE OUTPUT LOGIC CIRCUITS
EXTENDED K-MAP FOR MINIMIZING MULTIPLE OUTPUT LOGIC CIRCUITSEXTENDED K-MAP FOR MINIMIZING MULTIPLE OUTPUT LOGIC CIRCUITS
EXTENDED K-MAP FOR MINIMIZING MULTIPLE OUTPUT LOGIC CIRCUITS
VLSICS Design
 
Manifold Blurring Mean Shift algorithms for manifold denoising, report, 2012
Manifold Blurring Mean Shift algorithms for manifold denoising, report, 2012Manifold Blurring Mean Shift algorithms for manifold denoising, report, 2012
Manifold Blurring Mean Shift algorithms for manifold denoising, report, 2012
Florent Renucci
 
Data scientist training in bangalore
Data scientist training in bangaloreData scientist training in bangalore
Data scientist training in bangalore
prathyusha1234
 

What's hot (11)

Intro to MATLAB and K-mean algorithm
Intro to MATLAB and K-mean algorithmIntro to MATLAB and K-mean algorithm
Intro to MATLAB and K-mean algorithm
 
Low Power Adaptive FIR Filter Based on Distributed Arithmetic
Low Power Adaptive FIR Filter Based on Distributed ArithmeticLow Power Adaptive FIR Filter Based on Distributed Arithmetic
Low Power Adaptive FIR Filter Based on Distributed Arithmetic
 
Clustering
ClusteringClustering
Clustering
 
Sequential Extraction of Local ICA Structures
Sequential Extraction of Local ICA StructuresSequential Extraction of Local ICA Structures
Sequential Extraction of Local ICA Structures
 
K-Means manual work
K-Means manual workK-Means manual work
K-Means manual work
 
Manifold Blurring Mean Shift algorithms for manifold denoising, presentation,...
Manifold Blurring Mean Shift algorithms for manifold denoising, presentation,...Manifold Blurring Mean Shift algorithms for manifold denoising, presentation,...
Manifold Blurring Mean Shift algorithms for manifold denoising, presentation,...
 
Dce a novel delay correlation
Dce a novel delay correlationDce a novel delay correlation
Dce a novel delay correlation
 
Application of Gravitational Search Algorithm and Fuzzy For Loss Reduction of...
Application of Gravitational Search Algorithm and Fuzzy For Loss Reduction of...Application of Gravitational Search Algorithm and Fuzzy For Loss Reduction of...
Application of Gravitational Search Algorithm and Fuzzy For Loss Reduction of...
 
EXTENDED K-MAP FOR MINIMIZING MULTIPLE OUTPUT LOGIC CIRCUITS
EXTENDED K-MAP FOR MINIMIZING MULTIPLE OUTPUT LOGIC CIRCUITSEXTENDED K-MAP FOR MINIMIZING MULTIPLE OUTPUT LOGIC CIRCUITS
EXTENDED K-MAP FOR MINIMIZING MULTIPLE OUTPUT LOGIC CIRCUITS
 
Manifold Blurring Mean Shift algorithms for manifold denoising, report, 2012
Manifold Blurring Mean Shift algorithms for manifold denoising, report, 2012Manifold Blurring Mean Shift algorithms for manifold denoising, report, 2012
Manifold Blurring Mean Shift algorithms for manifold denoising, report, 2012
 
Data scientist training in bangalore
Data scientist training in bangaloreData scientist training in bangalore
Data scientist training in bangalore
 

Similar to Data Modelling

An improvement in k mean clustering algorithm using better time and accuracy
An improvement in k mean clustering algorithm using better time and accuracyAn improvement in k mean clustering algorithm using better time and accuracy
An improvement in k mean clustering algorithm using better time and accuracy
ijpla
 
Neural nw k means
Neural nw k meansNeural nw k means
Neural nw k means
Eng. Dr. Dennis N. Mwighusa
 
Premeditated Initial Points for K-Means Clustering
Premeditated Initial Points for K-Means ClusteringPremeditated Initial Points for K-Means Clustering
Premeditated Initial Points for K-Means Clustering
IJCSIS Research Publications
 
Mine Blood Donors Information through Improved K-Means Clustering
Mine Blood Donors Information through Improved K-Means ClusteringMine Blood Donors Information through Improved K-Means Clustering
Mine Blood Donors Information through Improved K-Means Clustering
ijcsity
 
50120140505013
5012014050501350120140505013
50120140505013
IAEME Publication
 
Bayesian Co clustering
Bayesian Co clusteringBayesian Co clustering
Bayesian Co clustering
lau
 
Predicting rainfall using ensemble of ensembles
Predicting rainfall using ensemble of ensemblesPredicting rainfall using ensemble of ensembles
Predicting rainfall using ensemble of ensembles
Varad Meru
 
Clustering Using Shared Reference Points Algorithm Based On a Sound Data Model
Clustering Using Shared Reference Points Algorithm Based On a Sound Data ModelClustering Using Shared Reference Points Algorithm Based On a Sound Data Model
Clustering Using Shared Reference Points Algorithm Based On a Sound Data Model
Waqas Tariq
 
Automated Clustering Project - 12th CONTECSI 34th WCARS
Automated Clustering Project - 12th CONTECSI 34th WCARS Automated Clustering Project - 12th CONTECSI 34th WCARS
Automated Clustering Project - 12th CONTECSI 34th WCARS
TECSI FEA USP
 
The International Journal of Engineering and Science (The IJES)
The International Journal of Engineering and Science (The IJES)The International Journal of Engineering and Science (The IJES)
The International Journal of Engineering and Science (The IJES)
theijes
 
Parametric Comparison of K-means and Adaptive K-means Clustering Performance ...
Parametric Comparison of K-means and Adaptive K-means Clustering Performance ...Parametric Comparison of K-means and Adaptive K-means Clustering Performance ...
Parametric Comparison of K-means and Adaptive K-means Clustering Performance ...
IJECEIAES
 
Thesis (presentation)
Thesis (presentation)Thesis (presentation)
Thesis (presentation)
nlt2390
 
Statistical Clustering
Statistical ClusteringStatistical Clustering
Statistical Clustering
tim_hare
 
FinalReportFoxMelle
FinalReportFoxMelleFinalReportFoxMelle
FinalReportFoxMelle
Fridtjof Melle
 
Data analysis of weather forecasting
Data analysis of weather forecastingData analysis of weather forecasting
Data analysis of weather forecasting
Trupti Shingala, WAS, CPACC, CPWA, JAWS, CSM
 
Parameter Optimisation for Automated Feature Point Detection
Parameter Optimisation for Automated Feature Point DetectionParameter Optimisation for Automated Feature Point Detection
Parameter Optimisation for Automated Feature Point Detection
Dario Panada
 
Clustering.pptx
Clustering.pptxClustering.pptx
Clustering.pptx
19526YuvaKumarIrigi
 
Chapter 11. Cluster Analysis Advanced Methods.ppt
Chapter 11. Cluster Analysis Advanced Methods.pptChapter 11. Cluster Analysis Advanced Methods.ppt
Chapter 11. Cluster Analysis Advanced Methods.ppt
Subrata Kumer Paul
 
Statistical Data Analysis on a Data Set (Diabetes 130-US hospitals for years ...
Statistical Data Analysis on a Data Set (Diabetes 130-US hospitals for years ...Statistical Data Analysis on a Data Set (Diabetes 130-US hospitals for years ...
Statistical Data Analysis on a Data Set (Diabetes 130-US hospitals for years ...
Seval Çapraz
 
Colombo14a
Colombo14aColombo14a
Colombo14a
AlferoSimona
 

Similar to Data Modelling (20)

An improvement in k mean clustering algorithm using better time and accuracy
An improvement in k mean clustering algorithm using better time and accuracyAn improvement in k mean clustering algorithm using better time and accuracy
An improvement in k mean clustering algorithm using better time and accuracy
 
Neural nw k means
Neural nw k meansNeural nw k means
Neural nw k means
 
Premeditated Initial Points for K-Means Clustering
Premeditated Initial Points for K-Means ClusteringPremeditated Initial Points for K-Means Clustering
Premeditated Initial Points for K-Means Clustering
 
Mine Blood Donors Information through Improved K-Means Clustering
Mine Blood Donors Information through Improved K-Means ClusteringMine Blood Donors Information through Improved K-Means Clustering
Mine Blood Donors Information through Improved K-Means Clustering
 
50120140505013
5012014050501350120140505013
50120140505013
 
Bayesian Co clustering
Bayesian Co clusteringBayesian Co clustering
Bayesian Co clustering
 
Predicting rainfall using ensemble of ensembles
Predicting rainfall using ensemble of ensemblesPredicting rainfall using ensemble of ensembles
Predicting rainfall using ensemble of ensembles
 
Clustering Using Shared Reference Points Algorithm Based On a Sound Data Model
Clustering Using Shared Reference Points Algorithm Based On a Sound Data ModelClustering Using Shared Reference Points Algorithm Based On a Sound Data Model
Clustering Using Shared Reference Points Algorithm Based On a Sound Data Model
 
Automated Clustering Project - 12th CONTECSI 34th WCARS
Automated Clustering Project - 12th CONTECSI 34th WCARS Automated Clustering Project - 12th CONTECSI 34th WCARS
Automated Clustering Project - 12th CONTECSI 34th WCARS
 
The International Journal of Engineering and Science (The IJES)
The International Journal of Engineering and Science (The IJES)The International Journal of Engineering and Science (The IJES)
The International Journal of Engineering and Science (The IJES)
 
Parametric Comparison of K-means and Adaptive K-means Clustering Performance ...
Parametric Comparison of K-means and Adaptive K-means Clustering Performance ...Parametric Comparison of K-means and Adaptive K-means Clustering Performance ...
Parametric Comparison of K-means and Adaptive K-means Clustering Performance ...
 
Thesis (presentation)
Thesis (presentation)Thesis (presentation)
Thesis (presentation)
 
Statistical Clustering
Statistical ClusteringStatistical Clustering
Statistical Clustering
 
FinalReportFoxMelle
FinalReportFoxMelleFinalReportFoxMelle
FinalReportFoxMelle
 
Data analysis of weather forecasting
Data analysis of weather forecastingData analysis of weather forecasting
Data analysis of weather forecasting
 
Parameter Optimisation for Automated Feature Point Detection
Parameter Optimisation for Automated Feature Point DetectionParameter Optimisation for Automated Feature Point Detection
Parameter Optimisation for Automated Feature Point Detection
 
Clustering.pptx
Clustering.pptxClustering.pptx
Clustering.pptx
 
Chapter 11. Cluster Analysis Advanced Methods.ppt
Chapter 11. Cluster Analysis Advanced Methods.pptChapter 11. Cluster Analysis Advanced Methods.ppt
Chapter 11. Cluster Analysis Advanced Methods.ppt
 
Statistical Data Analysis on a Data Set (Diabetes 130-US hospitals for years ...
Statistical Data Analysis on a Data Set (Diabetes 130-US hospitals for years ...Statistical Data Analysis on a Data Set (Diabetes 130-US hospitals for years ...
Statistical Data Analysis on a Data Set (Diabetes 130-US hospitals for years ...
 
Colombo14a
Colombo14aColombo14a
Colombo14a
 

Recently uploaded

一比一原版多伦多大学毕业证(UofT毕业证书)学历如何办理
一比一原版多伦多大学毕业证(UofT毕业证书)学历如何办理一比一原版多伦多大学毕业证(UofT毕业证书)学历如何办理
一比一原版多伦多大学毕业证(UofT毕业证书)学历如何办理
eoxhsaa
 
Module 1 ppt BIG DATA ANALYTICS NOTES FOR MCA
Module 1 ppt BIG DATA ANALYTICS NOTES FOR MCAModule 1 ppt BIG DATA ANALYTICS NOTES FOR MCA
Module 1 ppt BIG DATA ANALYTICS NOTES FOR MCA
yuvarajkumar334
 
Template xxxxxxxx ssssssssssss Sertifikat.pptx
Template xxxxxxxx ssssssssssss Sertifikat.pptxTemplate xxxxxxxx ssssssssssss Sertifikat.pptx
Template xxxxxxxx ssssssssssss Sertifikat.pptx
TeukuEriSyahputra
 
Cell The Unit of Life for NEET Multiple Choice Questions.docx
Cell The Unit of Life for NEET Multiple Choice Questions.docxCell The Unit of Life for NEET Multiple Choice Questions.docx
Cell The Unit of Life for NEET Multiple Choice Questions.docx
vasanthatpuram
 
一比一原版英国赫特福德大学毕业证(hertfordshire毕业证书)如何办理
一比一原版英国赫特福德大学毕业证(hertfordshire毕业证书)如何办理一比一原版英国赫特福德大学毕业证(hertfordshire毕业证书)如何办理
一比一原版英国赫特福德大学毕业证(hertfordshire毕业证书)如何办理
nyvan3
 
一比一原版加拿大渥太华大学毕业证(uottawa毕业证书)如何办理
一比一原版加拿大渥太华大学毕业证(uottawa毕业证书)如何办理一比一原版加拿大渥太华大学毕业证(uottawa毕业证书)如何办理
一比一原版加拿大渥太华大学毕业证(uottawa毕业证书)如何办理
uevausa
 
Overview IFM June 2024 Consumer Confidence INDEX Report.pdf
Overview IFM June 2024 Consumer Confidence INDEX Report.pdfOverview IFM June 2024 Consumer Confidence INDEX Report.pdf
Overview IFM June 2024 Consumer Confidence INDEX Report.pdf
nhutnguyen355078
 
一比一原版(曼大毕业证书)曼尼托巴大学毕业证如何办理
一比一原版(曼大毕业证书)曼尼托巴大学毕业证如何办理一比一原版(曼大毕业证书)曼尼托巴大学毕业证如何办理
一比一原版(曼大毕业证书)曼尼托巴大学毕业证如何办理
ytypuem
 
原版制作(unimelb毕业证书)墨尔本大学毕业证Offer一模一样
原版制作(unimelb毕业证书)墨尔本大学毕业证Offer一模一样原版制作(unimelb毕业证书)墨尔本大学毕业证Offer一模一样
原版制作(unimelb毕业证书)墨尔本大学毕业证Offer一模一样
ihavuls
 
一比一原版澳洲西澳大学毕业证(uwa毕业证书)如何办理
一比一原版澳洲西澳大学毕业证(uwa毕业证书)如何办理一比一原版澳洲西澳大学毕业证(uwa毕业证书)如何办理
一比一原版澳洲西澳大学毕业证(uwa毕业证书)如何办理
aguty
 
社内勉強会資料_Hallucination of LLMs               .
社内勉強会資料_Hallucination of LLMs               .社内勉強会資料_Hallucination of LLMs               .
社内勉強会資料_Hallucination of LLMs               .
NABLAS株式会社
 
[VCOSA] Monthly Report - Cotton & Yarn Statistics March 2024
[VCOSA] Monthly Report - Cotton & Yarn Statistics March 2024[VCOSA] Monthly Report - Cotton & Yarn Statistics March 2024
[VCOSA] Monthly Report - Cotton & Yarn Statistics March 2024
Vietnam Cotton & Spinning Association
 
原版一比一多伦多大学毕业证(UofT毕业证书)如何办理
原版一比一多伦多大学毕业证(UofT毕业证书)如何办理原版一比一多伦多大学毕业证(UofT毕业证书)如何办理
原版一比一多伦多大学毕业证(UofT毕业证书)如何办理
mkkikqvo
 
一比一原版兰加拉学院毕业证(Langara毕业证书)学历如何办理
一比一原版兰加拉学院毕业证(Langara毕业证书)学历如何办理一比一原版兰加拉学院毕业证(Langara毕业证书)学历如何办理
一比一原版兰加拉学院毕业证(Langara毕业证书)学历如何办理
hyfjgavov
 
How To Control IO Usage using Resource Manager
How To Control IO Usage using Resource ManagerHow To Control IO Usage using Resource Manager
How To Control IO Usage using Resource Manager
Alireza Kamrani
 
一比一原版莱斯大学毕业证(rice毕业证)如何办理
一比一原版莱斯大学毕业证(rice毕业证)如何办理一比一原版莱斯大学毕业证(rice毕业证)如何办理
一比一原版莱斯大学毕业证(rice毕业证)如何办理
zsafxbf
 
一比一原版美国帕森斯设计学院毕业证(parsons毕业证书)如何办理
一比一原版美国帕森斯设计学院毕业证(parsons毕业证书)如何办理一比一原版美国帕森斯设计学院毕业证(parsons毕业证书)如何办理
一比一原版美国帕森斯设计学院毕业证(parsons毕业证书)如何办理
asyed10
 
Experts live - Improving user adoption with AI
Experts live - Improving user adoption with AIExperts live - Improving user adoption with AI
Experts live - Improving user adoption with AI
jitskeb
 
一比一原版(uob毕业证书)伯明翰大学毕业证如何办理
一比一原版(uob毕业证书)伯明翰大学毕业证如何办理一比一原版(uob毕业证书)伯明翰大学毕业证如何办理
一比一原版(uob毕业证书)伯明翰大学毕业证如何办理
9gr6pty
 
一比一原版爱尔兰都柏林大学毕业证(本硕)ucd学位证书如何办理
一比一原版爱尔兰都柏林大学毕业证(本硕)ucd学位证书如何办理一比一原版爱尔兰都柏林大学毕业证(本硕)ucd学位证书如何办理
一比一原版爱尔兰都柏林大学毕业证(本硕)ucd学位证书如何办理
hqfek
 

Recently uploaded (20)

一比一原版多伦多大学毕业证(UofT毕业证书)学历如何办理
一比一原版多伦多大学毕业证(UofT毕业证书)学历如何办理一比一原版多伦多大学毕业证(UofT毕业证书)学历如何办理
一比一原版多伦多大学毕业证(UofT毕业证书)学历如何办理
 
Module 1 ppt BIG DATA ANALYTICS NOTES FOR MCA
Module 1 ppt BIG DATA ANALYTICS NOTES FOR MCAModule 1 ppt BIG DATA ANALYTICS NOTES FOR MCA
Module 1 ppt BIG DATA ANALYTICS NOTES FOR MCA
 
Template xxxxxxxx ssssssssssss Sertifikat.pptx
Template xxxxxxxx ssssssssssss Sertifikat.pptxTemplate xxxxxxxx ssssssssssss Sertifikat.pptx
Template xxxxxxxx ssssssssssss Sertifikat.pptx
 
Cell The Unit of Life for NEET Multiple Choice Questions.docx
Cell The Unit of Life for NEET Multiple Choice Questions.docxCell The Unit of Life for NEET Multiple Choice Questions.docx
Cell The Unit of Life for NEET Multiple Choice Questions.docx
 
一比一原版英国赫特福德大学毕业证(hertfordshire毕业证书)如何办理
一比一原版英国赫特福德大学毕业证(hertfordshire毕业证书)如何办理一比一原版英国赫特福德大学毕业证(hertfordshire毕业证书)如何办理
一比一原版英国赫特福德大学毕业证(hertfordshire毕业证书)如何办理
 
一比一原版加拿大渥太华大学毕业证(uottawa毕业证书)如何办理
一比一原版加拿大渥太华大学毕业证(uottawa毕业证书)如何办理一比一原版加拿大渥太华大学毕业证(uottawa毕业证书)如何办理
一比一原版加拿大渥太华大学毕业证(uottawa毕业证书)如何办理
 
Overview IFM June 2024 Consumer Confidence INDEX Report.pdf
Overview IFM June 2024 Consumer Confidence INDEX Report.pdfOverview IFM June 2024 Consumer Confidence INDEX Report.pdf
Overview IFM June 2024 Consumer Confidence INDEX Report.pdf
 
一比一原版(曼大毕业证书)曼尼托巴大学毕业证如何办理
一比一原版(曼大毕业证书)曼尼托巴大学毕业证如何办理一比一原版(曼大毕业证书)曼尼托巴大学毕业证如何办理
一比一原版(曼大毕业证书)曼尼托巴大学毕业证如何办理
 
原版制作(unimelb毕业证书)墨尔本大学毕业证Offer一模一样
原版制作(unimelb毕业证书)墨尔本大学毕业证Offer一模一样原版制作(unimelb毕业证书)墨尔本大学毕业证Offer一模一样
原版制作(unimelb毕业证书)墨尔本大学毕业证Offer一模一样
 
一比一原版澳洲西澳大学毕业证(uwa毕业证书)如何办理
一比一原版澳洲西澳大学毕业证(uwa毕业证书)如何办理一比一原版澳洲西澳大学毕业证(uwa毕业证书)如何办理
一比一原版澳洲西澳大学毕业证(uwa毕业证书)如何办理
 
社内勉強会資料_Hallucination of LLMs               .
社内勉強会資料_Hallucination of LLMs               .社内勉強会資料_Hallucination of LLMs               .
社内勉強会資料_Hallucination of LLMs               .
 
[VCOSA] Monthly Report - Cotton & Yarn Statistics March 2024
[VCOSA] Monthly Report - Cotton & Yarn Statistics March 2024[VCOSA] Monthly Report - Cotton & Yarn Statistics March 2024
[VCOSA] Monthly Report - Cotton & Yarn Statistics March 2024
 
原版一比一多伦多大学毕业证(UofT毕业证书)如何办理
原版一比一多伦多大学毕业证(UofT毕业证书)如何办理原版一比一多伦多大学毕业证(UofT毕业证书)如何办理
原版一比一多伦多大学毕业证(UofT毕业证书)如何办理
 
一比一原版兰加拉学院毕业证(Langara毕业证书)学历如何办理
一比一原版兰加拉学院毕业证(Langara毕业证书)学历如何办理一比一原版兰加拉学院毕业证(Langara毕业证书)学历如何办理
一比一原版兰加拉学院毕业证(Langara毕业证书)学历如何办理
 
How To Control IO Usage using Resource Manager
How To Control IO Usage using Resource ManagerHow To Control IO Usage using Resource Manager
How To Control IO Usage using Resource Manager
 
一比一原版莱斯大学毕业证(rice毕业证)如何办理
一比一原版莱斯大学毕业证(rice毕业证)如何办理一比一原版莱斯大学毕业证(rice毕业证)如何办理
一比一原版莱斯大学毕业证(rice毕业证)如何办理
 
一比一原版美国帕森斯设计学院毕业证(parsons毕业证书)如何办理
一比一原版美国帕森斯设计学院毕业证(parsons毕业证书)如何办理一比一原版美国帕森斯设计学院毕业证(parsons毕业证书)如何办理
一比一原版美国帕森斯设计学院毕业证(parsons毕业证书)如何办理
 
Experts live - Improving user adoption with AI
Experts live - Improving user adoption with AIExperts live - Improving user adoption with AI
Experts live - Improving user adoption with AI
 
一比一原版(uob毕业证书)伯明翰大学毕业证如何办理
一比一原版(uob毕业证书)伯明翰大学毕业证如何办理一比一原版(uob毕业证书)伯明翰大学毕业证如何办理
一比一原版(uob毕业证书)伯明翰大学毕业证如何办理
 
一比一原版爱尔兰都柏林大学毕业证(本硕)ucd学位证书如何办理
一比一原版爱尔兰都柏林大学毕业证(本硕)ucd学位证书如何办理一比一原版爱尔兰都柏林大学毕业证(本硕)ucd学位证书如何办理
一比一原版爱尔兰都柏林大学毕业证(本硕)ucd学位证书如何办理
 

Data Modelling

  • 1. 1 COSC 2670 — Practical Data Science Assignment 2: Data Modelling and Presentation Nicholas Davis(s3712731), Luke Daws (s3322003) RMIT nicholas.davis@student.rmit.edu.au, luke.daws@student.rmit.edu.au Saturday 26th of May Table of Contents Abstract 2 Introduction 2 Methodology 2 Results 4 Discussion 13 Conclusion 15 References 16
  • 2. 2 Abstract Our aim for this assignment was to use clustering methods to group together wheat kernels by looking for similar characteristics in their physical properties. We expect these groupings to reflect the different varieties of the wheat kernels in the dataset. The dataset was taken from the UCI repository, and we applied 3 clustering techniques to it: K-means, DBSCAN and Agglomerative Clustering. Along with a confusion matrix, each model was evaluated with an Adjusted Rand Score, Adjusted Mutual Information Score and a Silhouette Coefficient. We found that K-means and Agglomerative Clustering performed quite well overall, with each slightly outperforming the other under different metrics. DBSCAN didn’t perform as well. It would be recommended when analysing this dataset or similar to use a clustering method like K-means or agglomerative clustering over a density based clustering algorithm like DBSCAN. Introduction This assignment is focused on data modelling, and specifically clustering. We will be using three different clustering models with the goal of grouping the ‘seeds’ dataset from the UCI Machine Learning Repository into meaningful clusters. The dataset consists of the values of 7 attributes (area A, perimeter P, compactness C = 4*pi*A/P^2, length of kernel, width of kernel, asymmetry coefficient length of kernel groove) for 70 kernels of wheat from each of 3 different varieties. (Kama, Rosa and Canadian). This dataset was used in (Charytanowicz et al. 2010) to compare the performance of a proposed new clustering model they name Complete Gradient Clustering Algorithm to that of the K-Means algorithm. We will repeat the analysis for K-Means and compare the results to those of the DBSCAN and Agglomerative Clustering algorithms, as implemented by the Python machine learning library scikit-learn. The variety of each wheat kernel is given in the dataset, so we are able to compare each clustering result against these labels and evaluate each model under the assumption that useful clusters will correspond to the wheat varieties. Methodology Given that we retrieved our data from the UCI repository, we did not anticipate needing to spend too much time with data-cleaning. There were some extra tab characters in the supplied text file, so we did check to make sure that they did not adversely affect data-loading. We also checked to make sure each attribute had been assigned the correct data type, which was float64 in each instance. Before beginning the data modelling phase, we carried out an exploration of the data. The first step was to separate the data itself from the target values. Target values were stored in a separate DataFrame and given more meaningful names. We made histograms of all the attributes (Fig.1 - 7) to provide some visualisation, then all the attributes were compared against each other using a scatter matrix (fig.8). Since there were only 7 attributes, with no missing or obviously incorrect data, we decided to train our models on all the attributes.
  • 3. 3 K-means The K-means model requires as input the value of K, which corresponds to the desired number of clusters. Clearly, we expect that K=3 will provide the best results, but its choice can also be justified without reference to the target values. When we plotted the value of the inertia for each set of results against K, we saw a clear elbow in the graph at K=3. (The inertia is an inbuilt attribute of the K-Means model on sci-kit learn that records a sum of the squared distances of each sample to its closest cluster center.) Agglomerative Clustering The Agglomerative Clustering model also requires as input the desired number of clusters, however it works in a very different way. Each observation begins in its own cluster, and these clusters are recursively merged based on distance. The specification of the desired number of clusters is therefore necessary to halt the algorithm before all clusters are merged. We selected the value 3 based on its validity for the K-means model. DBSCAN DBSCAN is an entirely different type of model, being density based. Two parameters are required, MinPts and eps, but the number of clusters to be found is not predetermined. Our eventual choice of parameters was MinPts = 11 and Eps = 0.9.
  • 4. 4 Results Fig.1 Histogram showing the Area of wheat seeds and their frequency Fig.2 Histogram showing the perimeter of wheat seeds and their frequency
  • 5. 5 Fig.3 Histogram showing the compactness of wheat seeds and their frequency Fig.4 Histogram showing the length of wheat seeds and their frequency
  • 6. 6 Fig.5 Histogram showing the width of wheat seeds and their frequency Fig.6 Histogram showing the Asymmetry coefficient of wheat seeds and their frequency
  • 7. 7 Fig.7 Histogram showing the Length of kernel groove of wheat seeds and their frequency
  • 8. 8 Fig.8 Scatter matrix comparing all attributes against each other in a scatter plot also displaying the above histograms (Fig.1-7).
  • 9. 9 KMeans Fig.9 Elbow Graph of K vs inertia indicating the curve is slowing around K = 3 Table.1 Clustering results of the K-means algorithm Clusters for K-Means 0 1 2 target Canadian 0 68 2 Kama 1 9 60 Rosa 60 0 10 Adjusted Rand Score: 0.7166
  • 10. 10 Fig.10 Scatterplot of the K-means model showing 3 clusters For the K-Means model cluster 0 is clearly associated with the Rosa variety, and contains only 1 grain from a different variety. However, 10 grains of the Rosa variety ended in cluster 2, which is otherwise strongly associated to the Kama variety. 9 grains of the Kama variety ended in cluster 1, which otherwise contained nearly all grains of the Canadian variety. DBSCAN Fig.11 14-distance graph
  • 11. 11 Table.2 Clustering results of the DBSCAN algorithm Clusters for DBSCAN 0 1 2 unclustered target Canadian 0 58 0 12 Kama 47 5 0 18 Rosa 2 0 37 31 Adjusted Rand Score: 0.4889 Fig.12 Scatterplot of the DBSCAN model and the clusters that it had predicted. In the DBSCAN model, Cluster 0 could be considered the Kama variety cluster, but it contains only 47 grains of that type. Cluster 1 captured 58 grains of the Canadian variety. Cluster 2 contained exclusively grains of the Rosa variety, so precision was perfect. However, only just over half the Rosa grains were placed in that cluster. Overall, 61 grains from the total of 210 were not placed in any cluster.
  • 12. 12 Agglomerative Clustering Table.3 Clustering results of the Agglomerative clustering algorithm Clusters for Agglomerative Clustering 0 1 2 target Canadian 70 0 0 Kama 16 0 54 Rosa 0 63 7 Adjusted Rand Score: 0.7132 Fig.13 Scatterplot of the Agglomerative Clustering model showing it’s associated clustering. The agglomerative clustering model created a cluster containing exclusively grains of the Rosa variety, but also misplaced a significant number in the cluster associated with the Kama variety. All Canadian variety grains were place in cluster 0, however this model placed 16 Kama grains in that cluster.
  • 13. 13 Fig.14 Scatterplot showing the true wheat varieties. Yellow = Canadian Purple = Kama Green = Rosa Discussion For each model we obtained a ‘confusion matrix’ (Table 1-3) with rows corresponding to the actual wheat varieties and columns recording which cluster the observations were assigned to by the model. We also present a scatter plot (Fig.10, 12, 13) to help with visualisation of the result for each model. Following (Charytanowicz et al. 2010), we projected the data onto the two greatest principal components to generate these plots, rather than choosing any two of the attributes for display. Interestingly, our data plots differently to that in Fig. 3 of Charytanowicz et al. This suggests that the implementation of Principal Component Analysis in scikit-learn differs from their implementation in some way, but they did not provide details to investigate. The K-means model was able to perform fairly well the precision for cluster 0 was very good exclusively clustering the Rosa variety but the recall placed 10 in cluster 2. The precision for cluster 2 wasn’t so great, although it can be considered the Kama cluster it managed to assign 12 kernels of the other varieties to that cluster. The DBSCAN model had trouble forming clusters on this data set, regardless of the parameters chosen. For MinPts, we initially followed the suggestion in (Sander et al. 1998) of 2*(number of attributes) = 14. For a given value of MinPts, a good value of Eps can theoretically be obtained by looking for an elbow in the corresponding k- distance graph (Fig.11) (Ester et el. 1996). Using these parameters, DBSCAN only formed a single cluster. Varying eps still did not yield good results as measure by the adjusted rand score. We also tried the default value MinPts=4 suggested originally by the authors in (Ester et al. 1996), but were still unhappy with the results. Eventually, we conducted a grid search of all values for MinPts from 4 to 14, and all values of eps from 0.3 to
  • 14. 14 2.0. The values that performed best with respect to both the adjusted rand score metric and the adjusted mutual information metric were MinPts = 11 , eps = 0.9. Even with this choice of parameters, the DBSCAN model scored much lower than the other two models we evaluated. The clusters formed were quite precise, but a large number of grains remained unclustered. Increasing eps in the hope of capturing more points led to a merge of all clusters rather than simply making the existing ones larger. Our third model (Agglomerative Clustering) performed on par with the K-means model. The recall for the Canadian variety was quite good clustering all 70 of them in cluster 0 although it’s precision was not as good as it also clustered 16 of the Kama variety with it. The precision of cluster 1 was good, only clustering the Rosa variety. The adjusted rand score showed that the model does perform just as well as K- means having only a difference of .0034. Aside from creating a confusion matrix and exploring precision and recall, there are a number of other metrics available to evaluate the performance of clustering models. Many suffer from the drawback that it is necessary to know the ground truth classes, but this does not affect us, as we know the variety of each grain of wheat. This enabled us to compare our models using the Adjusted Rand Score and the Adjusted Mutual Information Score. We also calculated the Silhouette Coefficient, which is an internal evaluation for clustering models (meaning that it does not require the ground truth classes.) The Rand score is a measure of similarity for two partitions of a set. It gives the proportion of all pairs of elements that are either in the same subset in both partitions, or in different subsets in both. Details of this measure appear in (Hubert & Arabie 1985) The Mutual Information Score is calculated using the concept of information entropy. In both cases, the adjusted score is a correction for chance. The Adjusted Rand Score ranges from -1 to 1, while the Adjusted Mutual Information Score ranges from 0 to 1. In both case, a value of 1 indicates perfect agreement between the model and the ground truth classes. Finally, we evaluated each model using the Silhouette Coefficient. The Silhouette Coefficient is an internal evaluation which seeks to quantify how well-defined the clusters are without reference to ground class truths (which are normally unknown/non-existent when using clustering models.)
  • 15. 15 The performance of each model with respect to the three metrics is shown in the table below: Table.4 A comparison of the adjusted Rand score, adjusted mutual information score and silhouette coefficient for K-means, DBSCAN and agglomerative clustering. K- Means DBSCAN Agglomerative Clustering Adjusted Rand Score 0.7166 0.4889 0.7132 Adjusted Mutual Information Score 0.6907 0.4912 0.7243 Silhouette Coefficient 0.4719 0.2943 0.4494 The K-Means and Agglomerative Clustering models scored similarly with respect to each metric, and substantially bettered the results of DBSCAN. It should be noted that the Silhouette Coefficient does favour convex clusters, and so it is not unusual for density-based algorithms to score poorly with respect to that metric. It seems that the region of overlap between the true Canadian and Rosa varieties (visible in Fig. 14) was a point of difference between the K-Means model and the Agglomerative Clustering model. The bulk of observations in this region were allocated to the ‘Kama’ cluster by the K-Means model, and to the ‘Canadian’ cluster by the Agglomerative Clustering model. All three models produced ‘Rosa’ clusters with comparatively good precision when compared to the other two varieties (and this was also reported to be the case for CGCA in (Charytanowicz et al. 2010), but as reported earlier, the recall of the cluster formed by DBSCAN was not high. Conclusion Using each of three clustering models, we placed the data into three clusters. Examination of the corresponding confusion matrices showed that these clusters were related to the 3 varieties of wheat present in the dataset. In the case of K- Means and Agglomerative Clustering, the relationships were fairly robust, as reflected by the Adjusted Rand Score and Adjusted Mutual Information Score. For a dataset like this DBSCAN is not the right clustering technique to choose. While it managed to cluster some kernels, an overwhelming amount remained unclustered this is seen in Table.2 and can be seen visually in Fig.12. It also received a low score under the three different evaluation metrics used. The performance of K- Means and agglomerative clustering was quite even. Neither could be clearly recommended over the other with regard to this or similar datasets. A decision might come down to ease of implementation, or run-time.
  • 16. 16 References M. Charytanowicz, J. Niewczas, P. Kulczycki, P.A. Kowalski, S. Lukasik, S. Zak (2010), “A Complete Gradient Clustering Algorithm for Features Analysis of X-ray Images”.: Information Technologies in Biomedicine, Ewa Pietka, Jacek Kawa (eds.), Springer-Verlag, Berlin-Heidelberg, 2010, pp. 15-24. Ester, Martin; Kriegel, Hans-Peter; Sander, Jörg; Xu, Xiaowei (1996). Simoudis, Evangelos; Han, Jiawei; Fayyad, Usama M., eds. “A density-based algorithm for discovering clusters in large spatial databases with noise”. Proceedings of the Second International Conference on Knowledge Discovery and Data Mining (KDD-96). AAAI Press. pp. 226–231. Hubert, Lawrence and Arabie, Phipps (1985). "Comparing partitions". Journal of Classification. 2 (1): pp. 193–218. Sander, Jörg; Ester, Martin; Kriegel, Hans-Peter; Xu, Xiaowei (1998). "Density-Based Clustering in Spatial Databases: The Algorithm GDBSCAN and Its Applications". Data Mining and Knowledge Discovery. Berlin: Springer-Verlag. 2 (2): 169–194. Schubert, Erich; Sander, Jörg; Ester, Martin; Kriegel, Hans Peter; Xu, Xiaowei (July 2017). "DBSCAN Revisited, Revisited: Why and How You Should (Still) Use DBSCAN". ACM Trans. Database Syst. 42 (3): 19:1–19:21.