Download as PDF, PPTX
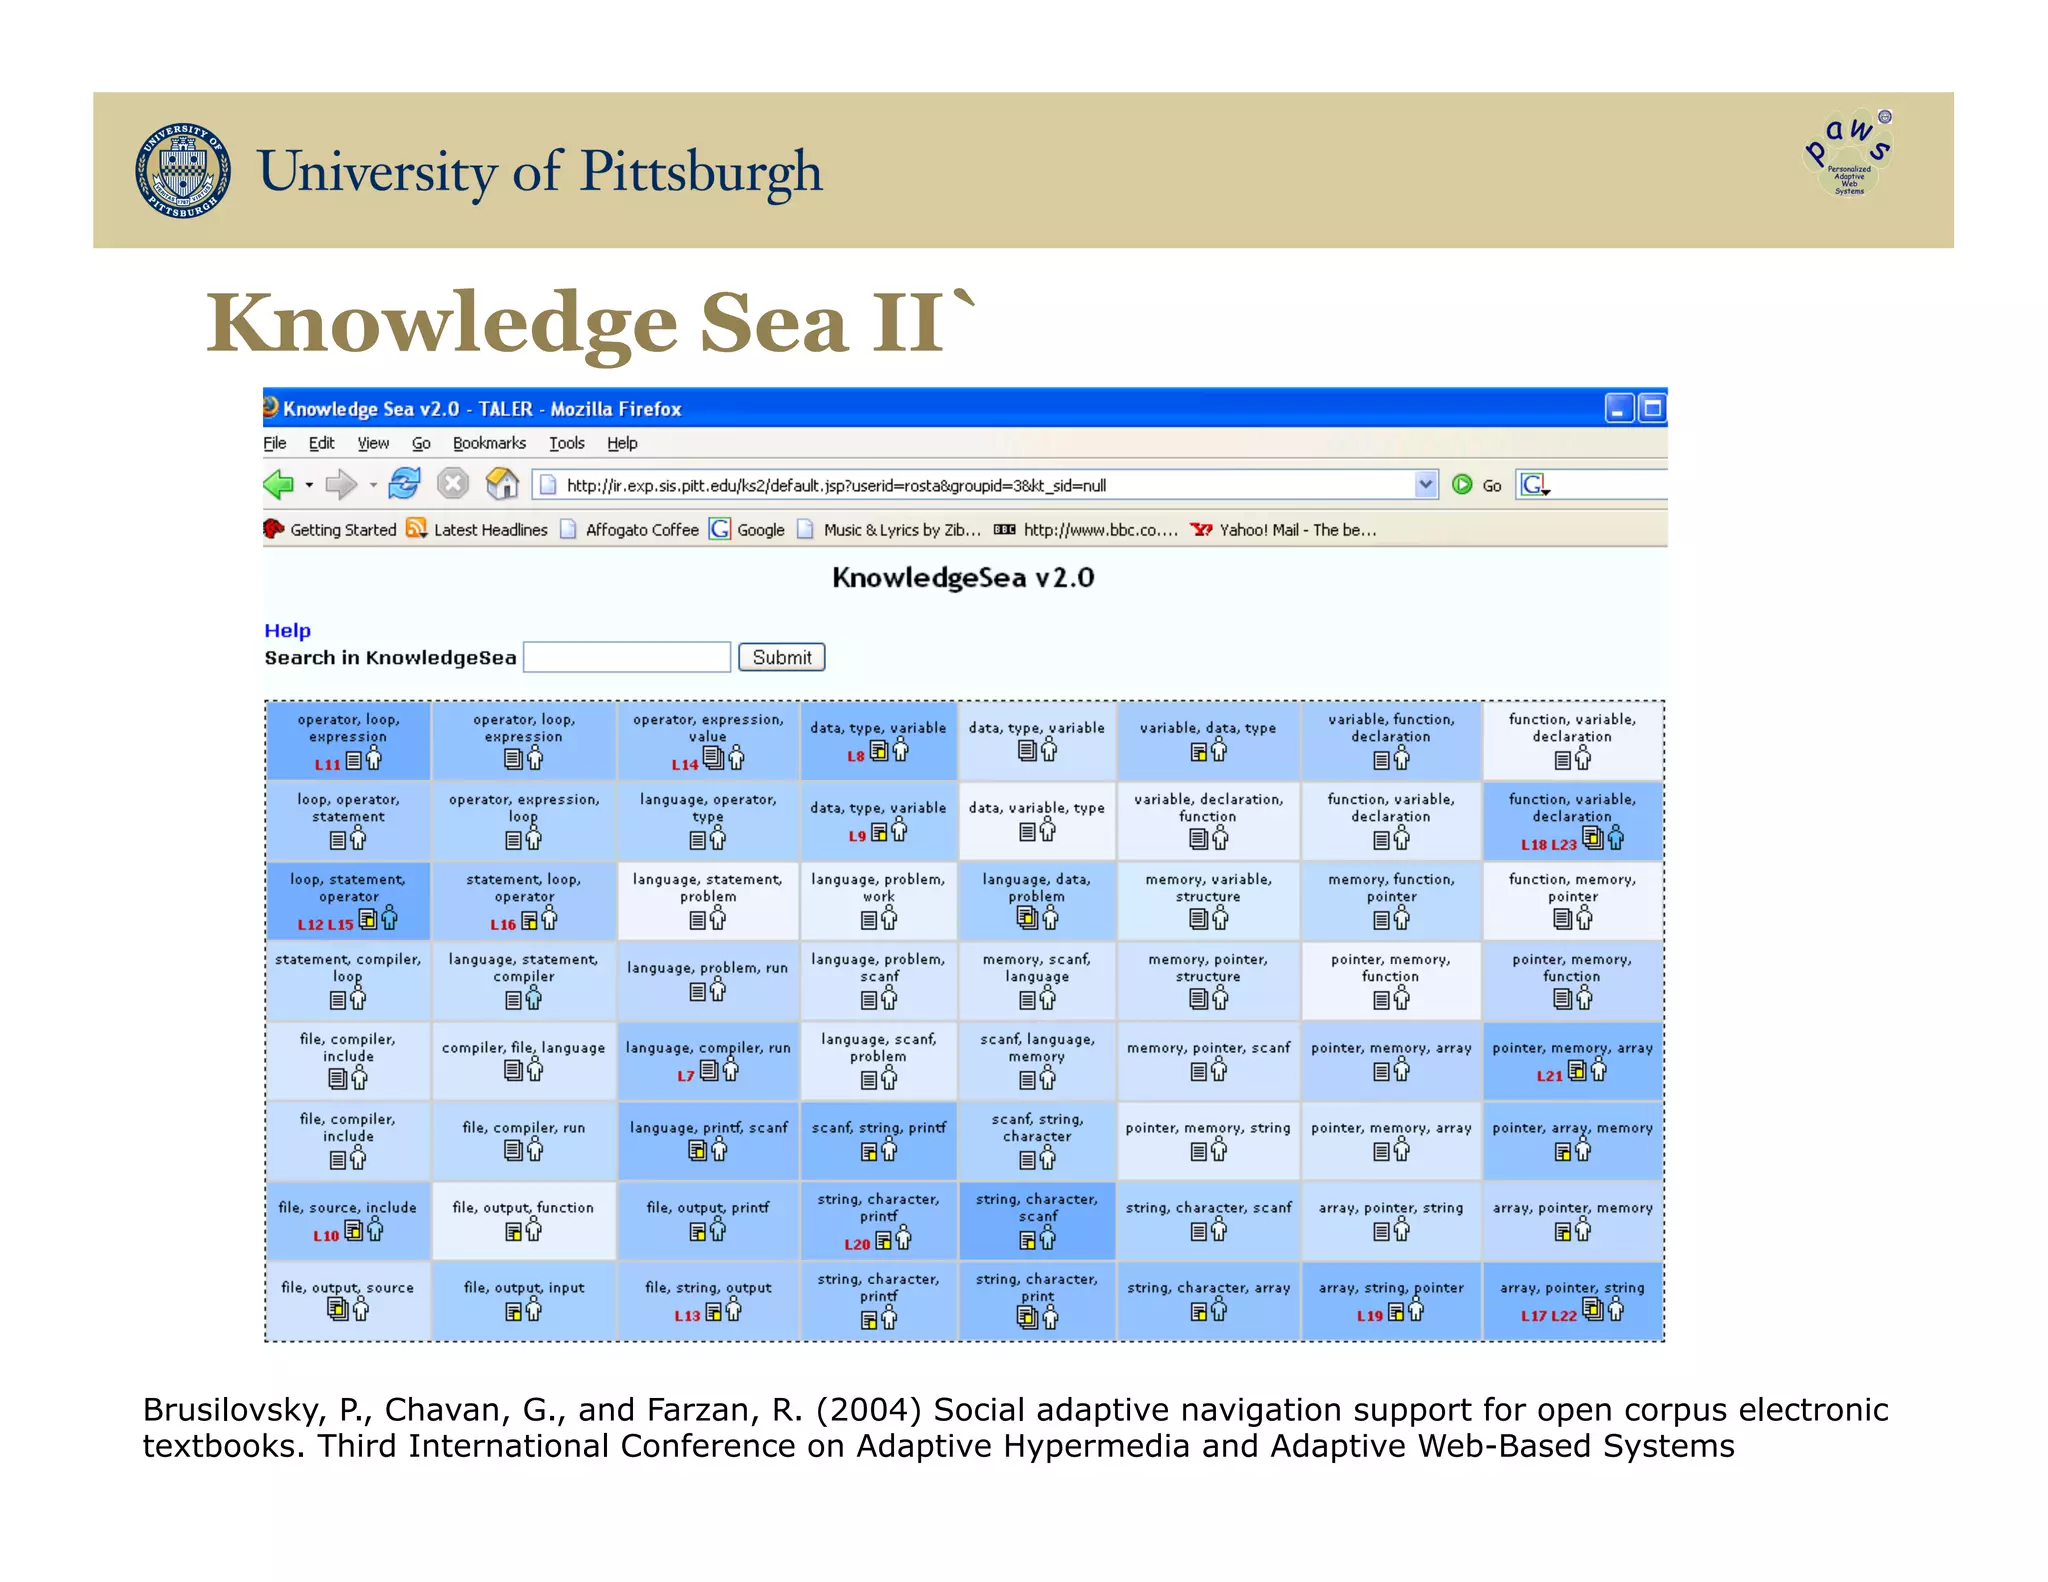
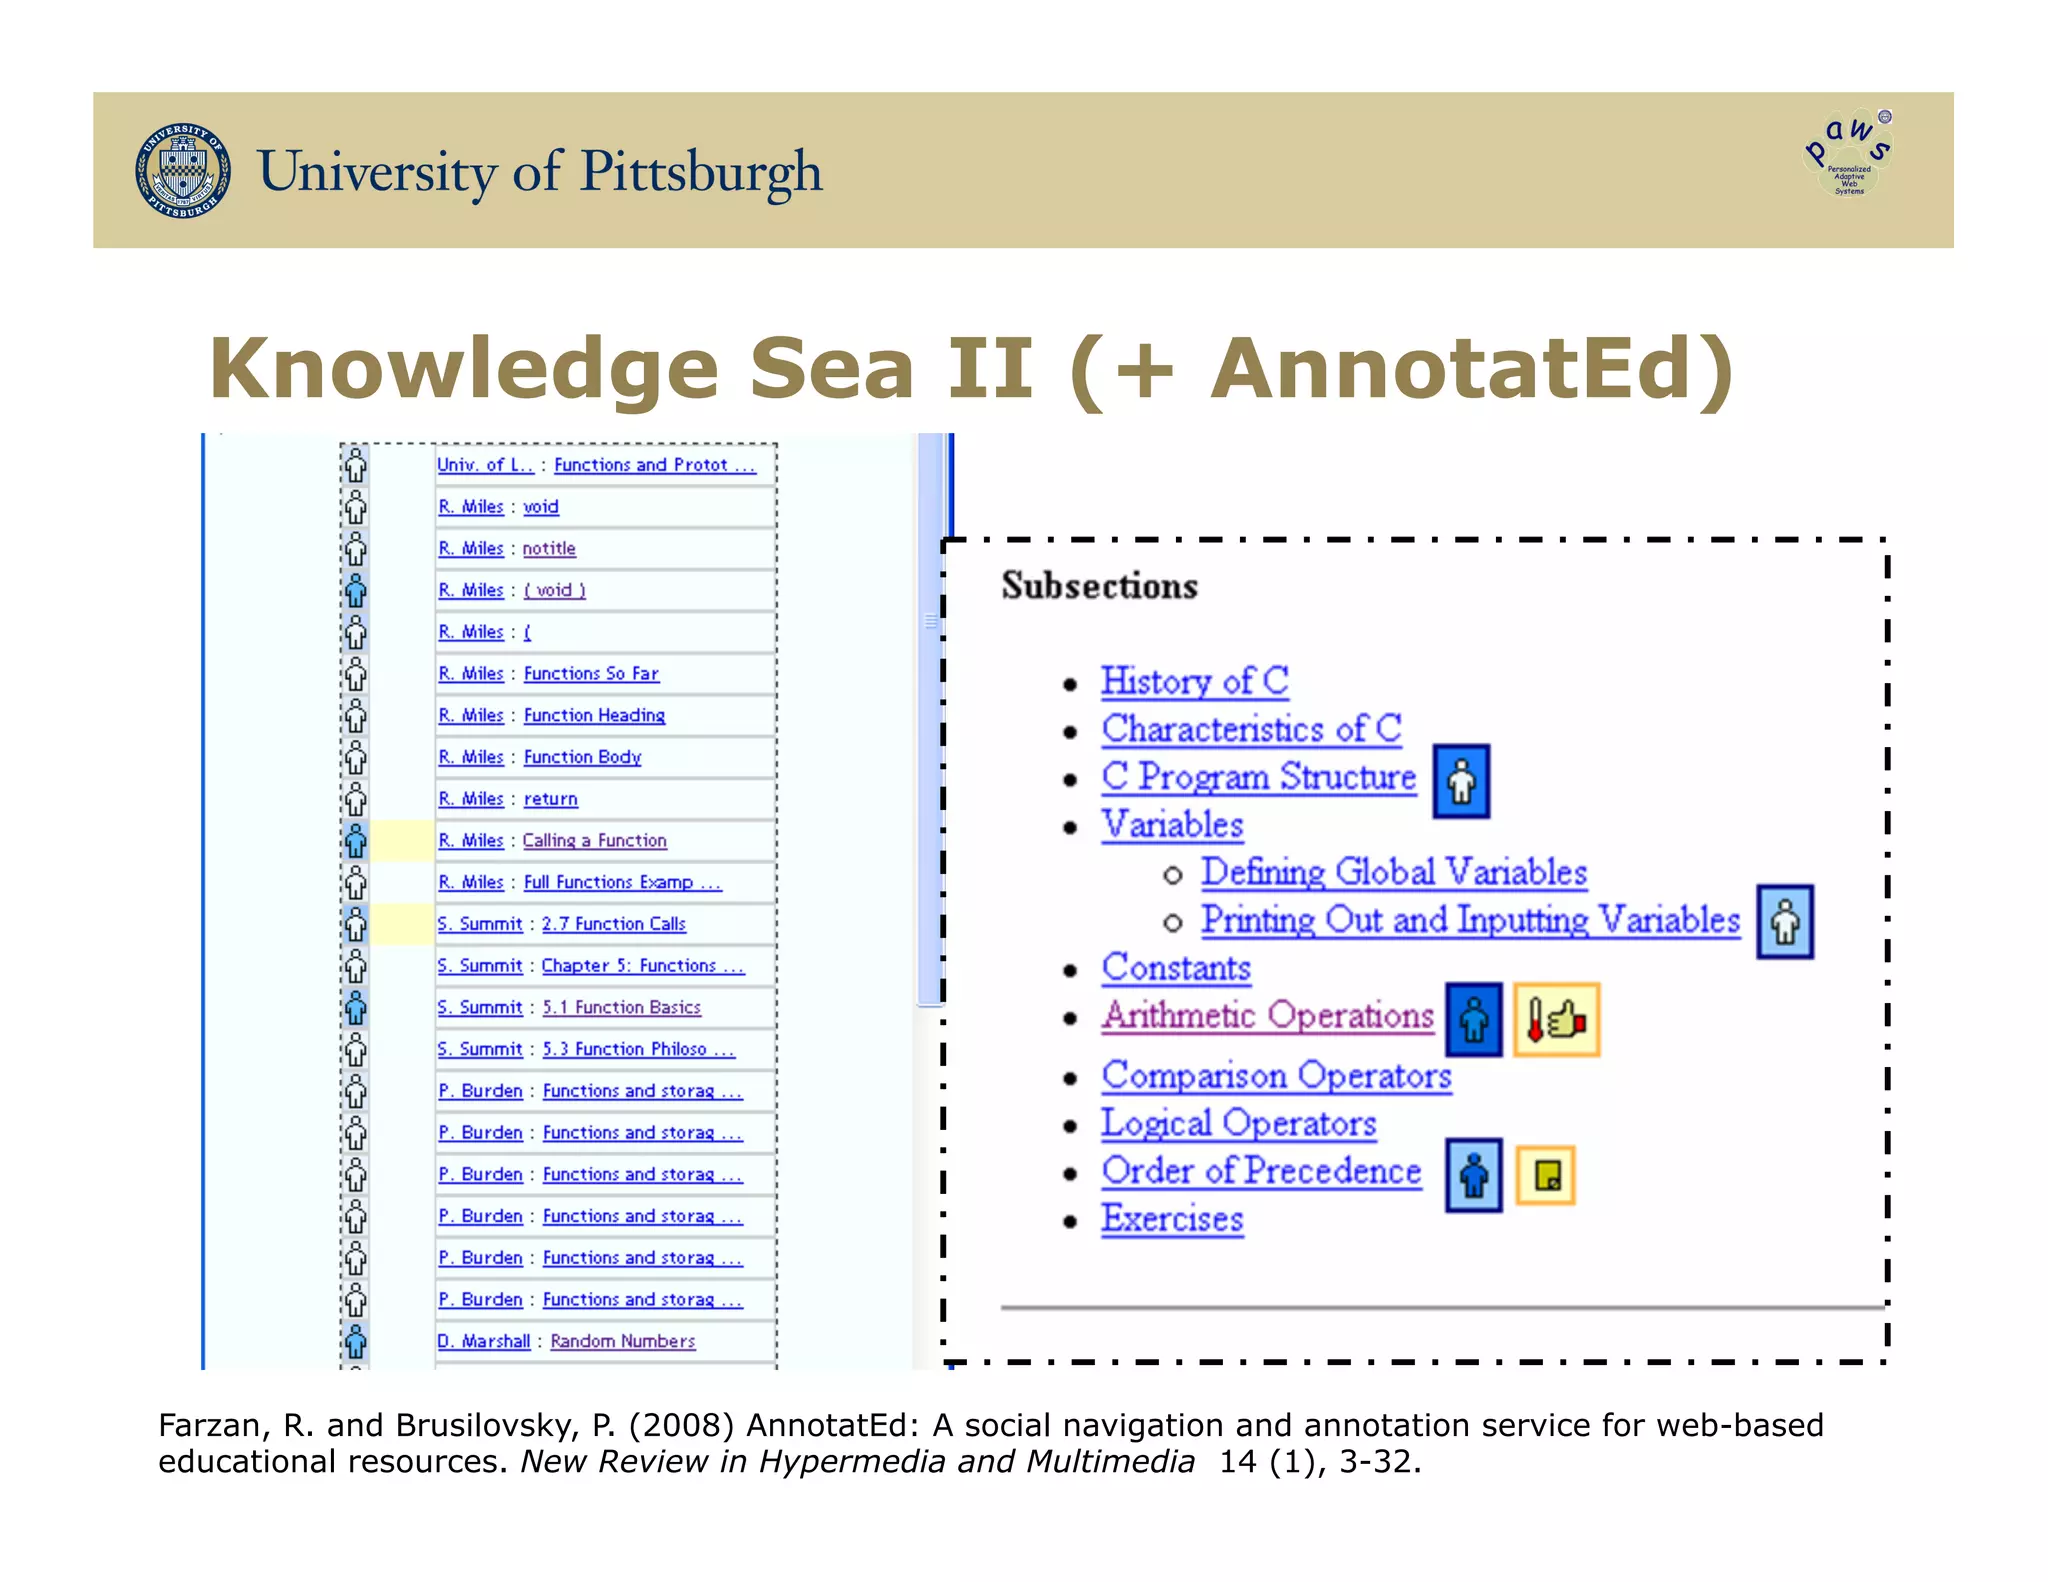


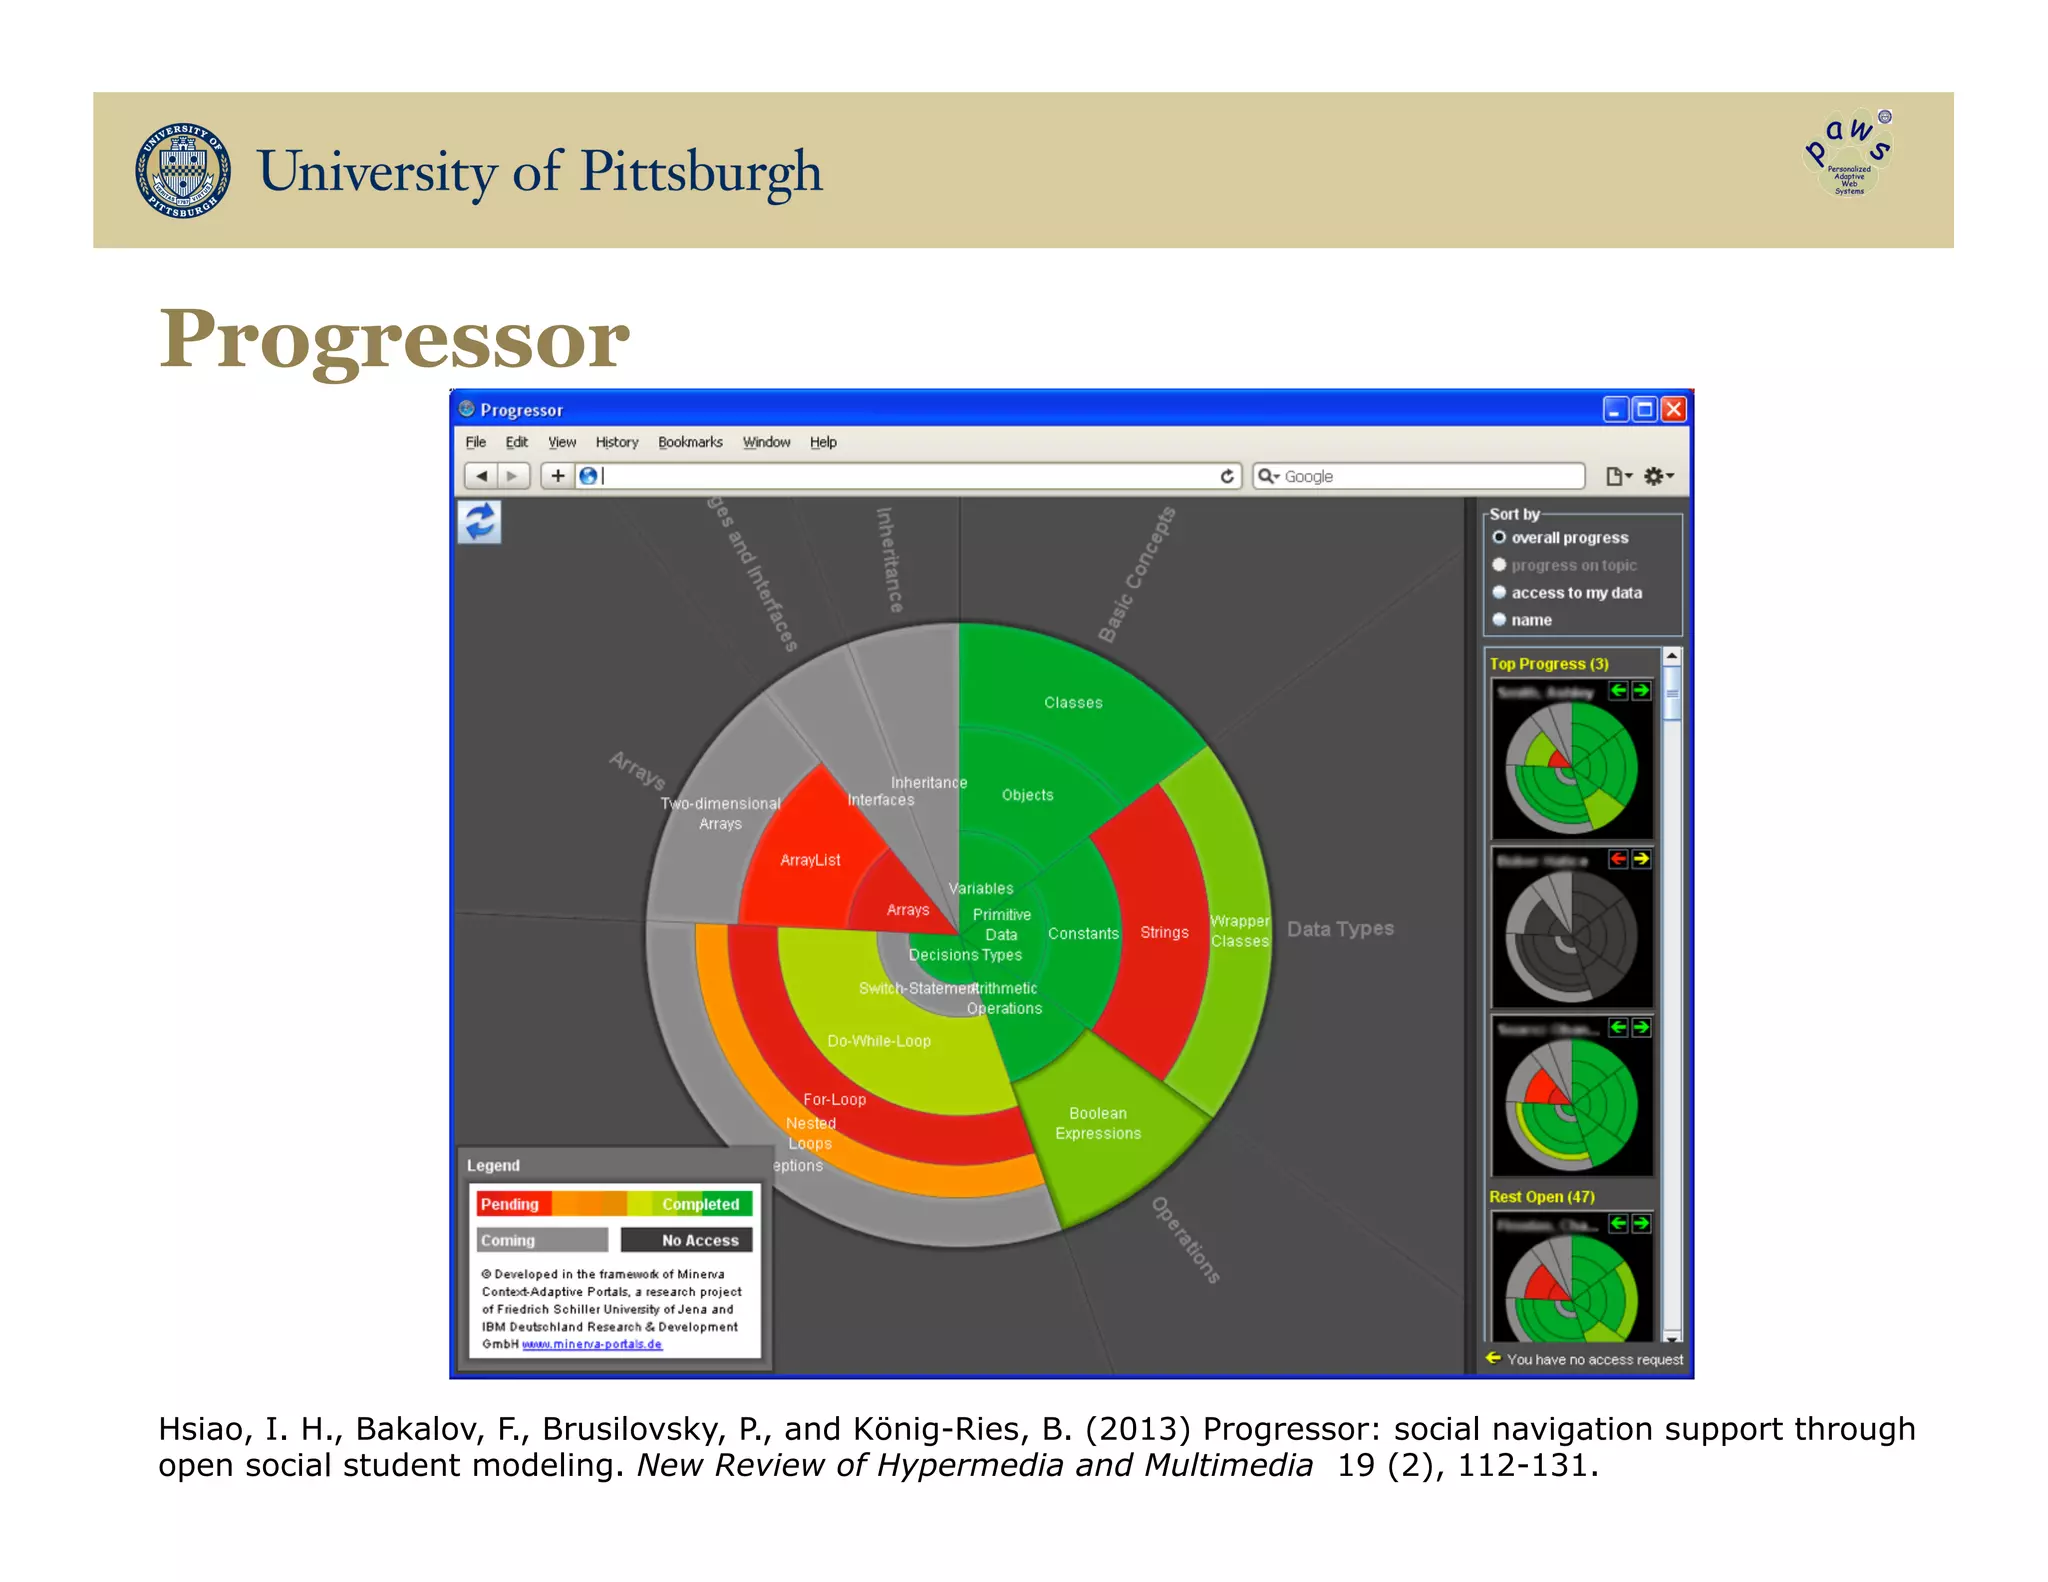


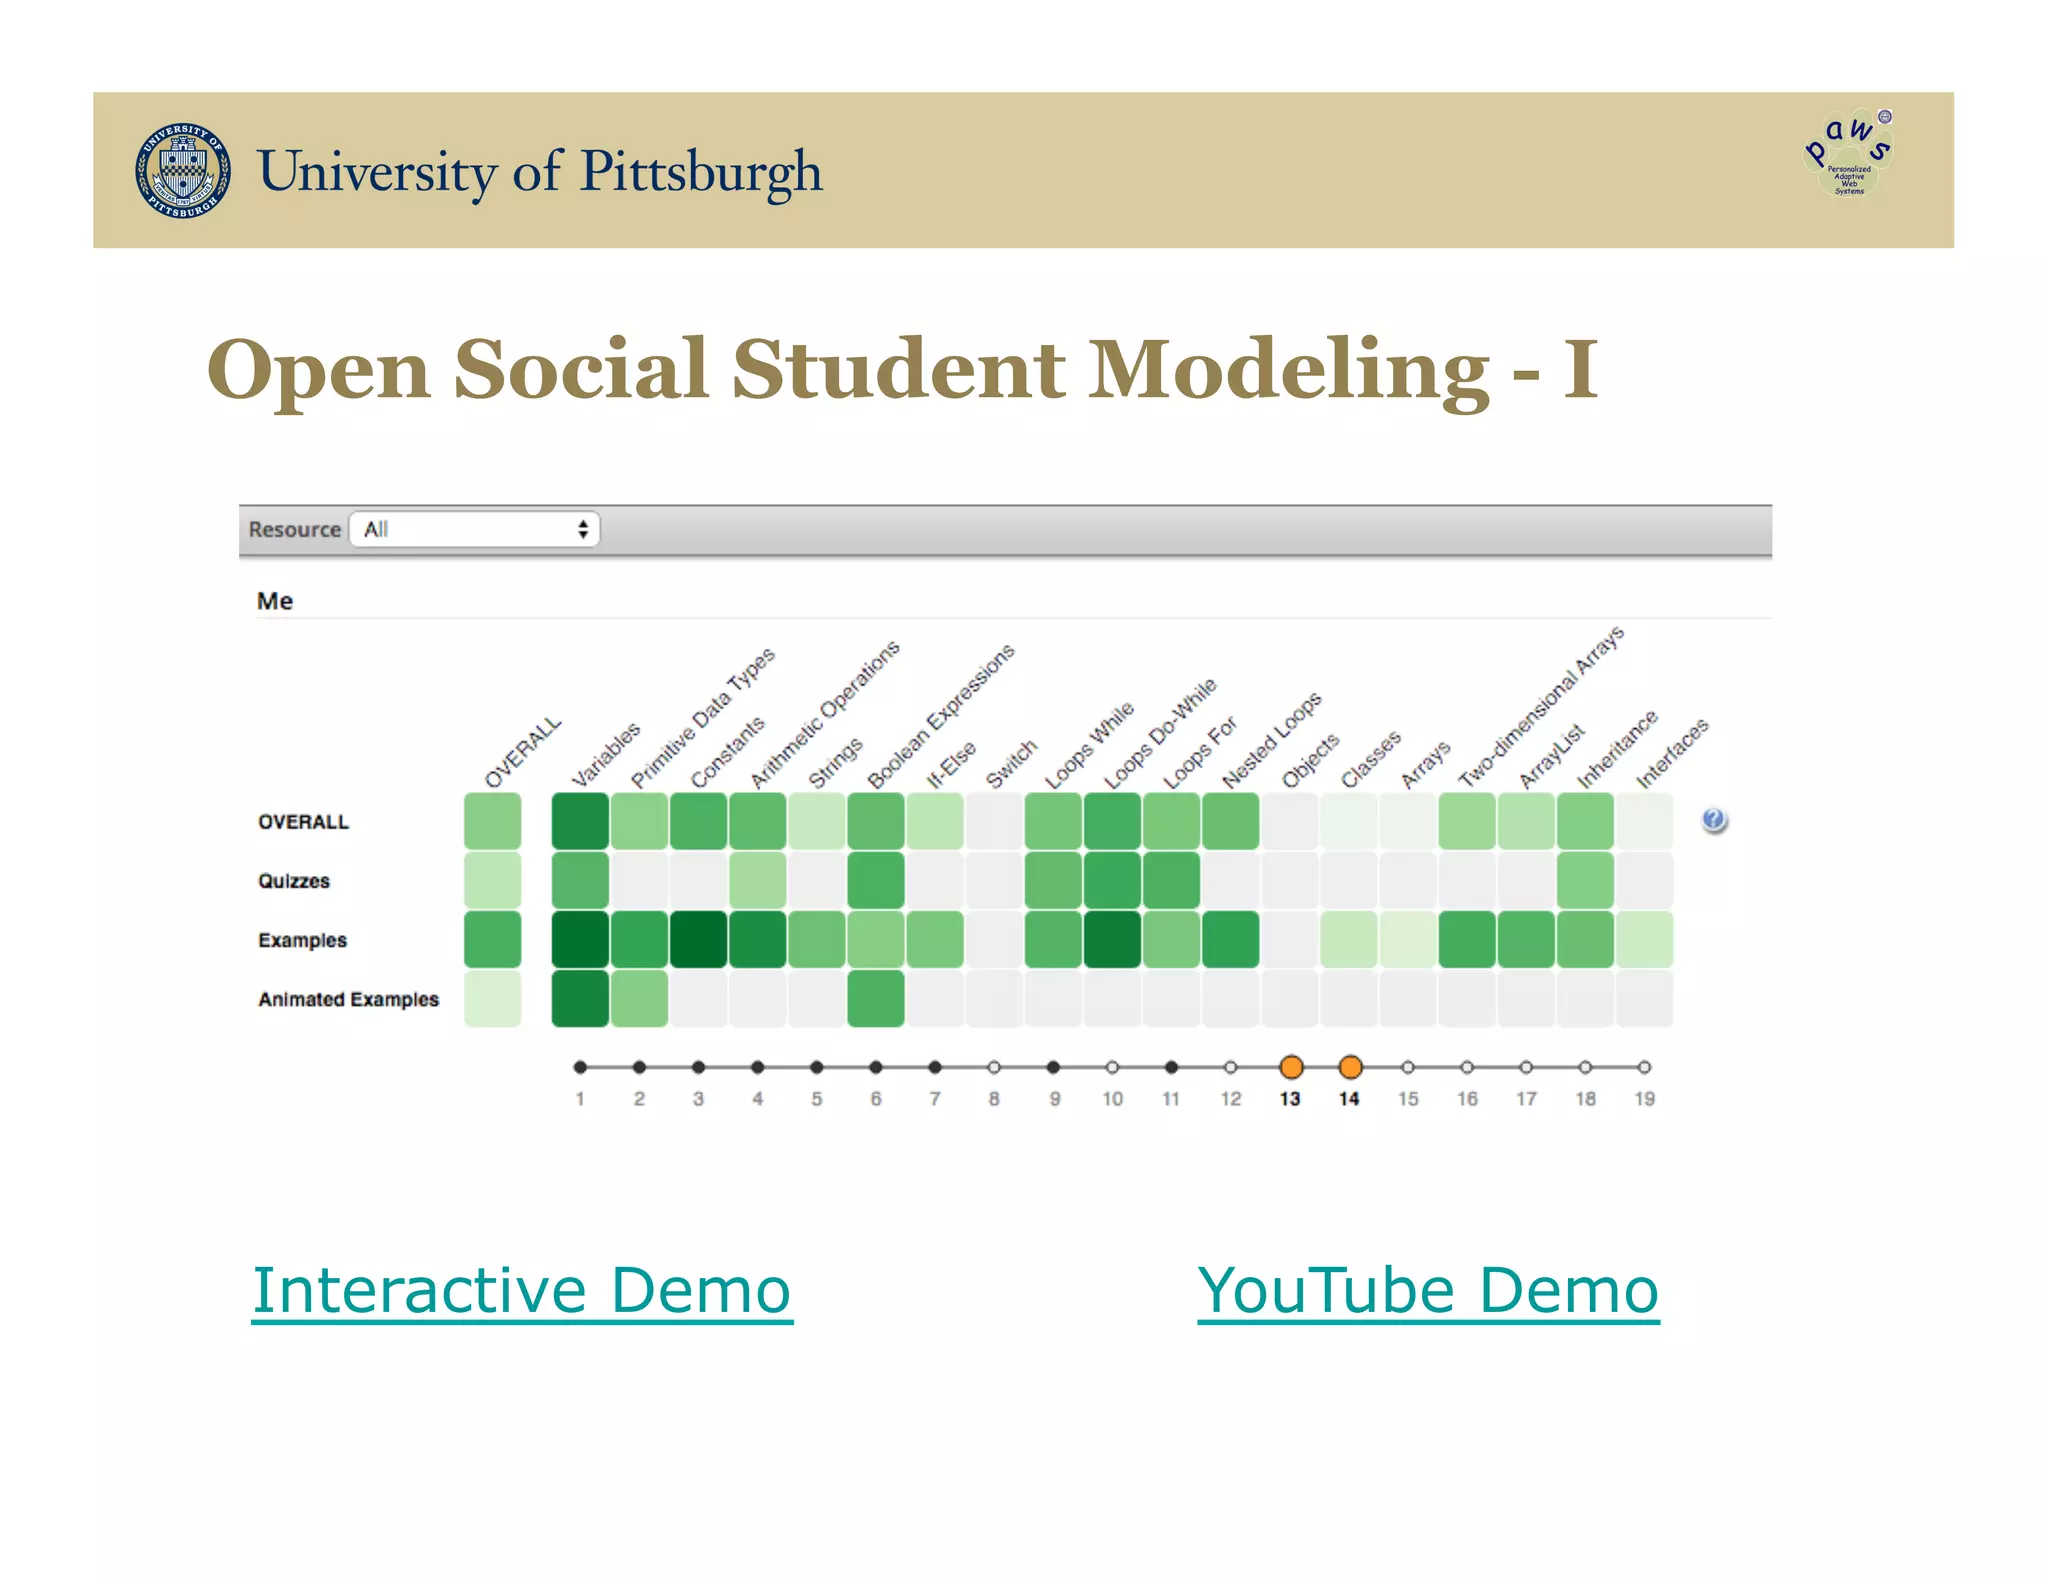
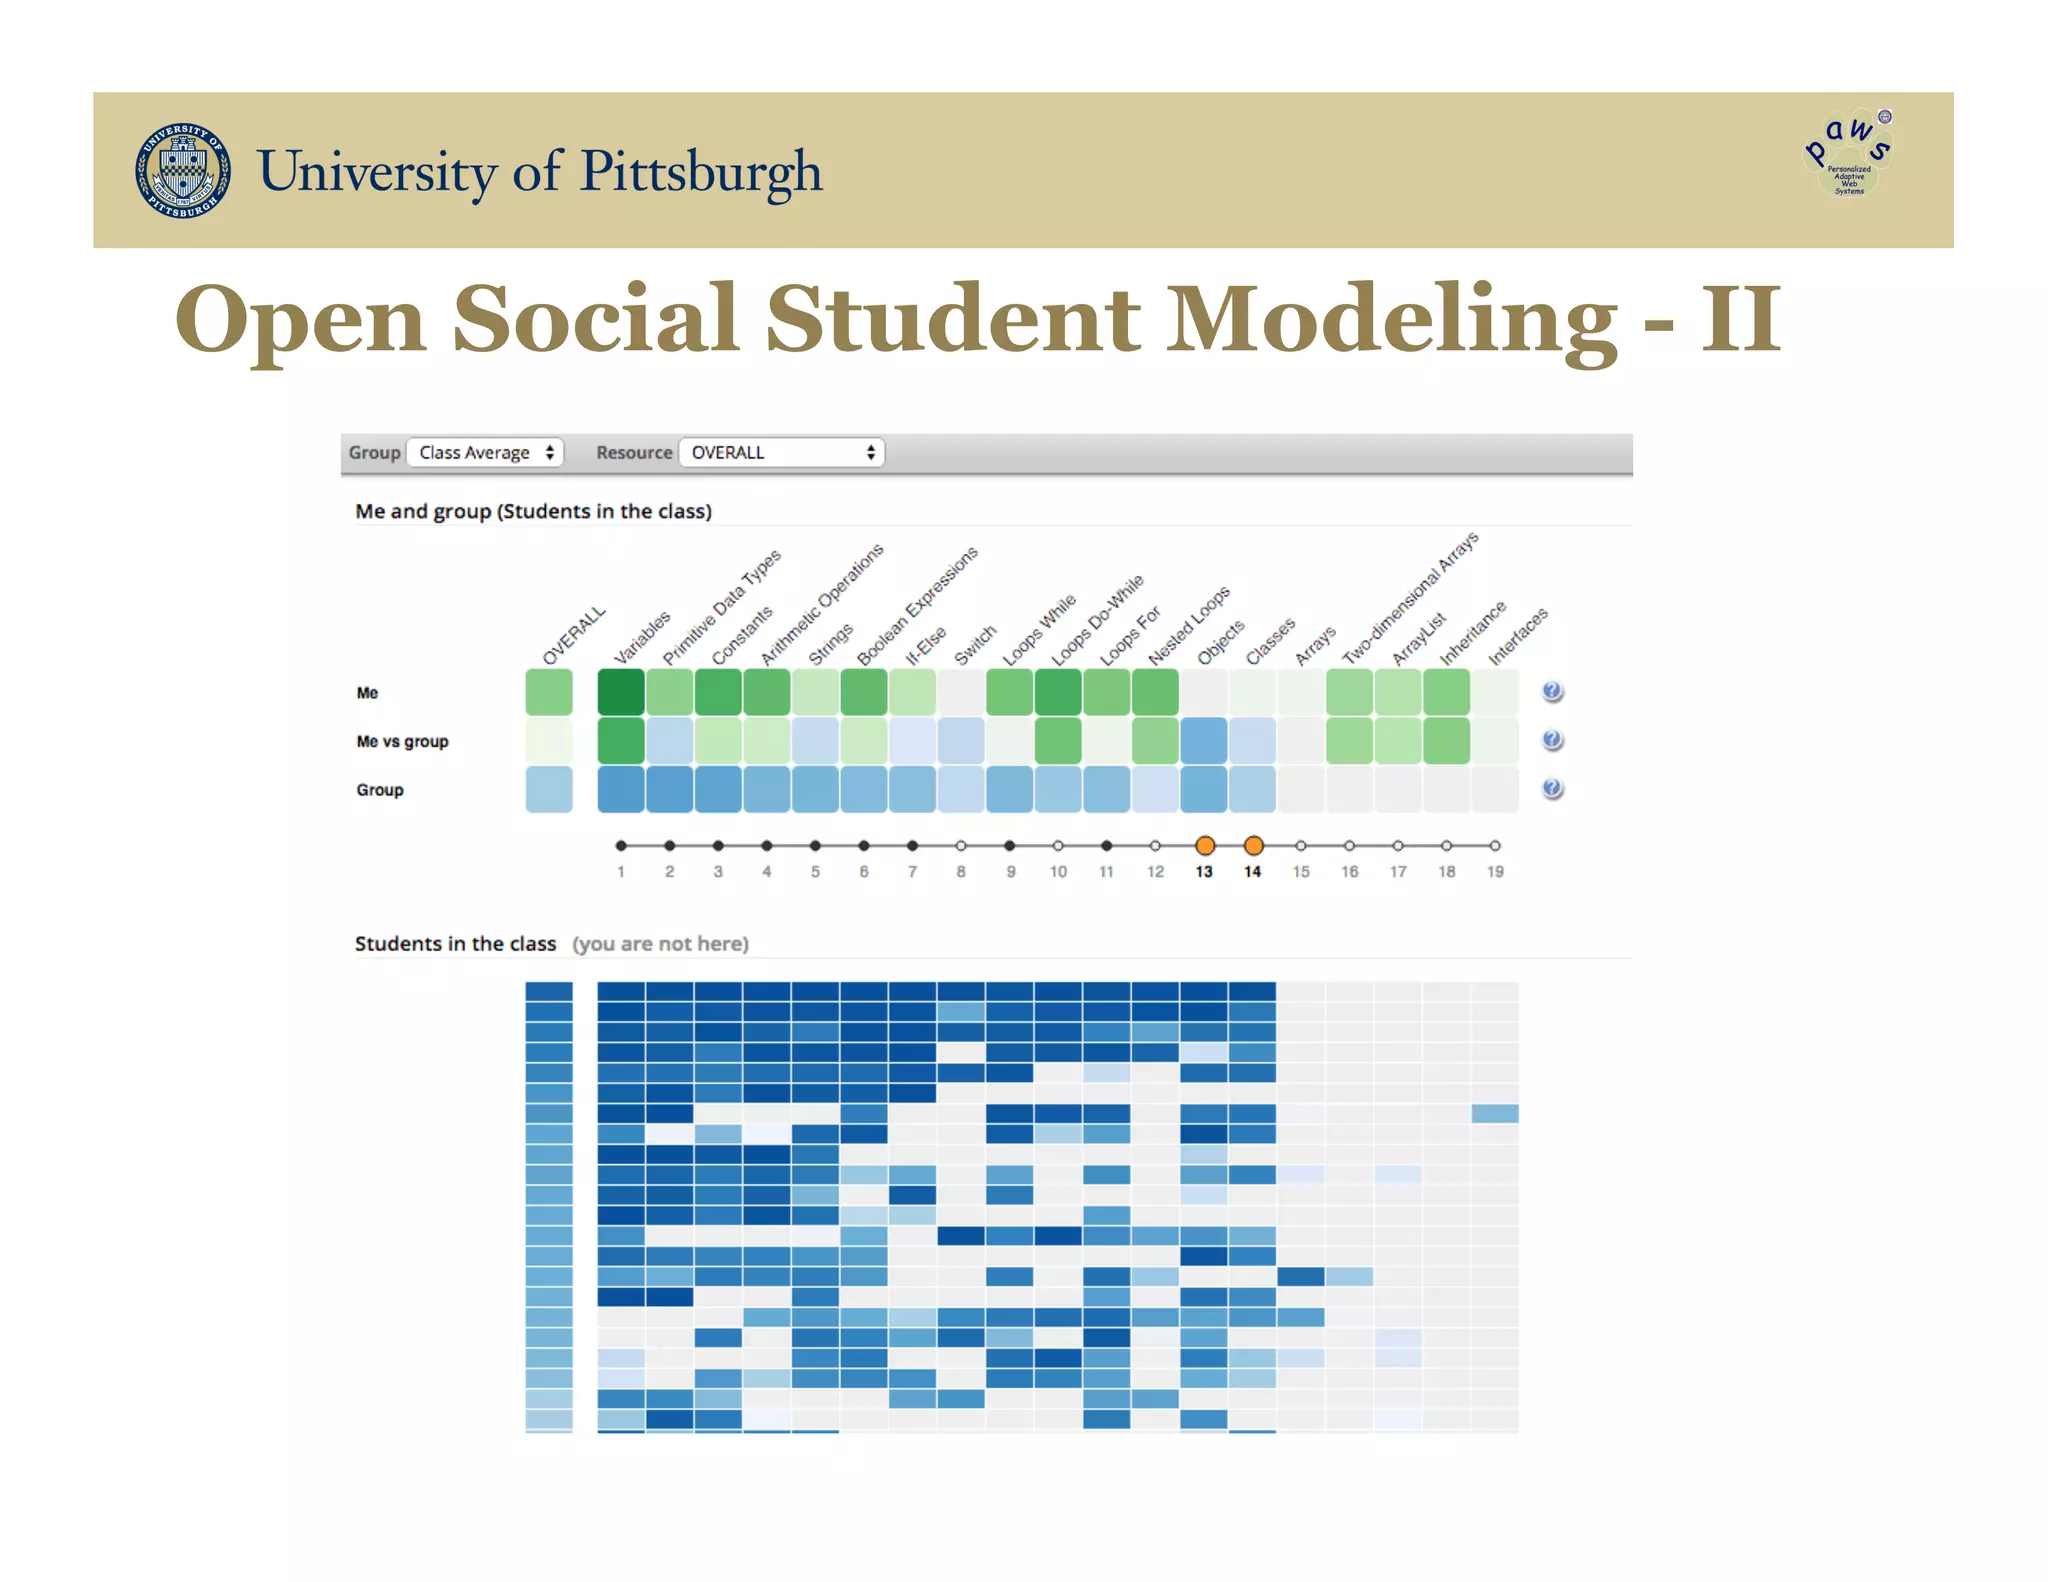
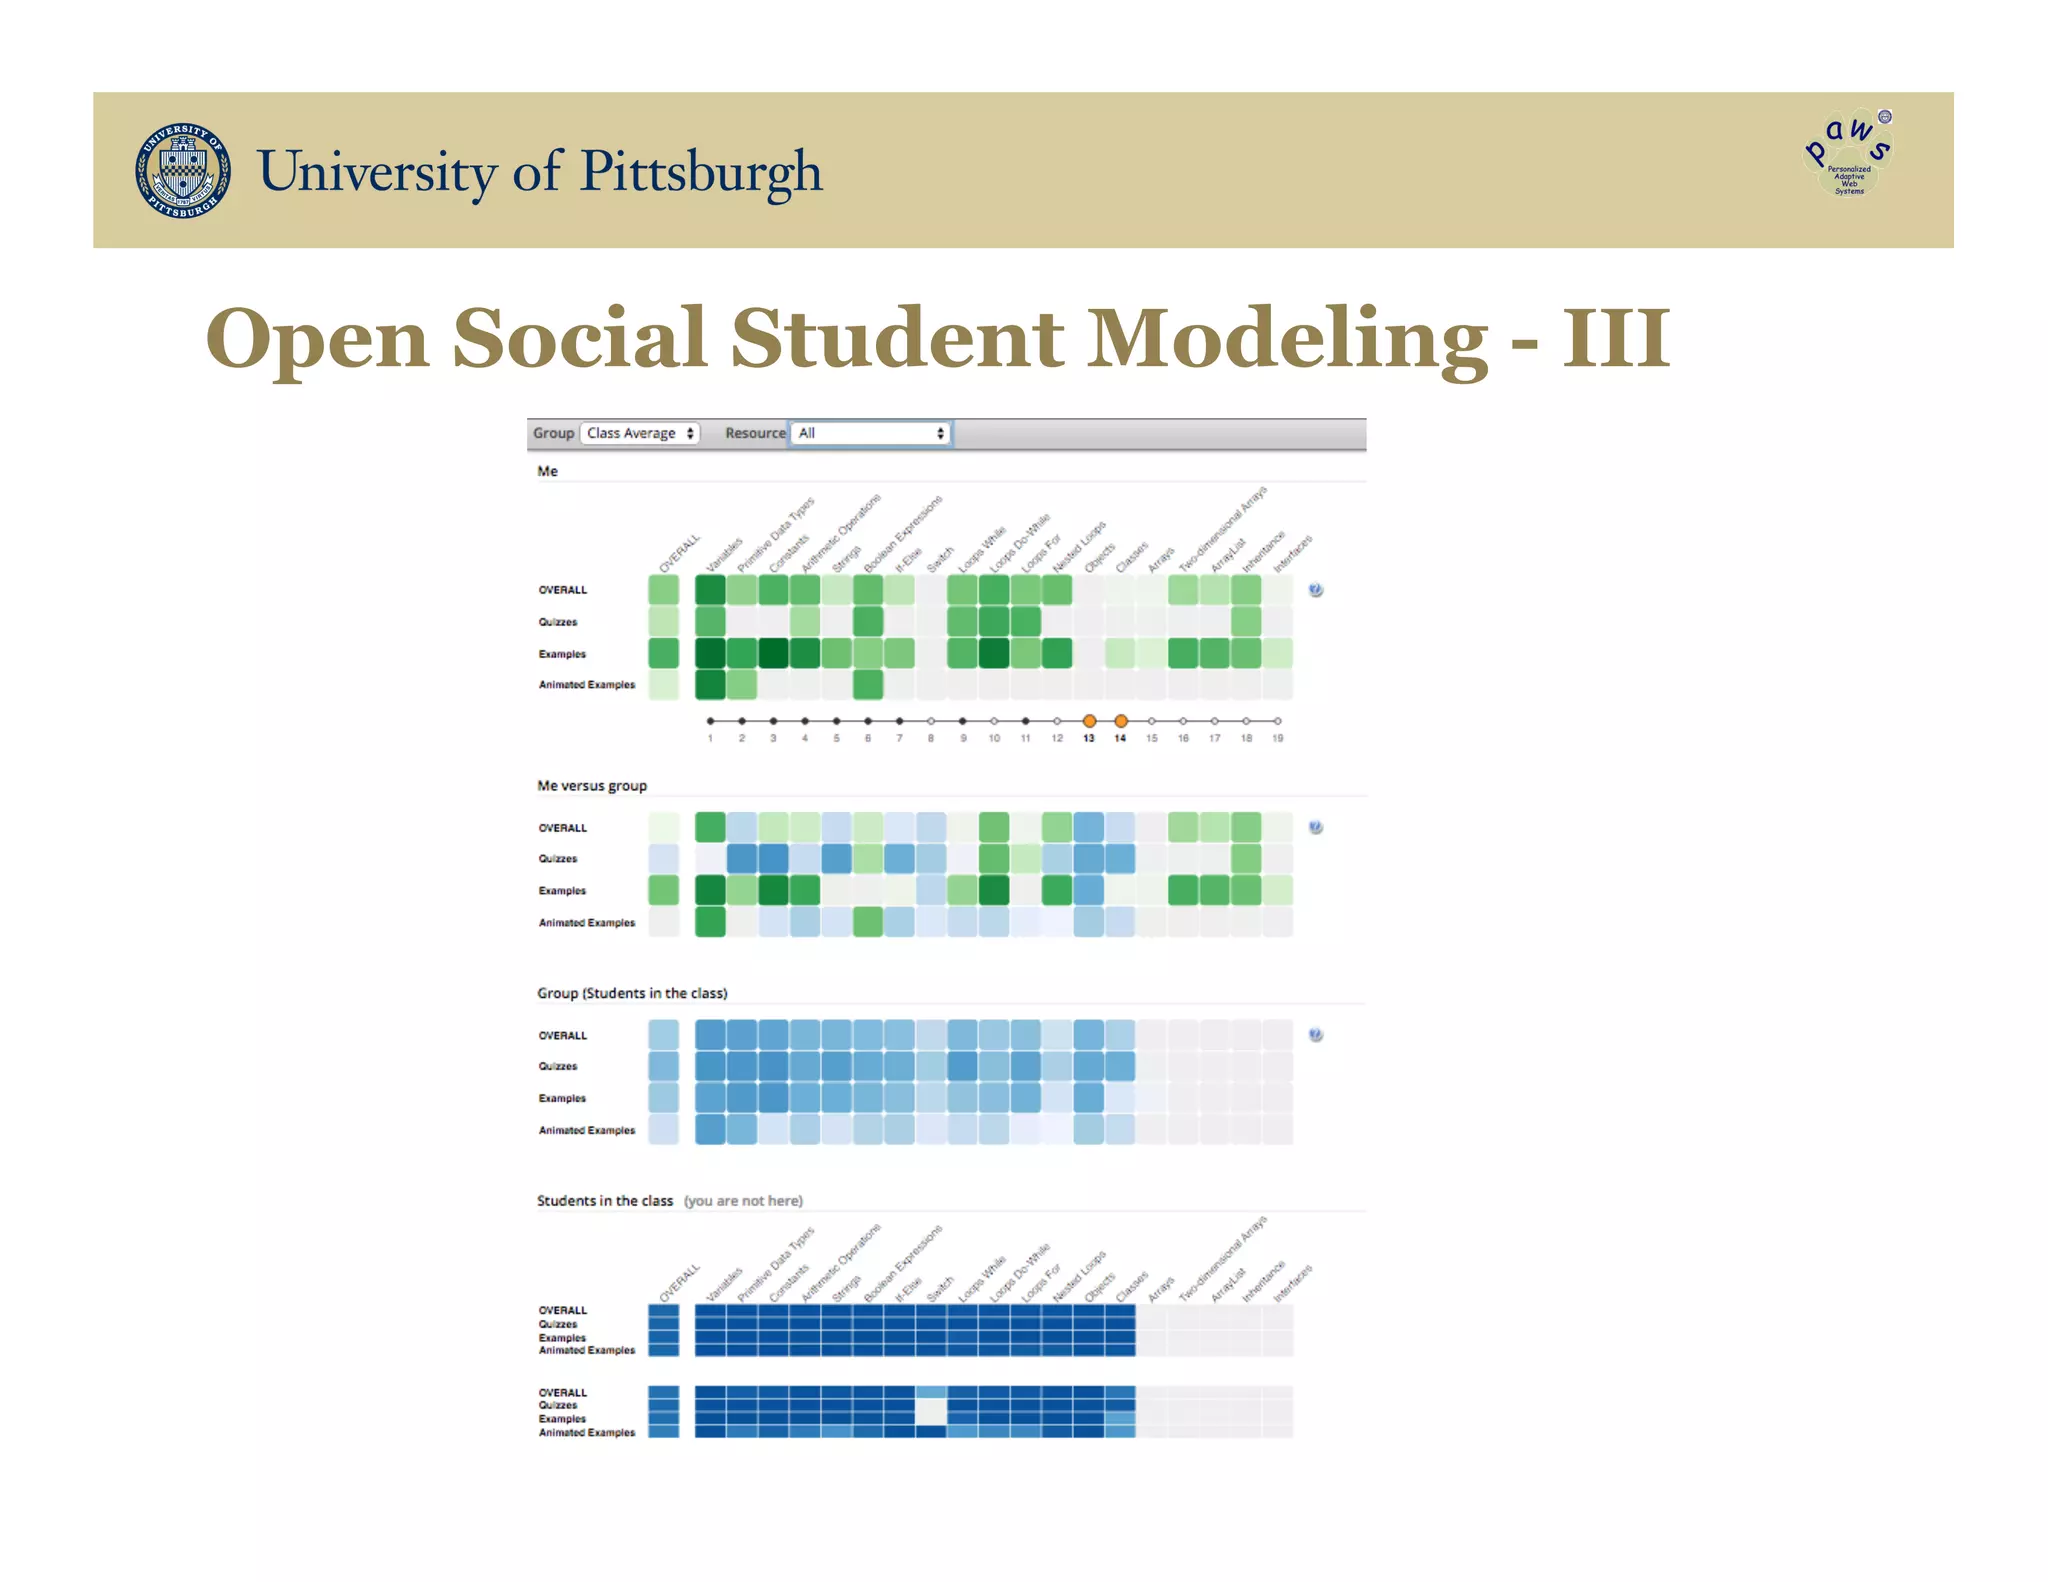


The document discusses data-driven education, focusing on how big educational data can enhance teaching and learning through approaches such as visual learning analytics and educational data mining. It emphasizes the importance of personalized learning experiences, social navigation, and the analysis of student behavior to inform adaptations in educational content and methods. Various studies and models, particularly using open social student modeling and a problem-solving genome, are presented to demonstrate the impact of these techniques on student engagement, retention, and overall learning outcomes.