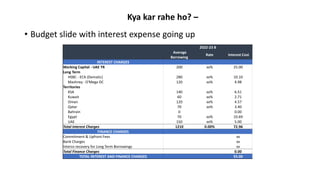
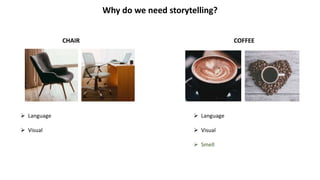
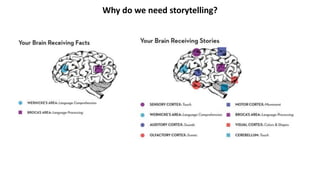
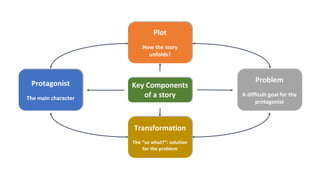
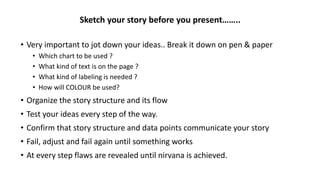
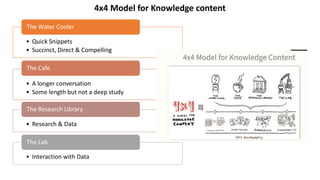
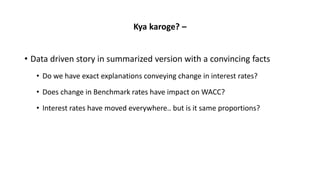
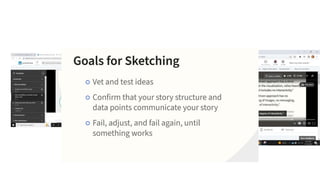
Why do we need storytelling?
CHAIR
 Language
 Visual
COFFEE
 Language
 Visual
 Smell
Why do we need storytelling?
Protagonist
The main character
Problem
A difficult goal for the
protagonist
Plot
How the story
unfolds?
Transformation
The “so what?”: solution
for the problem
Key Components
of a story
• Data stories appear to be most effective when they have constrained
interaction at various checkpoints with a narrative, allowing the user to
explore data without veneering too far from the intended narrative.
• A purely author driven approach has a strict linear path through the
visualization, relies heavily on messaging and includes no interactivity.
• A purely reader driven approach has no prescribed ordering of images, no
messaging a and a high degree of interactivity.
How does data driven storytelling improvise understanding ?
Sketch your story before you present……..
• Very important to jot down your ideas.. Break it down on pen & paper
• Which chart to be used ?
• What kind of text is on the page ?
• What kind of labeling is needed ?
• How will COLOUR be used?
• Organize the story structure and its flow
• Test your ideas every step of the way.
• Confirm that story structure and data points communicate your story
• Fail, adjust and fail again until something works
• At every step flaws are revealed until nirvana is achieved.
4x4 Model for Knowledge content
• Quick Snippets
• Succinct, Direct & Compelling
The Water Cooler
• A longer conversation
• Some length but not a deep study
The Cafe
• Research & Data
The Research Library
• Interaction with Data
The Lab
Story Mechanisms
• Change Over time
• Linear Logic
• Flow Diagram
• Compare & Contrasting
• Progressive Depth- (Martini Glass Structure)
• Personalization- Including personalized element in the dashboard so that listener can
better corelate to situation- Convert your story to his story.
• Text- Data Story conveyed in majority using text with concluding policies/decisions.
Final Touches- How readability is improved ?
• Labeling
• Explains your data, highlight what is important and conveys your story
• Eye Candy
• Keep visually fresh
• Notice important stuff
• Alert to functionality
• Repetition & Redundancy
• Message, data & Visual Cue
• Relatability
• Numbers are understandable, relatable & communicate the impact of the numbers
• Don’t be afraid of Complexity
• Have empathy for your audience
• Focus message, visuals & graphics
• Make the elements as simple as possible
Kya kar rahe ho? –
• Budget slide with interest expense going up
2022-23 B
Average
Borrowing
Rate Interest Cost
INTEREST CHARGES
Working Capital - UAE TR 200 xx% 25.00
Long Term
HSBC - ECA (Dematic) 280 xx% 10.10
Mashreq - O'Mega DC 120 xx% 4.98
Territories
KSA 140 xx% 6.51
Kuwait 60 xx% 2.71
Oman 120 xx% 4.57
Qatar 70 xx% 3.40
Bahrain 0 0.00
Egypt 70 xx% 10.69
UAE 150 xx% 5.00
Total Interest Charges 1210 0.00% 72.96
FINANCE CHARGES
Commitment & Upfront Fees xx
Bank Charges xx
Interco recovery for Long Term Borrowings xx
Total Finance Charges 0.00
TOTAL INTEREST AND FINANCE CHARGES 55.00
Kya karoge? –
• Data driven story in summarized version with a convincing facts
• Do we have exact explanations conveying change in interest rates?
• Does change in Benchmark rates have impact on WACC?
• Interest rates have moved everywhere.. but is it same proportions?
From Linkedin Learning site
for further reference
SCREENSHOTS
Change Over time

Data Driven Storytelling.pptx

  • 1.
    Why do weneed storytelling? CHAIR  Language  Visual COFFEE  Language  Visual  Smell
  • 2.
    Why do weneed storytelling?
  • 3.
    Protagonist The main character Problem Adifficult goal for the protagonist Plot How the story unfolds? Transformation The “so what?”: solution for the problem Key Components of a story
  • 4.
    • Data storiesappear to be most effective when they have constrained interaction at various checkpoints with a narrative, allowing the user to explore data without veneering too far from the intended narrative. • A purely author driven approach has a strict linear path through the visualization, relies heavily on messaging and includes no interactivity. • A purely reader driven approach has no prescribed ordering of images, no messaging a and a high degree of interactivity. How does data driven storytelling improvise understanding ?
  • 5.
    Sketch your storybefore you present…….. • Very important to jot down your ideas.. Break it down on pen & paper • Which chart to be used ? • What kind of text is on the page ? • What kind of labeling is needed ? • How will COLOUR be used? • Organize the story structure and its flow • Test your ideas every step of the way. • Confirm that story structure and data points communicate your story • Fail, adjust and fail again until something works • At every step flaws are revealed until nirvana is achieved.
  • 6.
    4x4 Model forKnowledge content • Quick Snippets • Succinct, Direct & Compelling The Water Cooler • A longer conversation • Some length but not a deep study The Cafe • Research & Data The Research Library • Interaction with Data The Lab
  • 7.
    Story Mechanisms • ChangeOver time • Linear Logic • Flow Diagram • Compare & Contrasting • Progressive Depth- (Martini Glass Structure) • Personalization- Including personalized element in the dashboard so that listener can better corelate to situation- Convert your story to his story. • Text- Data Story conveyed in majority using text with concluding policies/decisions.
  • 8.
    Final Touches- Howreadability is improved ? • Labeling • Explains your data, highlight what is important and conveys your story • Eye Candy • Keep visually fresh • Notice important stuff • Alert to functionality • Repetition & Redundancy • Message, data & Visual Cue • Relatability • Numbers are understandable, relatable & communicate the impact of the numbers • Don’t be afraid of Complexity • Have empathy for your audience • Focus message, visuals & graphics • Make the elements as simple as possible
  • 9.
    Kya kar raheho? – • Budget slide with interest expense going up 2022-23 B Average Borrowing Rate Interest Cost INTEREST CHARGES Working Capital - UAE TR 200 xx% 25.00 Long Term HSBC - ECA (Dematic) 280 xx% 10.10 Mashreq - O'Mega DC 120 xx% 4.98 Territories KSA 140 xx% 6.51 Kuwait 60 xx% 2.71 Oman 120 xx% 4.57 Qatar 70 xx% 3.40 Bahrain 0 0.00 Egypt 70 xx% 10.69 UAE 150 xx% 5.00 Total Interest Charges 1210 0.00% 72.96 FINANCE CHARGES Commitment & Upfront Fees xx Bank Charges xx Interco recovery for Long Term Borrowings xx Total Finance Charges 0.00 TOTAL INTEREST AND FINANCE CHARGES 55.00
  • 10.
    Kya karoge? – •Data driven story in summarized version with a convincing facts • Do we have exact explanations conveying change in interest rates? • Does change in Benchmark rates have impact on WACC? • Interest rates have moved everywhere.. but is it same proportions?
  • 11.
    From Linkedin Learningsite for further reference SCREENSHOTS
  • 15.

Editor's Notes

  • #4 This template was inserted from Power-user, the productivity add-in for PowerPoint, Excel and Word. Install Power-user to access thousands of templates, icons, maps, diagrams and charts with Power-user. Visit https://www.powerusersoftwares.com/ ©Power-user SAS, terms of license: https://www.powerusersoftwares.com/terms