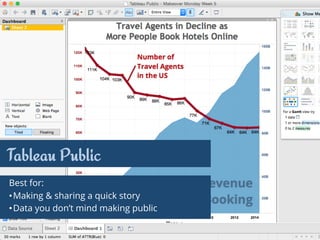
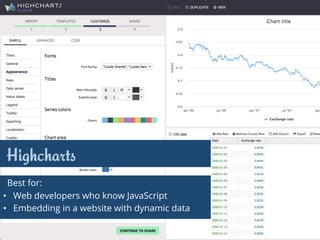
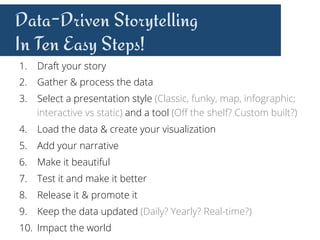
This document discusses using data-driven storytelling to communicate important information and persuade audiences. It explains that storytelling is how humans share knowledge and lessons, while data provides measurable results. Different visualization tools like Tableau, Highcharts and d3.js can help bring data to life in stories. The document then outlines a 10 step process for crafting data-driven stories, which involves planning the narrative, analyzing relevant data, selecting an appropriate presentation style, building visualizations, and promoting and updating the story over time.