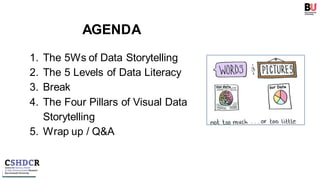
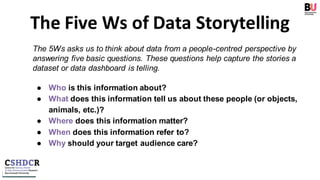
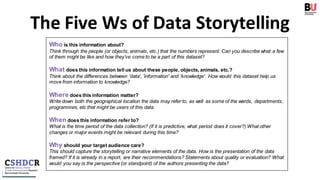
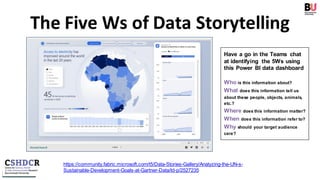
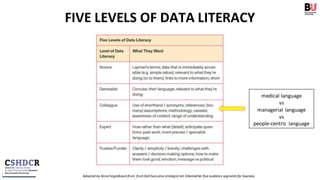
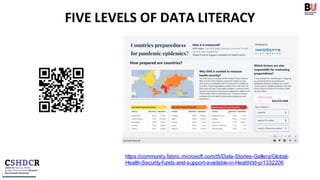
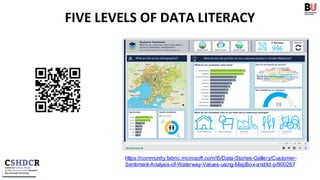
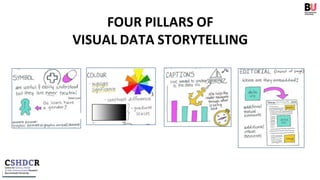
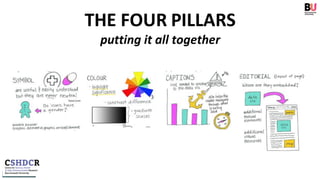
SlideShare a Scribd company logo
Using Audience Insights
and Storytelling to Improve
Data Dashboard Design
Prof Anna Feigenbaum
Professor in Digital Storytelling
Bournemouth University
@drfigtree
@SHDCresearch
*All art in this presentation is by our design
partners Alexandra Alberda and Minute Works
unless otherwise referenced
https://www.routledge.com/The-Data-
Storytelling-Workbook-1st-
Edition/Feigenbaum-
Alamalhodaei/p/book/9781138052116
Discount code until end of year
EFL03
LINK TO REGISTERINTEREST
https://forms.office.com/e/ZXMfEzyi
FURTHER CPD INFO
https://www.bournemouth.ac.uk/bu-
uhd-data-digital-leadership-cpds
BU’s Data & Digital Leadership
CPDs
DATA STORYTELLING - Our Definition
“Data stories are intentional communicative artefacts that
present data in an interesting, evocative, and informative
way…
We are not after the best spin or selling points. Rather, our
aim is to focus on the human elements of what is in a dataset
in order to be able to more clearly pinpoint what is at stake,
and to communicate it effectively and empathetically to our
audiences.”
-Feigenbaum and Alamalhodaei, 2020
Your 3 Biggest Dashboard Design Challenges
Menti link
https://www.menti.com/alis5qqph9xx
The code 8343 0178
(set to follow atyourown pace,you can jump aheador
waituntil the corresponding partof the presentation)
AGENDA
1. The 5Ws of Data Storytelling
2. The 5 Levels of Data Literacy
3. Break
4. The Four Pillars of Visual Data
Storytelling
5. Wrap up / Q&A
The Five Ws of Data Storytelling
The 5Ws asks us to think about data from a people-centred perspective by
answering five basic questions. These questions help capture the stories a
dataset or data dashboard is telling.
● Who is this information about?
● What does this information tell us about these people (or objects,
animals, etc.)?
● Where does this information matter?
● When does this information refer to?
● Why should your target audience care?
The Five Ws of Data Storytelling
Who is this information about?
Think through the people (or objects, animals, etc.) that the numbers represent. Can you describe what a few
of them might be like and how they’ve come to be a part of this dataset?
What does this information tell us about these people, objects, animals, etc.?
Think about the differences between 'data', 'information' and 'knowledge'. How would this dataset help us
move from information to knowledge?
Where does this information matter?
Write down both the geographical location the data may refer to, as well as some of the wards, departments,
programmes, etc that might be users of this data.
When does this information refer to?
What is the time period of the data collection? (If it is predictive, what period does it cover?) What other
changes or major events might be relevant during this time?
Why should your target audience care?
This should capture the storytelling or narrative elements of the data. How is the presentation of the data
framed? If it is already in a report, are their recommendations? Statements about quality or evaluation? What
would you say is the perspective (or standpoint) of the authors presenting the data?
The Five Ws of Data Storytelling
https://community.fabric.microsoft.com/t5/Data-Stories-Gallery/Analyzing-the-UN-s-
Sustainable-Development-Goals-at-Gartner-Data/td-p/2527235
Have a go in the Teams chat
at identifying the 5Ws using
this Power BI data dashboard
Who is this information about?
What does this information tell us
about these people, objects, animals,
etc.?
Where does this information matter?
When does this information refer to?
Why should your target audience
care?
FIVE LEVELS OF DATA LITERACY
Adapted by AnnaFeigenbaumfrom fromDellExecutive strategistJim Stikeleather five audience segments for business
medical language
vs
managerial language
vs
people-centric language
FIVE LEVELS OF DATA LITERACY
https://community.fabric.microsoft.com/t5/Data-Stories-Gallery/Analyzing-the-
UN-s-Sustainable-Development-Goals-at-Gartner-Data/td-p/2527235
FIVE LEVELS OF DATA LITERACY
https://community.fabric.microsoft.com/t5/Data-Stories-Gallery/Global-
Health-Security-funds-and-support-available-in-Health/td-p/1332206
FIVE LEVELS OF DATA LITERACY
https://community.fabric.microsoft.com/t5/Data-Stories-Gallery/Customer-
Sentiment-Analysis-of-Waterway-Values-using-MapBox-and/td-p/900267
Meeting your Audience Halfway
● A good data storyteller needs to know their audience and adjust
accordingly.
● Understanding what each of your audience segments wants in terms of
data complexity and narrative delivery can help you buildyour dashboards
more effectively and efficiently.
● It might be that you need to present the same finding in different ways. As
long as you are clear on the key messages, this kind of tailoring becomes
easier to do over time.
→ What are some methods you already use, or know
about, to help tell data stories to different audiences?
Share in the Teams chat some of the methods you are already using, or are
keen to try out. Some examples include:
-Creating user personas
-Mapping user journeys
-Using ‘ThinkingAloud’ and screen record methods to test real life user
practices
-Creating different tabs for different user groups
-Using drill downs to add layers of narratives/dataaccess
5 Minute Comfort Break
FOUR PILLARS OF
VISUAL DATA STORYTELLING
Symbols should be
resonant and
relevant to your
audiences
SYMBOL
Diabetes Icons
http://www.gettyimages.co.uk/detail/illustration/diabetes-mellitus-icons-royalty-
free-illustration/472802068?esource=SEO_GIS_CDN_Redirect
RESONANT & RELEVANT
Symbols shouldbe resonantand
relevant to your audiences
How do these graphics represent:
-gender?
-race?
-age?
-sickness or disease?
- good and bad behaviour?
SYMBOL
Diabetes Icons
http://www.gettyimages.co.uk/detail/illustration/diabetes-mellitus-icons-royalty-
free-illustration/472802068?esource=SEO_GIS_CDN_Redirect
RESONANT & RELEVANT
https://community.fabric.microsoft.com/t5/Data-Stories-Gallery/Customer-
Sentiment-Analysis-of-Waterway-Values-using-MapBox-and/td-p/900267
COLOR
USING COLOR TO TELL YOUR STORY
Highlight colour
to show significance
Contrast colour
to show difference
Gradiate colour
to show scale
RESONANT & RELEVANT
Thinking about how GRADIENT COLOUR can be used to
HIGHLIGHT and CONTRAST, what is different in these two
dashboards uses of colour?
CAPTIONS
https://community.fabric.microsoft.com/t5/Data-Stories-Gallery/Analyzing-the-UN-s-Sustainable-Development-
Goals-at-Gartner-Data/td-p/2527235
Data visualisations
are ‘polysemic’ –
having many or
multiplepossible
meanings. Captions
work as ‘anchors’
helping to fix the
meaning of an image
in place.
What anchors meaning on this dashboard?
https://community.fabric.microsoft.com/t5/Data-Stories-Gallery/Analyzing-the-
UN-s-Sustainable-Development-Goals-at-Gartner-Data/td-p/2527235
https://community.fabric.microsoft.com/t5/Data-Stories-Gallery/Customer-
Sentiment-Analysis-of-Waterway-Values-using-MapBox-and/td-p/900267
What anchors meaning on this dashboard?
https://community.fabric.microsoft.com/t5/Data-Stories-Gallery/Global-
Health-Security-funds-and-support-available-in-Health/td-p/1332206
EDITORIAL
EDITORIAL
EDITORIAL - NARRATIVE GENRES
Segel andHeer2010
Editorial - What genres?
https://community.fabric.microsoft.com/t5/Data-Stories-
Gallery/Data-analysis-of-fast-food-market/td-p/2617085
Editorial - What genres
https://community.fabric.microsoft.com/t5/Data-Stories-
Gallery/Daily-Habits/td-p/1523525
Editorial - What genres?
https://community.fabric.microsoft.com/t5/Data-Stories-Gallery/NFL-
Fantasy-Football-Player-Comparison-Tool/td-p/241700
THE FOUR PILLARS
putting it all together
Wrap up / Q&A
Thank you for taking part!
Discount code until end of year
EFL03
LINK TO REGISTERINTEREST
https://forms.office.com/e/ZXMfEzyi
FURTHER CPD INFO
https://www.bournemouth.ac.uk/bu-
uhd-data-digital-leadership-cpds
Prof Anna
Feigenbaum
@drfigtree
@SHDCresearc
h

More Related Content

Similar to Data Storytelling for Dashboard Design

Data and information visualization tools 2012
Data and information visualization tools 2012Data and information visualization tools 2012
Data and information visualization tools 2012
Euforic Services
 
Data Visualization Resource Guide (September 2014)
Data Visualization Resource Guide (September 2014)Data Visualization Resource Guide (September 2014)
Data Visualization Resource Guide (September 2014)
Amanda Makulec
 
Importance of Data-Driven Storytelling Data Analysis &amp Visual Narratives.pdf
Importance of Data-Driven Storytelling Data Analysis &amp Visual Narratives.pdfImportance of Data-Driven Storytelling Data Analysis &amp Visual Narratives.pdf
Importance of Data-Driven Storytelling Data Analysis &amp Visual Narratives.pdf
Data Science Council of America
 
Telling Stories with Data_ The Art of Creating Powerful Visuals.docx
Telling Stories with Data_ The Art of Creating Powerful Visuals.docxTelling Stories with Data_ The Art of Creating Powerful Visuals.docx
Telling Stories with Data_ The Art of Creating Powerful Visuals.docx
SannidhiShetty19
 
Telling Stories with Data_ The Art of Creating Powerful Visuals.docx
Telling Stories with Data_ The Art of Creating Powerful Visuals.docxTelling Stories with Data_ The Art of Creating Powerful Visuals.docx
Telling Stories with Data_ The Art of Creating Powerful Visuals.docx
SannidhiShetty19
 
Making Data Meaningful
Making Data MeaningfulMaking Data Meaningful
Making Data Meaningful
JSI
 
Unlocking Answers Faster
Unlocking Answers FasterUnlocking Answers Faster
Unlocking Answers Faster
Infotools
 
Separating Myth from Truth in Data Visualisation
Separating Myth from Truth in Data VisualisationSeparating Myth from Truth in Data Visualisation
Separating Myth from Truth in Data Visualisation
Andy Kirk
 
Principles of data visualisation 2020
Principles of data visualisation 2020Principles of data visualisation 2020
Principles of data visualisation 2020
Marié Roux
 
Introduction to Knowledge Graphs: Data Summit 2020
Introduction to Knowledge Graphs: Data Summit 2020Introduction to Knowledge Graphs: Data Summit 2020
Introduction to Knowledge Graphs: Data Summit 2020
Enterprise Knowledge
 
How to Entertain audiences using data led content - Trend Report Spring 2015
How to Entertain audiences using data led content - Trend Report Spring 2015How to Entertain audiences using data led content - Trend Report Spring 2015
How to Entertain audiences using data led content - Trend Report Spring 2015
infogr8
 
August Designstorm: Alternative Reporting Formats
August Designstorm: Alternative Reporting FormatsAugust Designstorm: Alternative Reporting Formats
August Designstorm: Alternative Reporting Formats
Amanda Makulec
 
Data Driven Marketing: the DNA of customer orientated companies
Data Driven Marketing: the DNA of customer orientated companiesData Driven Marketing: the DNA of customer orientated companies
Data Driven Marketing: the DNA of customer orientated companies
Good Rebels
 
A picture is worth a thousand words_Mathilda Eloff
A picture is worth a thousand words_Mathilda EloffA picture is worth a thousand words_Mathilda Eloff
A picture is worth a thousand words_Mathilda Eloff
Mathilda Eloff
 
3 razones para contar historias...
3 razones para contar historias...3 razones para contar historias...
3 razones para contar historias...
Data IQ Argentina
 
These are topics we have worked in residency week in group project
These are topics we have worked in residency week in group projectThese are topics we have worked in residency week in group project
These are topics we have worked in residency week in group project
chestnutkaitlyn
 
These are topics we have worked in residency week in group project.docx
These are topics we have worked in residency week in group project.docxThese are topics we have worked in residency week in group project.docx
These are topics we have worked in residency week in group project.docx
randymartin91030
 
Analytics & Data Strategy 101 by Deko Dimeski
Analytics & Data Strategy 101 by Deko DimeskiAnalytics & Data Strategy 101 by Deko Dimeski
Analytics & Data Strategy 101 by Deko Dimeski
Deko Dimeski
 
Techniques of Data Visualization for Data & Business Analytics
Techniques of Data Visualization for Data & Business AnalyticsTechniques of Data Visualization for Data & Business Analytics
Techniques of Data Visualization for Data & Business Analytics
Mercy Akinseinde
 
Visual and interactive storytelling slides cmg 2015-final
Visual and interactive storytelling slides    cmg 2015-finalVisual and interactive storytelling slides    cmg 2015-final
Visual and interactive storytelling slides cmg 2015-final
Katherine-CWACanada
 

Similar to Data Storytelling for Dashboard Design (20)

Data and information visualization tools 2012
Data and information visualization tools 2012Data and information visualization tools 2012
Data and information visualization tools 2012
 
Data Visualization Resource Guide (September 2014)
Data Visualization Resource Guide (September 2014)Data Visualization Resource Guide (September 2014)
Data Visualization Resource Guide (September 2014)
 
Importance of Data-Driven Storytelling Data Analysis &amp Visual Narratives.pdf
Importance of Data-Driven Storytelling Data Analysis &amp Visual Narratives.pdfImportance of Data-Driven Storytelling Data Analysis &amp Visual Narratives.pdf
Importance of Data-Driven Storytelling Data Analysis &amp Visual Narratives.pdf
 
Telling Stories with Data_ The Art of Creating Powerful Visuals.docx
Telling Stories with Data_ The Art of Creating Powerful Visuals.docxTelling Stories with Data_ The Art of Creating Powerful Visuals.docx
Telling Stories with Data_ The Art of Creating Powerful Visuals.docx
 
Telling Stories with Data_ The Art of Creating Powerful Visuals.docx
Telling Stories with Data_ The Art of Creating Powerful Visuals.docxTelling Stories with Data_ The Art of Creating Powerful Visuals.docx
Telling Stories with Data_ The Art of Creating Powerful Visuals.docx
 
Making Data Meaningful
Making Data MeaningfulMaking Data Meaningful
Making Data Meaningful
 
Unlocking Answers Faster
Unlocking Answers FasterUnlocking Answers Faster
Unlocking Answers Faster
 
Separating Myth from Truth in Data Visualisation
Separating Myth from Truth in Data VisualisationSeparating Myth from Truth in Data Visualisation
Separating Myth from Truth in Data Visualisation
 
Principles of data visualisation 2020
Principles of data visualisation 2020Principles of data visualisation 2020
Principles of data visualisation 2020
 
Introduction to Knowledge Graphs: Data Summit 2020
Introduction to Knowledge Graphs: Data Summit 2020Introduction to Knowledge Graphs: Data Summit 2020
Introduction to Knowledge Graphs: Data Summit 2020
 
How to Entertain audiences using data led content - Trend Report Spring 2015
How to Entertain audiences using data led content - Trend Report Spring 2015How to Entertain audiences using data led content - Trend Report Spring 2015
How to Entertain audiences using data led content - Trend Report Spring 2015
 
August Designstorm: Alternative Reporting Formats
August Designstorm: Alternative Reporting FormatsAugust Designstorm: Alternative Reporting Formats
August Designstorm: Alternative Reporting Formats
 
Data Driven Marketing: the DNA of customer orientated companies
Data Driven Marketing: the DNA of customer orientated companiesData Driven Marketing: the DNA of customer orientated companies
Data Driven Marketing: the DNA of customer orientated companies
 
A picture is worth a thousand words_Mathilda Eloff
A picture is worth a thousand words_Mathilda EloffA picture is worth a thousand words_Mathilda Eloff
A picture is worth a thousand words_Mathilda Eloff
 
3 razones para contar historias...
3 razones para contar historias...3 razones para contar historias...
3 razones para contar historias...
 
These are topics we have worked in residency week in group project
These are topics we have worked in residency week in group projectThese are topics we have worked in residency week in group project
These are topics we have worked in residency week in group project
 
These are topics we have worked in residency week in group project.docx
These are topics we have worked in residency week in group project.docxThese are topics we have worked in residency week in group project.docx
These are topics we have worked in residency week in group project.docx
 
Analytics & Data Strategy 101 by Deko Dimeski
Analytics & Data Strategy 101 by Deko DimeskiAnalytics & Data Strategy 101 by Deko Dimeski
Analytics & Data Strategy 101 by Deko Dimeski
 
Techniques of Data Visualization for Data & Business Analytics
Techniques of Data Visualization for Data & Business AnalyticsTechniques of Data Visualization for Data & Business Analytics
Techniques of Data Visualization for Data & Business Analytics
 
Visual and interactive storytelling slides cmg 2015-final
Visual and interactive storytelling slides    cmg 2015-finalVisual and interactive storytelling slides    cmg 2015-final
Visual and interactive storytelling slides cmg 2015-final
 

Recently uploaded

Experts live - Improving user adoption with AI
Experts live - Improving user adoption with AIExperts live - Improving user adoption with AI
Experts live - Improving user adoption with AI
jitskeb
 
The Ipsos - AI - Monitor 2024 Report.pdf
The  Ipsos - AI - Monitor 2024 Report.pdfThe  Ipsos - AI - Monitor 2024 Report.pdf
The Ipsos - AI - Monitor 2024 Report.pdf
Social Samosa
 
06-12-2024-BudapestDataForum-BuildingReal-timePipelineswithFLaNK AIM
06-12-2024-BudapestDataForum-BuildingReal-timePipelineswithFLaNK AIM06-12-2024-BudapestDataForum-BuildingReal-timePipelineswithFLaNK AIM
06-12-2024-BudapestDataForum-BuildingReal-timePipelineswithFLaNK AIM
Timothy Spann
 
在线办理(英国UCA毕业证书)创意艺术大学毕业证在读证明一模一样
在线办理(英国UCA毕业证书)创意艺术大学毕业证在读证明一模一样在线办理(英国UCA毕业证书)创意艺术大学毕业证在读证明一模一样
在线办理(英国UCA毕业证书)创意艺术大学毕业证在读证明一模一样
v7oacc3l
 
一比一原版(UCSF文凭证书)旧金山分校毕业证如何办理
一比一原版(UCSF文凭证书)旧金山分校毕业证如何办理一比一原版(UCSF文凭证书)旧金山分校毕业证如何办理
一比一原版(UCSF文凭证书)旧金山分校毕业证如何办理
nuttdpt
 
End-to-end pipeline agility - Berlin Buzzwords 2024
End-to-end pipeline agility - Berlin Buzzwords 2024End-to-end pipeline agility - Berlin Buzzwords 2024
End-to-end pipeline agility - Berlin Buzzwords 2024
Lars Albertsson
 
Everything you wanted to know about LIHTC
Everything you wanted to know about LIHTCEverything you wanted to know about LIHTC
Everything you wanted to know about LIHTC
Roger Valdez
 
STATATHON: Unleashing the Power of Statistics in a 48-Hour Knowledge Extravag...
STATATHON: Unleashing the Power of Statistics in a 48-Hour Knowledge Extravag...STATATHON: Unleashing the Power of Statistics in a 48-Hour Knowledge Extravag...
STATATHON: Unleashing the Power of Statistics in a 48-Hour Knowledge Extravag...
sameer shah
 
Predictably Improve Your B2B Tech Company's Performance by Leveraging Data
Predictably Improve Your B2B Tech Company's Performance by Leveraging DataPredictably Improve Your B2B Tech Company's Performance by Leveraging Data
Predictably Improve Your B2B Tech Company's Performance by Leveraging Data
Kiwi Creative
 
Global Situational Awareness of A.I. and where its headed
Global Situational Awareness of A.I. and where its headedGlobal Situational Awareness of A.I. and where its headed
Global Situational Awareness of A.I. and where its headed
vikram sood
 
DSSML24_tspann_CodelessGenerativeAIPipelines
DSSML24_tspann_CodelessGenerativeAIPipelinesDSSML24_tspann_CodelessGenerativeAIPipelines
DSSML24_tspann_CodelessGenerativeAIPipelines
Timothy Spann
 
一比一原版(UCSB文凭证书)圣芭芭拉分校毕业证如何办理
一比一原版(UCSB文凭证书)圣芭芭拉分校毕业证如何办理一比一原版(UCSB文凭证书)圣芭芭拉分校毕业证如何办理
一比一原版(UCSB文凭证书)圣芭芭拉分校毕业证如何办理
nuttdpt
 
Analysis insight about a Flyball dog competition team's performance
Analysis insight about a Flyball dog competition team's performanceAnalysis insight about a Flyball dog competition team's performance
Analysis insight about a Flyball dog competition team's performance
roli9797
 
Open Source Contributions to Postgres: The Basics POSETTE 2024
Open Source Contributions to Postgres: The Basics POSETTE 2024Open Source Contributions to Postgres: The Basics POSETTE 2024
Open Source Contributions to Postgres: The Basics POSETTE 2024
ElizabethGarrettChri
 
Population Growth in Bataan: The effects of population growth around rural pl...
Population Growth in Bataan: The effects of population growth around rural pl...Population Growth in Bataan: The effects of population growth around rural pl...
Population Growth in Bataan: The effects of population growth around rural pl...
Bill641377
 
ViewShift: Hassle-free Dynamic Policy Enforcement for Every Data Lake
ViewShift: Hassle-free Dynamic Policy Enforcement for Every Data LakeViewShift: Hassle-free Dynamic Policy Enforcement for Every Data Lake
ViewShift: Hassle-free Dynamic Policy Enforcement for Every Data Lake
Walaa Eldin Moustafa
 
一比一原版(UO毕业证)渥太华大学毕业证如何办理
一比一原版(UO毕业证)渥太华大学毕业证如何办理一比一原版(UO毕业证)渥太华大学毕业证如何办理
一比一原版(UO毕业证)渥太华大学毕业证如何办理
aqzctr7x
 
一比一原版(UMN文凭证书)明尼苏达大学毕业证如何办理
一比一原版(UMN文凭证书)明尼苏达大学毕业证如何办理一比一原版(UMN文凭证书)明尼苏达大学毕业证如何办理
一比一原版(UMN文凭证书)明尼苏达大学毕业证如何办理
nyfuhyz
 
原版一比一利兹贝克特大学毕业证(LeedsBeckett毕业证书)如何办理
原版一比一利兹贝克特大学毕业证(LeedsBeckett毕业证书)如何办理原版一比一利兹贝克特大学毕业证(LeedsBeckett毕业证书)如何办理
原版一比一利兹贝克特大学毕业证(LeedsBeckett毕业证书)如何办理
wyddcwye1
 
4th Modern Marketing Reckoner by MMA Global India & Group M: 60+ experts on W...
4th Modern Marketing Reckoner by MMA Global India & Group M: 60+ experts on W...4th Modern Marketing Reckoner by MMA Global India & Group M: 60+ experts on W...
4th Modern Marketing Reckoner by MMA Global India & Group M: 60+ experts on W...
Social Samosa
 

Recently uploaded (20)

Experts live - Improving user adoption with AI
Experts live - Improving user adoption with AIExperts live - Improving user adoption with AI
Experts live - Improving user adoption with AI
 
The Ipsos - AI - Monitor 2024 Report.pdf
The  Ipsos - AI - Monitor 2024 Report.pdfThe  Ipsos - AI - Monitor 2024 Report.pdf
The Ipsos - AI - Monitor 2024 Report.pdf
 
06-12-2024-BudapestDataForum-BuildingReal-timePipelineswithFLaNK AIM
06-12-2024-BudapestDataForum-BuildingReal-timePipelineswithFLaNK AIM06-12-2024-BudapestDataForum-BuildingReal-timePipelineswithFLaNK AIM
06-12-2024-BudapestDataForum-BuildingReal-timePipelineswithFLaNK AIM
 
在线办理(英国UCA毕业证书)创意艺术大学毕业证在读证明一模一样
在线办理(英国UCA毕业证书)创意艺术大学毕业证在读证明一模一样在线办理(英国UCA毕业证书)创意艺术大学毕业证在读证明一模一样
在线办理(英国UCA毕业证书)创意艺术大学毕业证在读证明一模一样
 
一比一原版(UCSF文凭证书)旧金山分校毕业证如何办理
一比一原版(UCSF文凭证书)旧金山分校毕业证如何办理一比一原版(UCSF文凭证书)旧金山分校毕业证如何办理
一比一原版(UCSF文凭证书)旧金山分校毕业证如何办理
 
End-to-end pipeline agility - Berlin Buzzwords 2024
End-to-end pipeline agility - Berlin Buzzwords 2024End-to-end pipeline agility - Berlin Buzzwords 2024
End-to-end pipeline agility - Berlin Buzzwords 2024
 
Everything you wanted to know about LIHTC
Everything you wanted to know about LIHTCEverything you wanted to know about LIHTC
Everything you wanted to know about LIHTC
 
STATATHON: Unleashing the Power of Statistics in a 48-Hour Knowledge Extravag...
STATATHON: Unleashing the Power of Statistics in a 48-Hour Knowledge Extravag...STATATHON: Unleashing the Power of Statistics in a 48-Hour Knowledge Extravag...
STATATHON: Unleashing the Power of Statistics in a 48-Hour Knowledge Extravag...
 
Predictably Improve Your B2B Tech Company's Performance by Leveraging Data
Predictably Improve Your B2B Tech Company's Performance by Leveraging DataPredictably Improve Your B2B Tech Company's Performance by Leveraging Data
Predictably Improve Your B2B Tech Company's Performance by Leveraging Data
 
Global Situational Awareness of A.I. and where its headed
Global Situational Awareness of A.I. and where its headedGlobal Situational Awareness of A.I. and where its headed
Global Situational Awareness of A.I. and where its headed
 
DSSML24_tspann_CodelessGenerativeAIPipelines
DSSML24_tspann_CodelessGenerativeAIPipelinesDSSML24_tspann_CodelessGenerativeAIPipelines
DSSML24_tspann_CodelessGenerativeAIPipelines
 
一比一原版(UCSB文凭证书)圣芭芭拉分校毕业证如何办理
一比一原版(UCSB文凭证书)圣芭芭拉分校毕业证如何办理一比一原版(UCSB文凭证书)圣芭芭拉分校毕业证如何办理
一比一原版(UCSB文凭证书)圣芭芭拉分校毕业证如何办理
 
Analysis insight about a Flyball dog competition team's performance
Analysis insight about a Flyball dog competition team's performanceAnalysis insight about a Flyball dog competition team's performance
Analysis insight about a Flyball dog competition team's performance
 
Open Source Contributions to Postgres: The Basics POSETTE 2024
Open Source Contributions to Postgres: The Basics POSETTE 2024Open Source Contributions to Postgres: The Basics POSETTE 2024
Open Source Contributions to Postgres: The Basics POSETTE 2024
 
Population Growth in Bataan: The effects of population growth around rural pl...
Population Growth in Bataan: The effects of population growth around rural pl...Population Growth in Bataan: The effects of population growth around rural pl...
Population Growth in Bataan: The effects of population growth around rural pl...
 
ViewShift: Hassle-free Dynamic Policy Enforcement for Every Data Lake
ViewShift: Hassle-free Dynamic Policy Enforcement for Every Data LakeViewShift: Hassle-free Dynamic Policy Enforcement for Every Data Lake
ViewShift: Hassle-free Dynamic Policy Enforcement for Every Data Lake
 
一比一原版(UO毕业证)渥太华大学毕业证如何办理
一比一原版(UO毕业证)渥太华大学毕业证如何办理一比一原版(UO毕业证)渥太华大学毕业证如何办理
一比一原版(UO毕业证)渥太华大学毕业证如何办理
 
一比一原版(UMN文凭证书)明尼苏达大学毕业证如何办理
一比一原版(UMN文凭证书)明尼苏达大学毕业证如何办理一比一原版(UMN文凭证书)明尼苏达大学毕业证如何办理
一比一原版(UMN文凭证书)明尼苏达大学毕业证如何办理
 
原版一比一利兹贝克特大学毕业证(LeedsBeckett毕业证书)如何办理
原版一比一利兹贝克特大学毕业证(LeedsBeckett毕业证书)如何办理原版一比一利兹贝克特大学毕业证(LeedsBeckett毕业证书)如何办理
原版一比一利兹贝克特大学毕业证(LeedsBeckett毕业证书)如何办理
 
4th Modern Marketing Reckoner by MMA Global India & Group M: 60+ experts on W...
4th Modern Marketing Reckoner by MMA Global India & Group M: 60+ experts on W...4th Modern Marketing Reckoner by MMA Global India & Group M: 60+ experts on W...
4th Modern Marketing Reckoner by MMA Global India & Group M: 60+ experts on W...
 

Data Storytelling for Dashboard Design

  • 1. Using Audience Insights and Storytelling to Improve Data Dashboard Design Prof Anna Feigenbaum Professor in Digital Storytelling Bournemouth University @drfigtree @SHDCresearch *All art in this presentation is by our design partners Alexandra Alberda and Minute Works unless otherwise referenced
  • 3. LINK TO REGISTERINTEREST https://forms.office.com/e/ZXMfEzyi FURTHER CPD INFO https://www.bournemouth.ac.uk/bu- uhd-data-digital-leadership-cpds BU’s Data & Digital Leadership CPDs
  • 4. DATA STORYTELLING - Our Definition “Data stories are intentional communicative artefacts that present data in an interesting, evocative, and informative way… We are not after the best spin or selling points. Rather, our aim is to focus on the human elements of what is in a dataset in order to be able to more clearly pinpoint what is at stake, and to communicate it effectively and empathetically to our audiences.” -Feigenbaum and Alamalhodaei, 2020
  • 5. Your 3 Biggest Dashboard Design Challenges Menti link https://www.menti.com/alis5qqph9xx The code 8343 0178 (set to follow atyourown pace,you can jump aheador waituntil the corresponding partof the presentation)
  • 6. AGENDA 1. The 5Ws of Data Storytelling 2. The 5 Levels of Data Literacy 3. Break 4. The Four Pillars of Visual Data Storytelling 5. Wrap up / Q&A
  • 7. The Five Ws of Data Storytelling The 5Ws asks us to think about data from a people-centred perspective by answering five basic questions. These questions help capture the stories a dataset or data dashboard is telling. ● Who is this information about? ● What does this information tell us about these people (or objects, animals, etc.)? ● Where does this information matter? ● When does this information refer to? ● Why should your target audience care?
  • 8. The Five Ws of Data Storytelling Who is this information about? Think through the people (or objects, animals, etc.) that the numbers represent. Can you describe what a few of them might be like and how they’ve come to be a part of this dataset? What does this information tell us about these people, objects, animals, etc.? Think about the differences between 'data', 'information' and 'knowledge'. How would this dataset help us move from information to knowledge? Where does this information matter? Write down both the geographical location the data may refer to, as well as some of the wards, departments, programmes, etc that might be users of this data. When does this information refer to? What is the time period of the data collection? (If it is predictive, what period does it cover?) What other changes or major events might be relevant during this time? Why should your target audience care? This should capture the storytelling or narrative elements of the data. How is the presentation of the data framed? If it is already in a report, are their recommendations? Statements about quality or evaluation? What would you say is the perspective (or standpoint) of the authors presenting the data?
  • 9. The Five Ws of Data Storytelling https://community.fabric.microsoft.com/t5/Data-Stories-Gallery/Analyzing-the-UN-s- Sustainable-Development-Goals-at-Gartner-Data/td-p/2527235 Have a go in the Teams chat at identifying the 5Ws using this Power BI data dashboard Who is this information about? What does this information tell us about these people, objects, animals, etc.? Where does this information matter? When does this information refer to? Why should your target audience care?
  • 10. FIVE LEVELS OF DATA LITERACY Adapted by AnnaFeigenbaumfrom fromDellExecutive strategistJim Stikeleather five audience segments for business medical language vs managerial language vs people-centric language
  • 11. FIVE LEVELS OF DATA LITERACY https://community.fabric.microsoft.com/t5/Data-Stories-Gallery/Analyzing-the- UN-s-Sustainable-Development-Goals-at-Gartner-Data/td-p/2527235
  • 12. FIVE LEVELS OF DATA LITERACY https://community.fabric.microsoft.com/t5/Data-Stories-Gallery/Global- Health-Security-funds-and-support-available-in-Health/td-p/1332206
  • 13. FIVE LEVELS OF DATA LITERACY https://community.fabric.microsoft.com/t5/Data-Stories-Gallery/Customer- Sentiment-Analysis-of-Waterway-Values-using-MapBox-and/td-p/900267
  • 14. Meeting your Audience Halfway ● A good data storyteller needs to know their audience and adjust accordingly. ● Understanding what each of your audience segments wants in terms of data complexity and narrative delivery can help you buildyour dashboards more effectively and efficiently. ● It might be that you need to present the same finding in different ways. As long as you are clear on the key messages, this kind of tailoring becomes easier to do over time.
  • 15. → What are some methods you already use, or know about, to help tell data stories to different audiences? Share in the Teams chat some of the methods you are already using, or are keen to try out. Some examples include: -Creating user personas -Mapping user journeys -Using ‘ThinkingAloud’ and screen record methods to test real life user practices -Creating different tabs for different user groups -Using drill downs to add layers of narratives/dataaccess
  • 17. FOUR PILLARS OF VISUAL DATA STORYTELLING
  • 18. Symbols should be resonant and relevant to your audiences SYMBOL Diabetes Icons http://www.gettyimages.co.uk/detail/illustration/diabetes-mellitus-icons-royalty- free-illustration/472802068?esource=SEO_GIS_CDN_Redirect
  • 20. Symbols shouldbe resonantand relevant to your audiences How do these graphics represent: -gender? -race? -age? -sickness or disease? - good and bad behaviour? SYMBOL Diabetes Icons http://www.gettyimages.co.uk/detail/illustration/diabetes-mellitus-icons-royalty- free-illustration/472802068?esource=SEO_GIS_CDN_Redirect
  • 22. COLOR
  • 23. USING COLOR TO TELL YOUR STORY Highlight colour to show significance Contrast colour to show difference Gradiate colour to show scale
  • 25. Thinking about how GRADIENT COLOUR can be used to HIGHLIGHT and CONTRAST, what is different in these two dashboards uses of colour?
  • 26. CAPTIONS https://community.fabric.microsoft.com/t5/Data-Stories-Gallery/Analyzing-the-UN-s-Sustainable-Development- Goals-at-Gartner-Data/td-p/2527235 Data visualisations are ‘polysemic’ – having many or multiplepossible meanings. Captions work as ‘anchors’ helping to fix the meaning of an image in place.
  • 27. What anchors meaning on this dashboard? https://community.fabric.microsoft.com/t5/Data-Stories-Gallery/Analyzing-the- UN-s-Sustainable-Development-Goals-at-Gartner-Data/td-p/2527235
  • 29. What anchors meaning on this dashboard? https://community.fabric.microsoft.com/t5/Data-Stories-Gallery/Global- Health-Security-funds-and-support-available-in-Health/td-p/1332206
  • 32. EDITORIAL - NARRATIVE GENRES Segel andHeer2010
  • 33. Editorial - What genres? https://community.fabric.microsoft.com/t5/Data-Stories- Gallery/Data-analysis-of-fast-food-market/td-p/2617085
  • 34. Editorial - What genres https://community.fabric.microsoft.com/t5/Data-Stories- Gallery/Daily-Habits/td-p/1523525
  • 35. Editorial - What genres? https://community.fabric.microsoft.com/t5/Data-Stories-Gallery/NFL- Fantasy-Football-Player-Comparison-Tool/td-p/241700
  • 36. THE FOUR PILLARS putting it all together
  • 37. Wrap up / Q&A Thank you for taking part!
  • 38. Discount code until end of year EFL03 LINK TO REGISTERINTEREST https://forms.office.com/e/ZXMfEzyi FURTHER CPD INFO https://www.bournemouth.ac.uk/bu- uhd-data-digital-leadership-cpds Prof Anna Feigenbaum @drfigtree @SHDCresearc h