Downloaded 65 times


The document outlines the four types of business analytics: descriptive, diagnostic, predictive, and prescriptive analytics, detailing their processes, techniques, applications, and advantages and disadvantages. Descriptive analytics focuses on understanding historical data, while diagnostic analytics identifies causes of trends, predictive analytics forecasts future outcomes, and prescriptive analytics recommends actions to achieve desired results. Each type serves distinct purposes in decision-making and requires specific methodologies and tools.
Overview of business analytics and its four main types: Descriptive, Diagnostic, Predictive, and Prescriptive analytics.
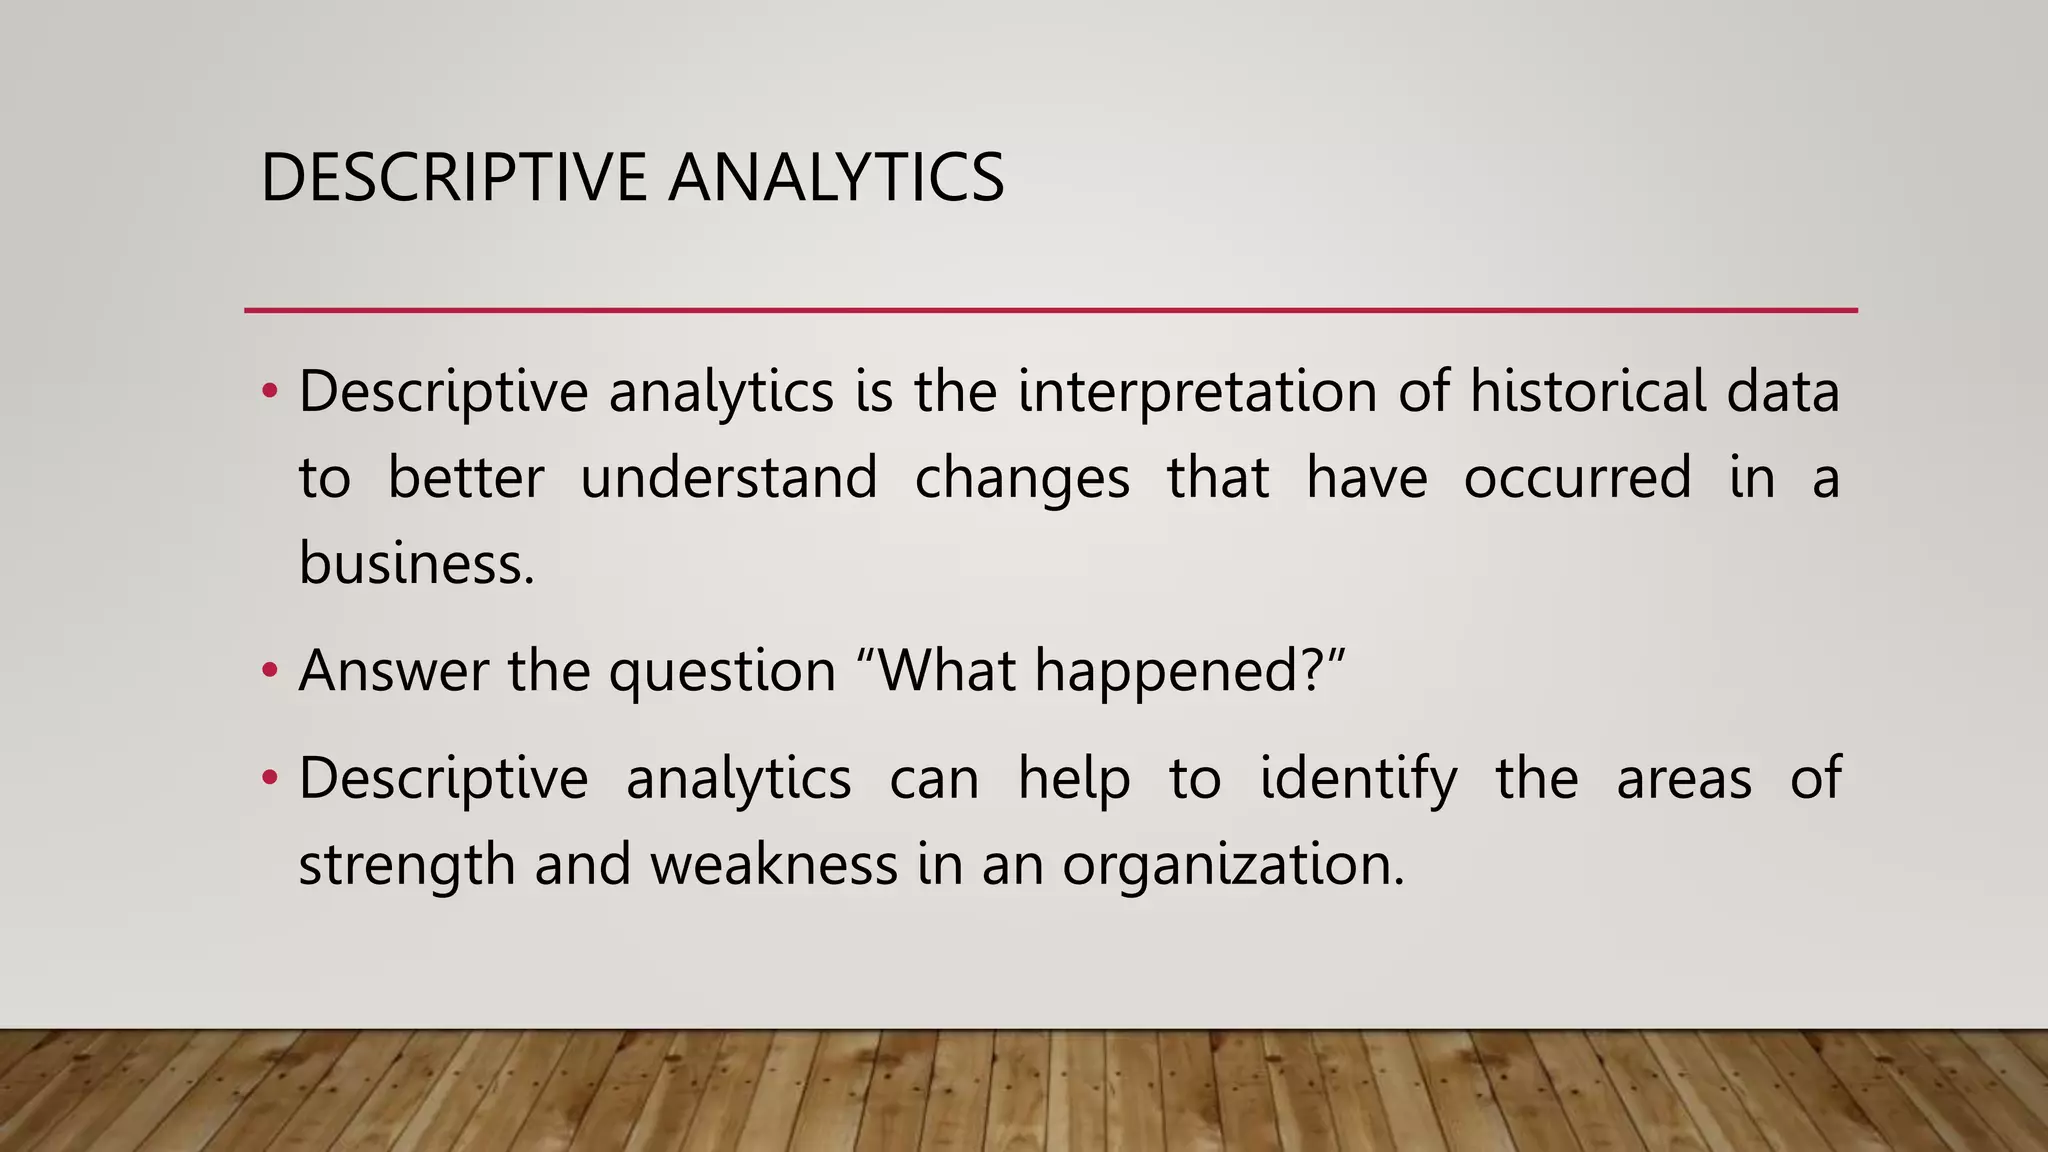
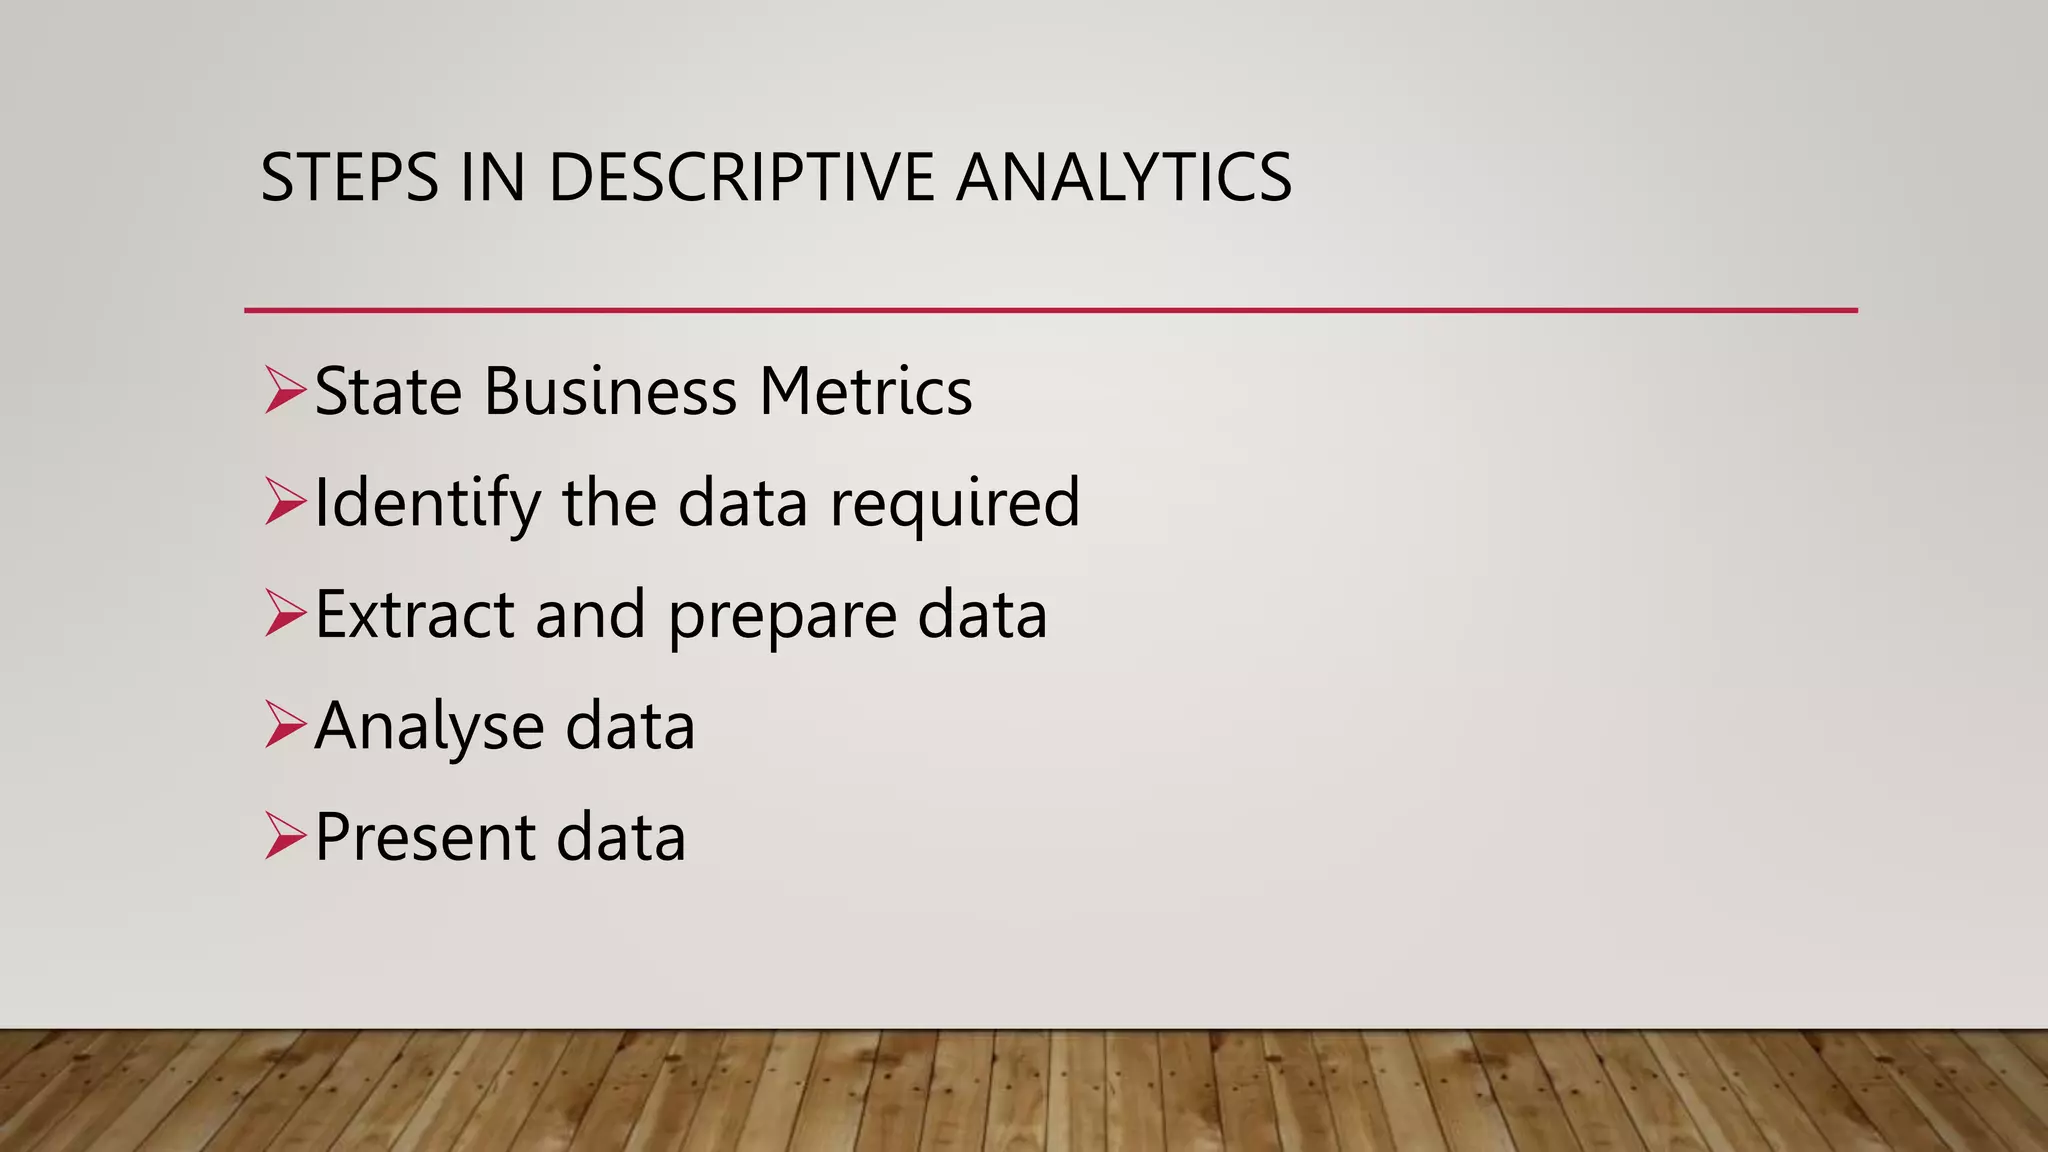
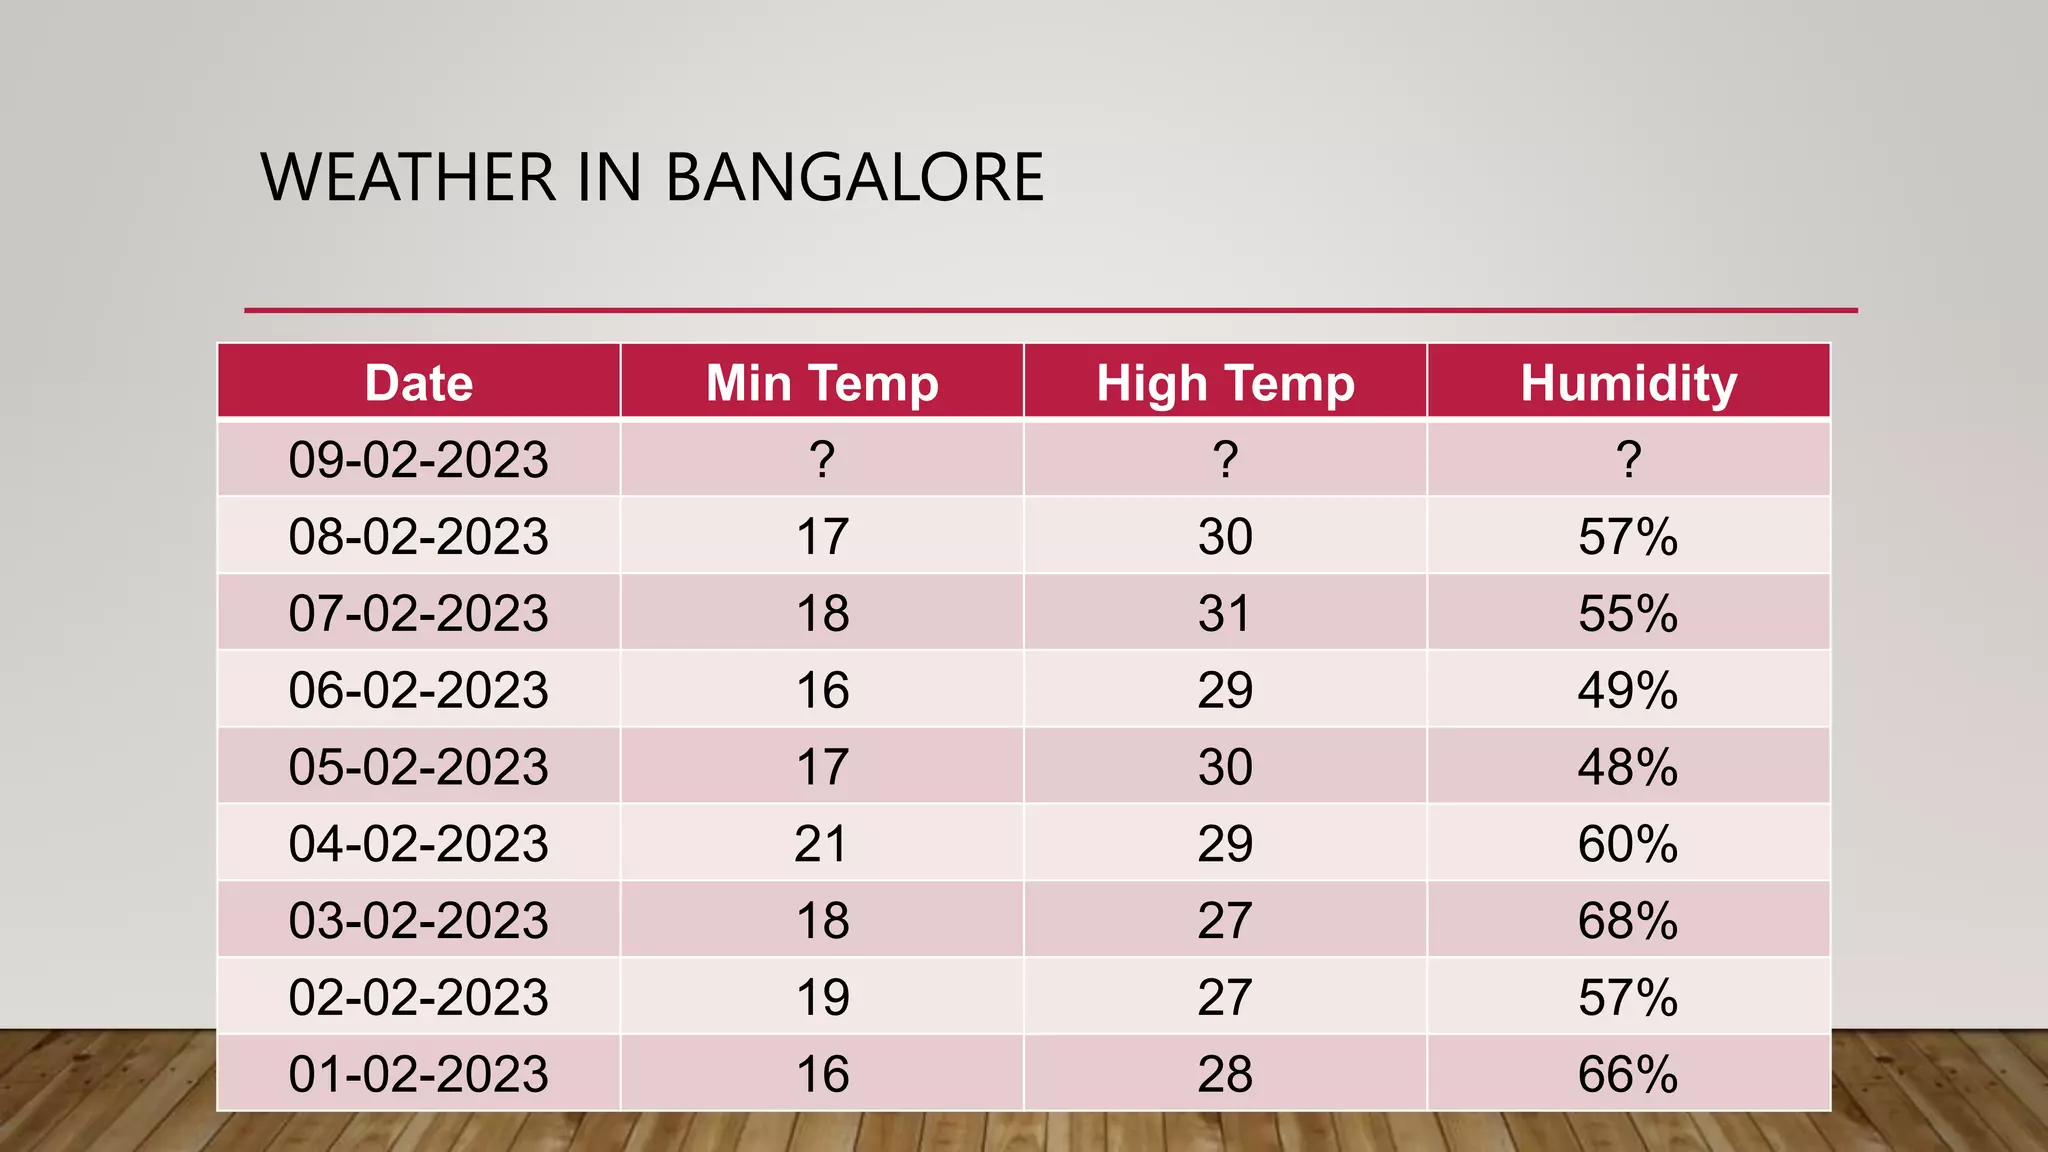
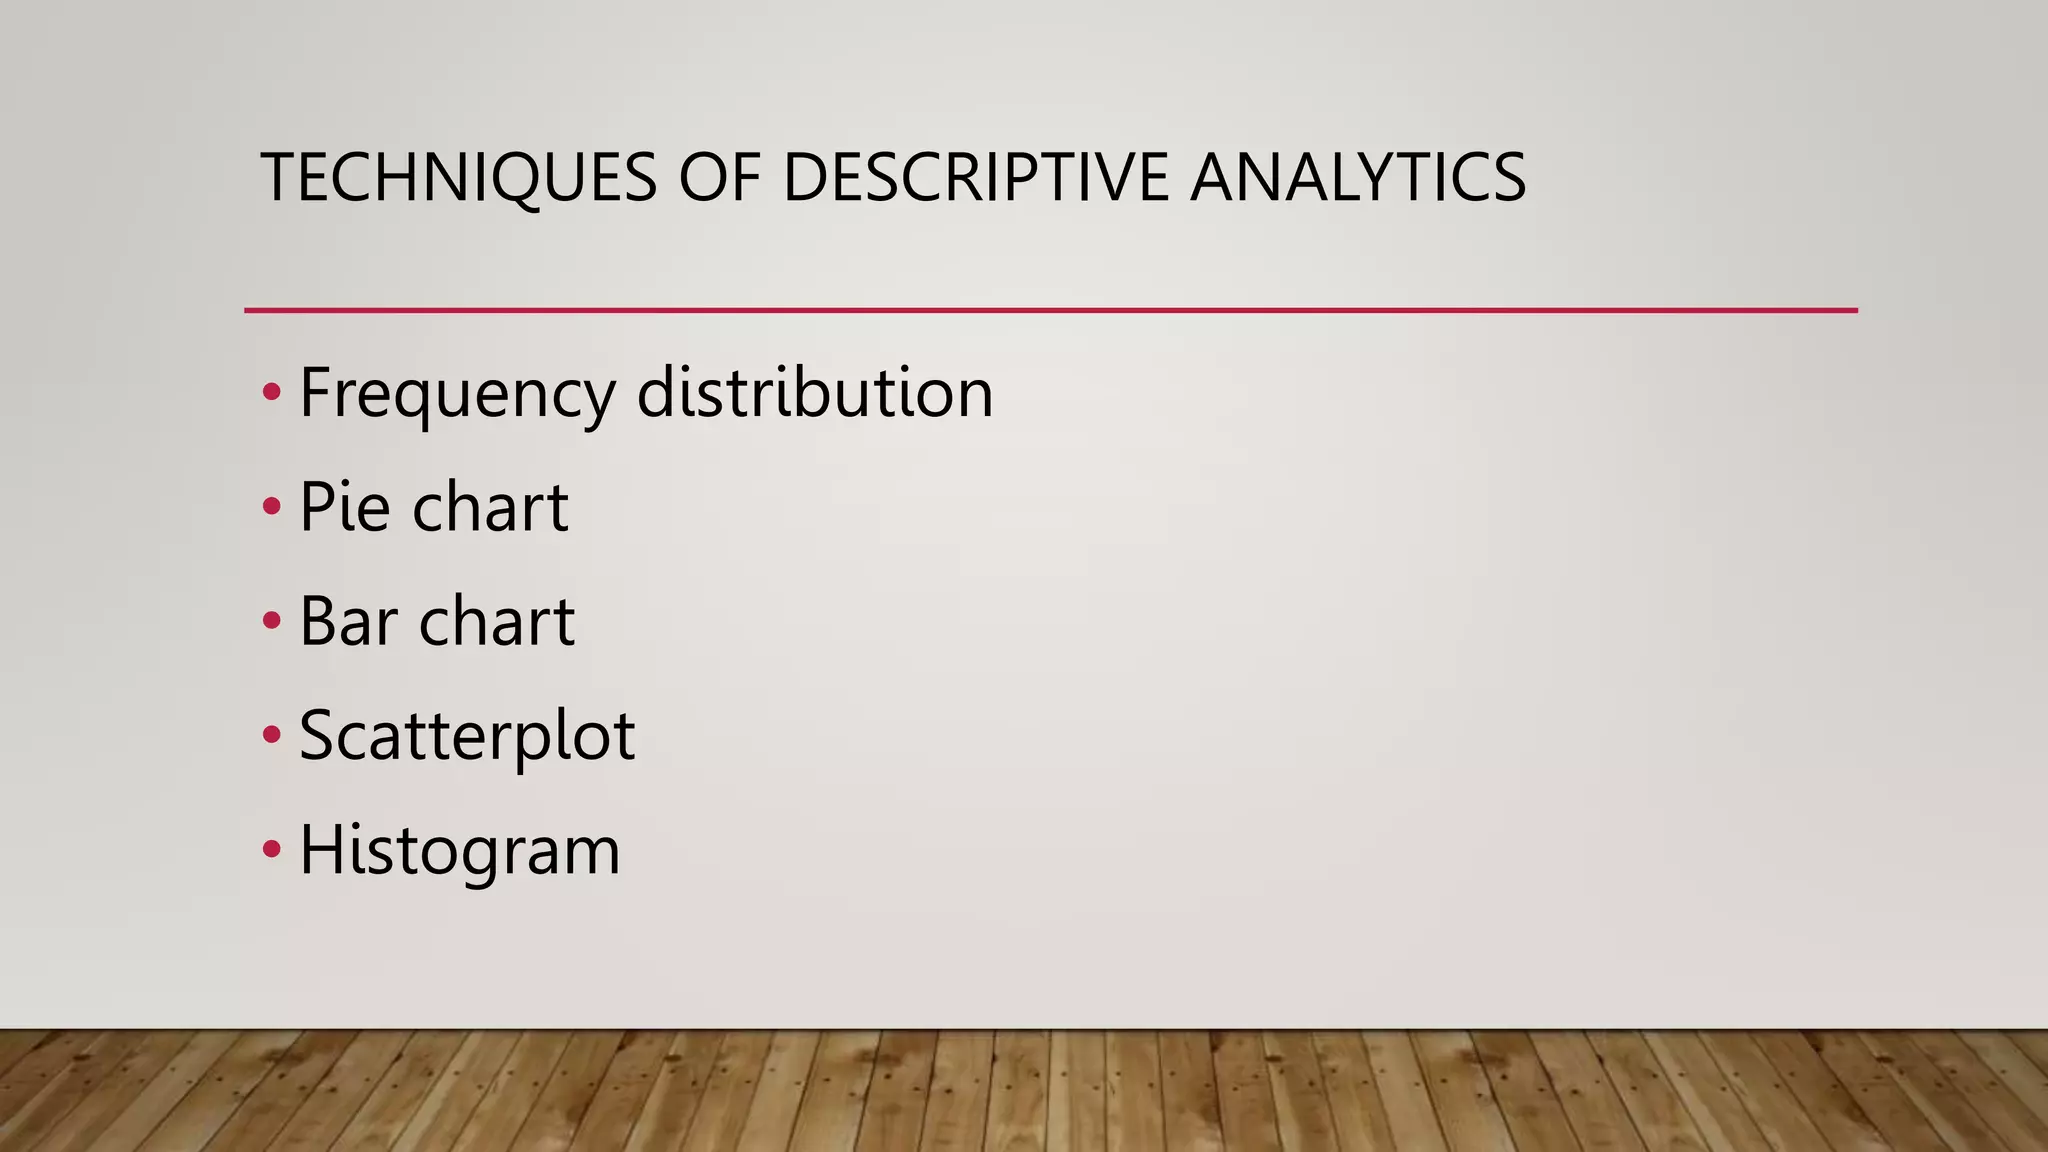
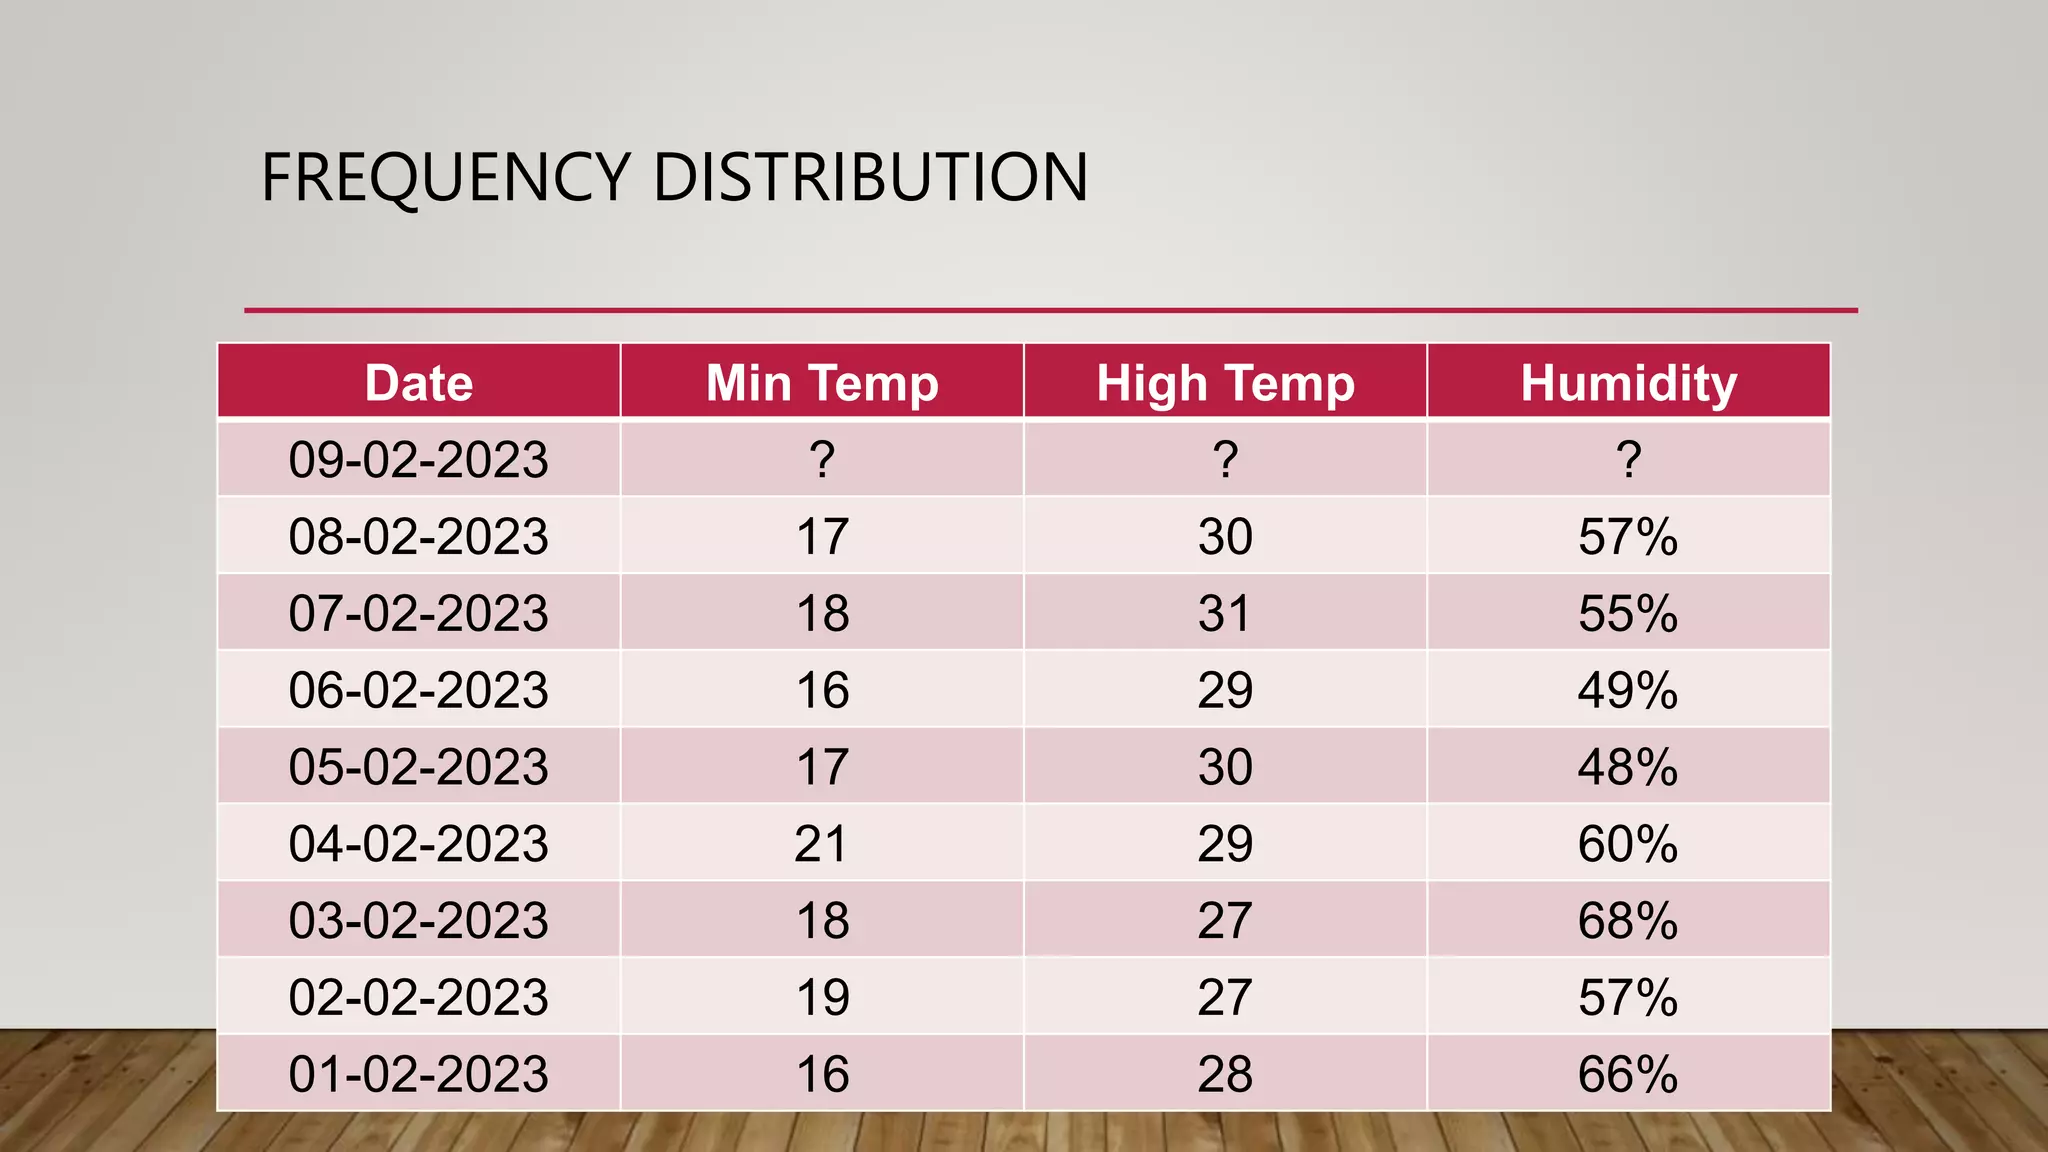
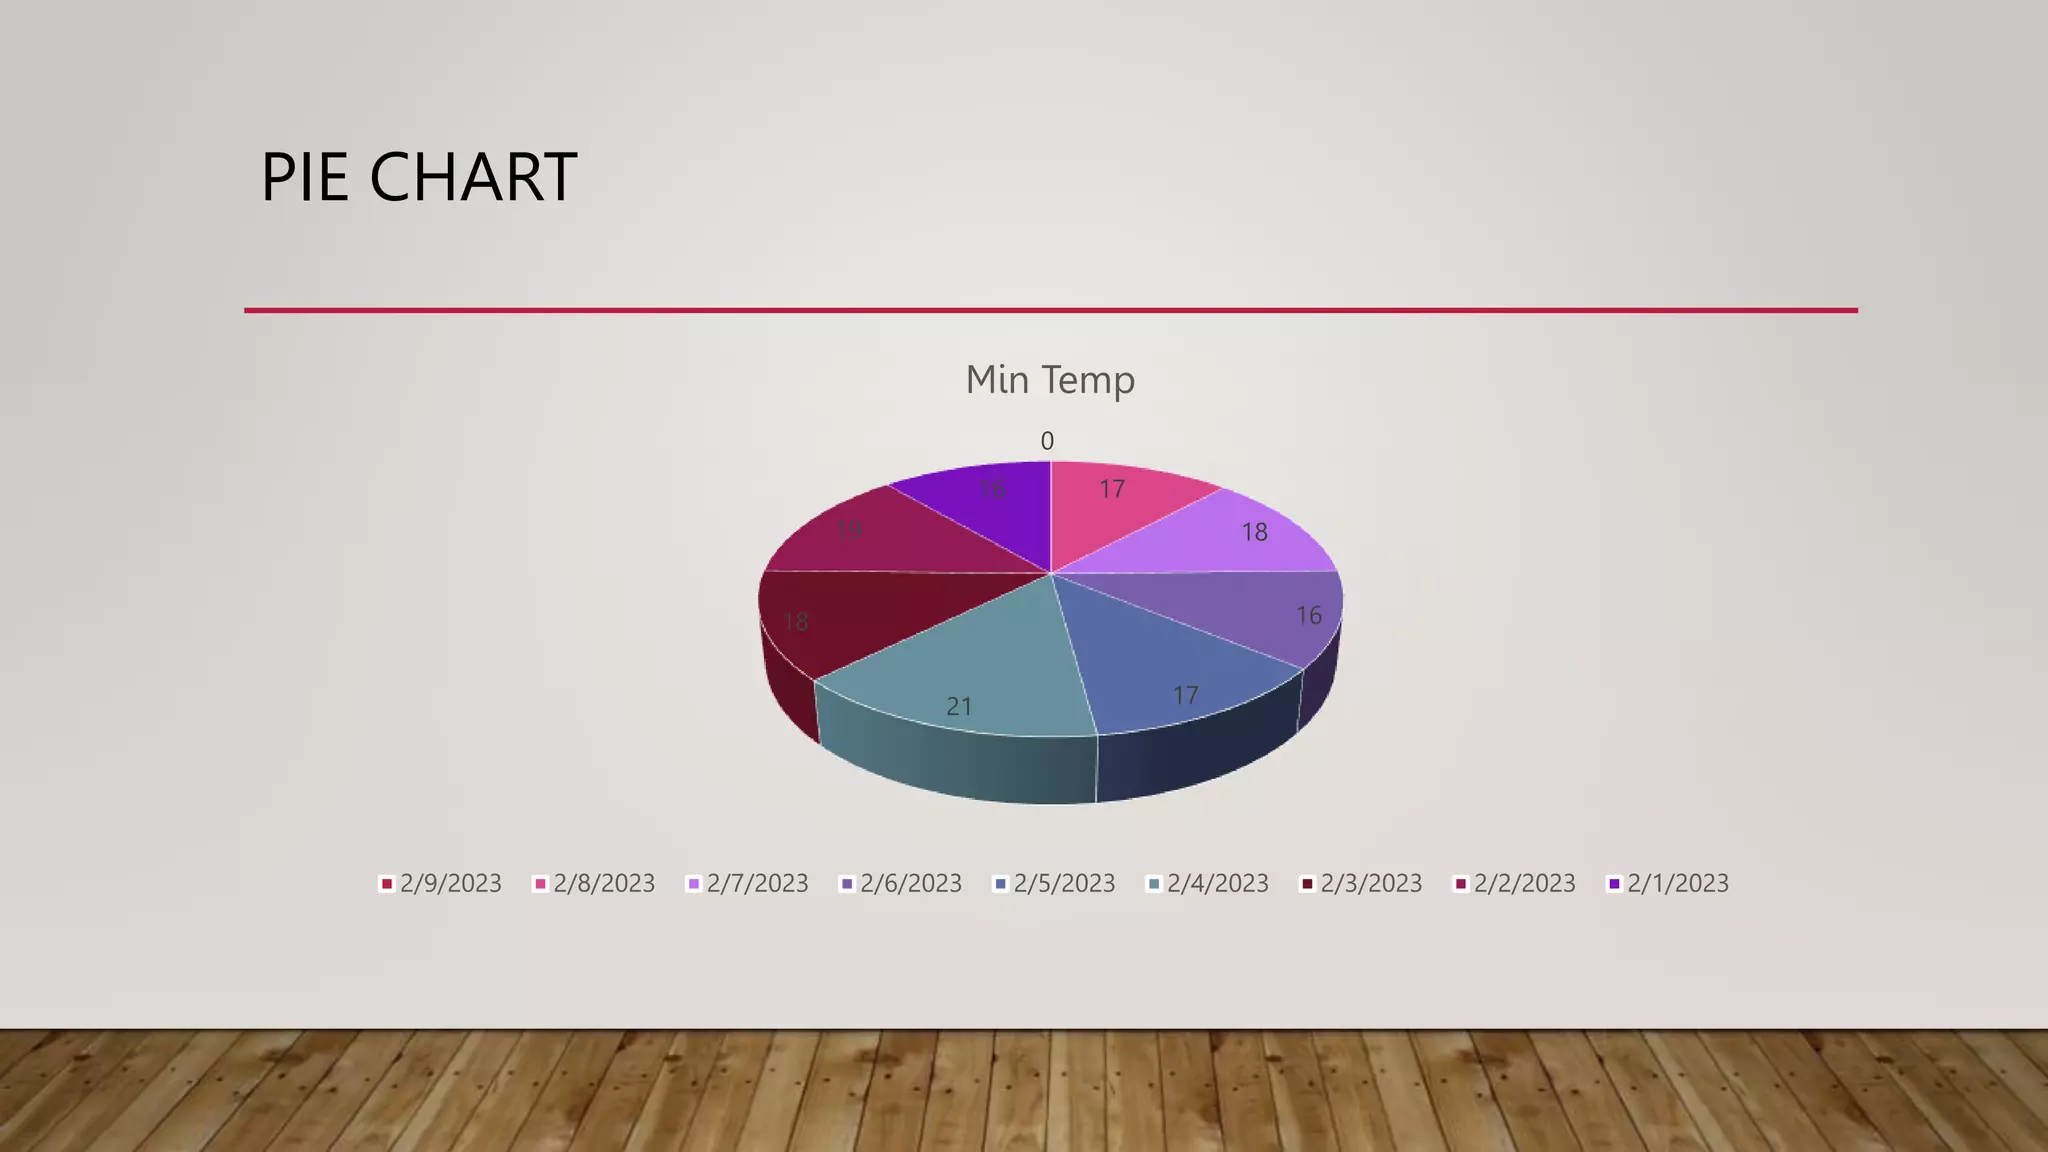
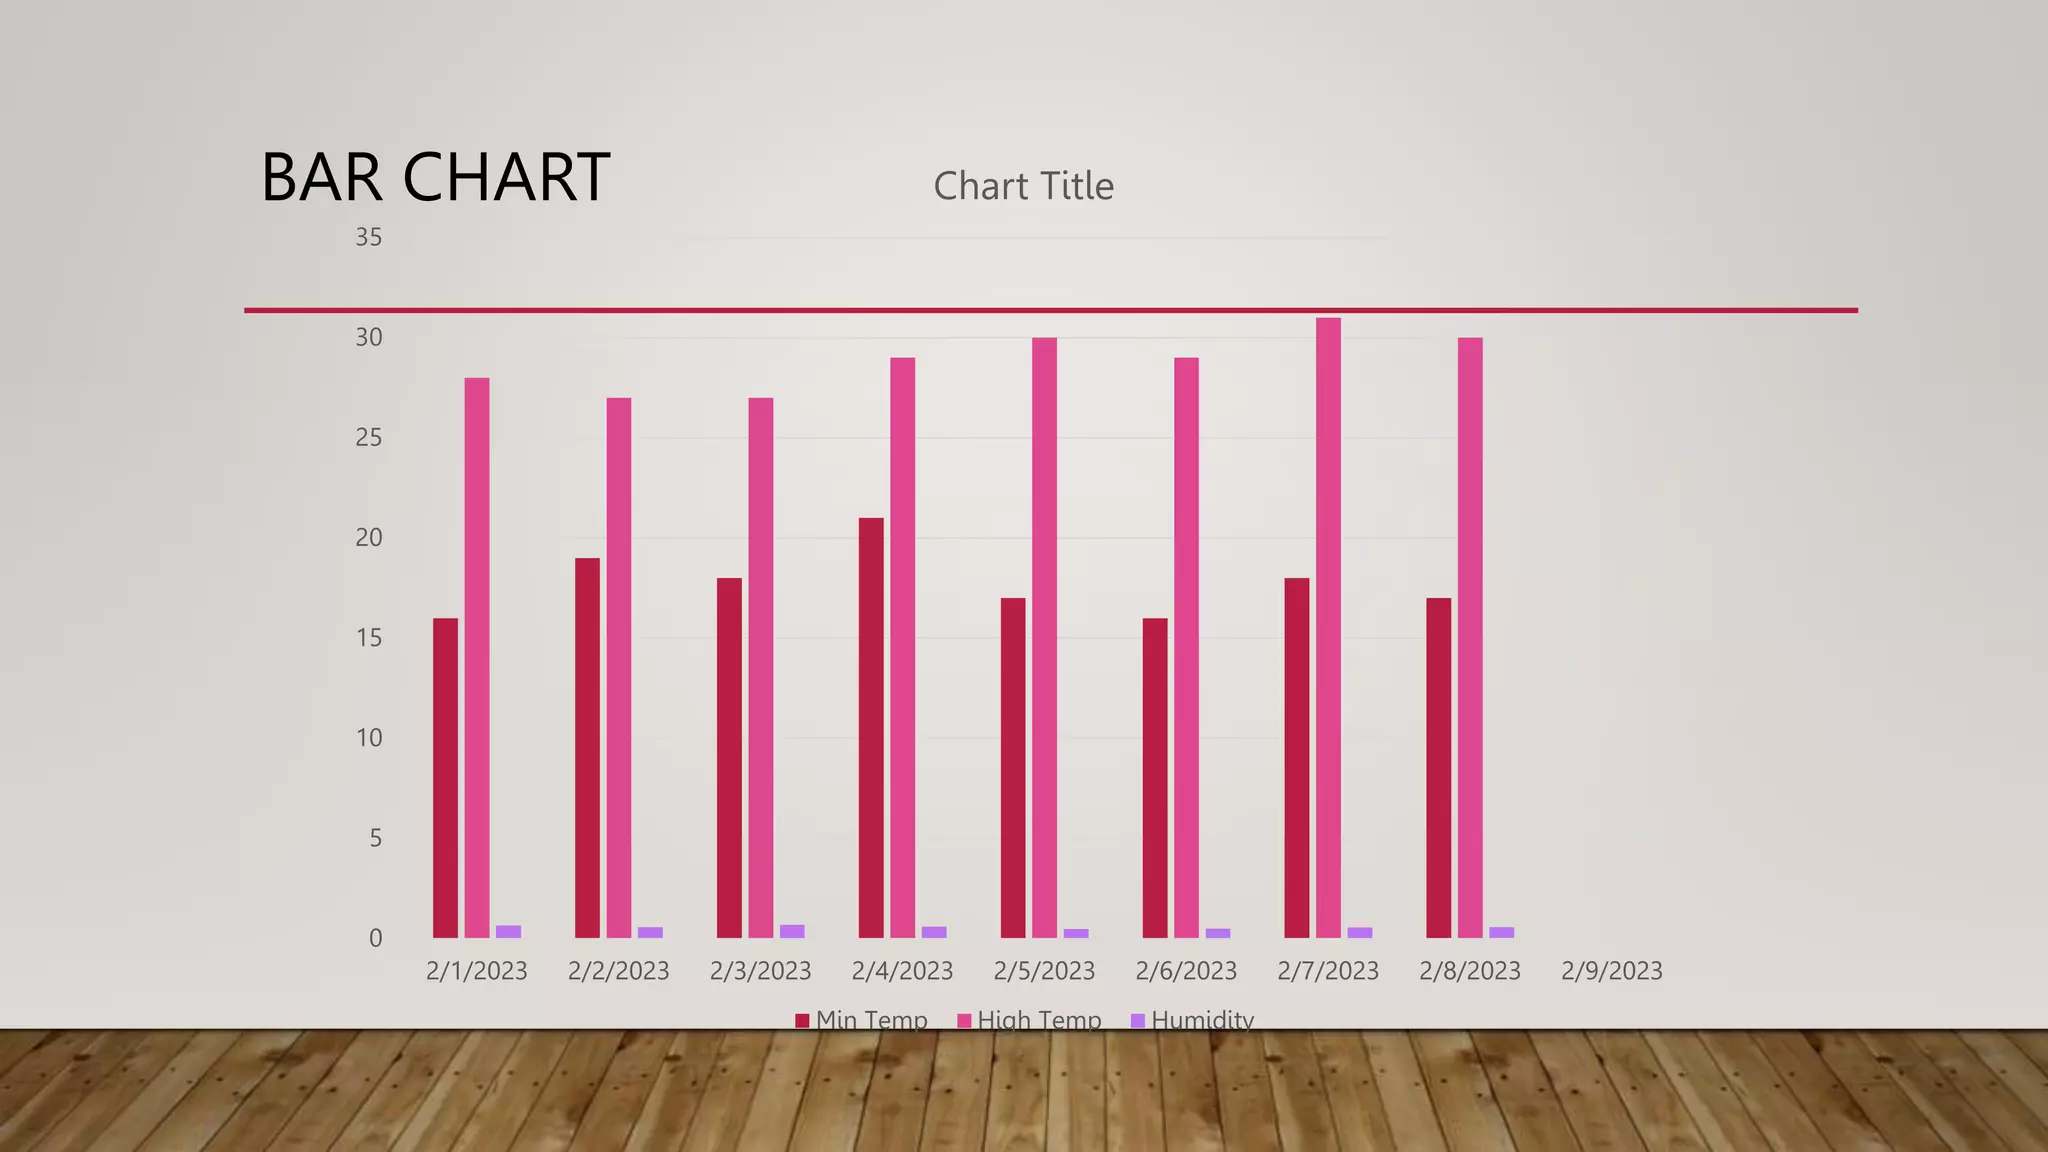
Descriptive analytics interprets historical data to understand business changes, emphasizing metrics, data preparation, analysis, and representation techniques.
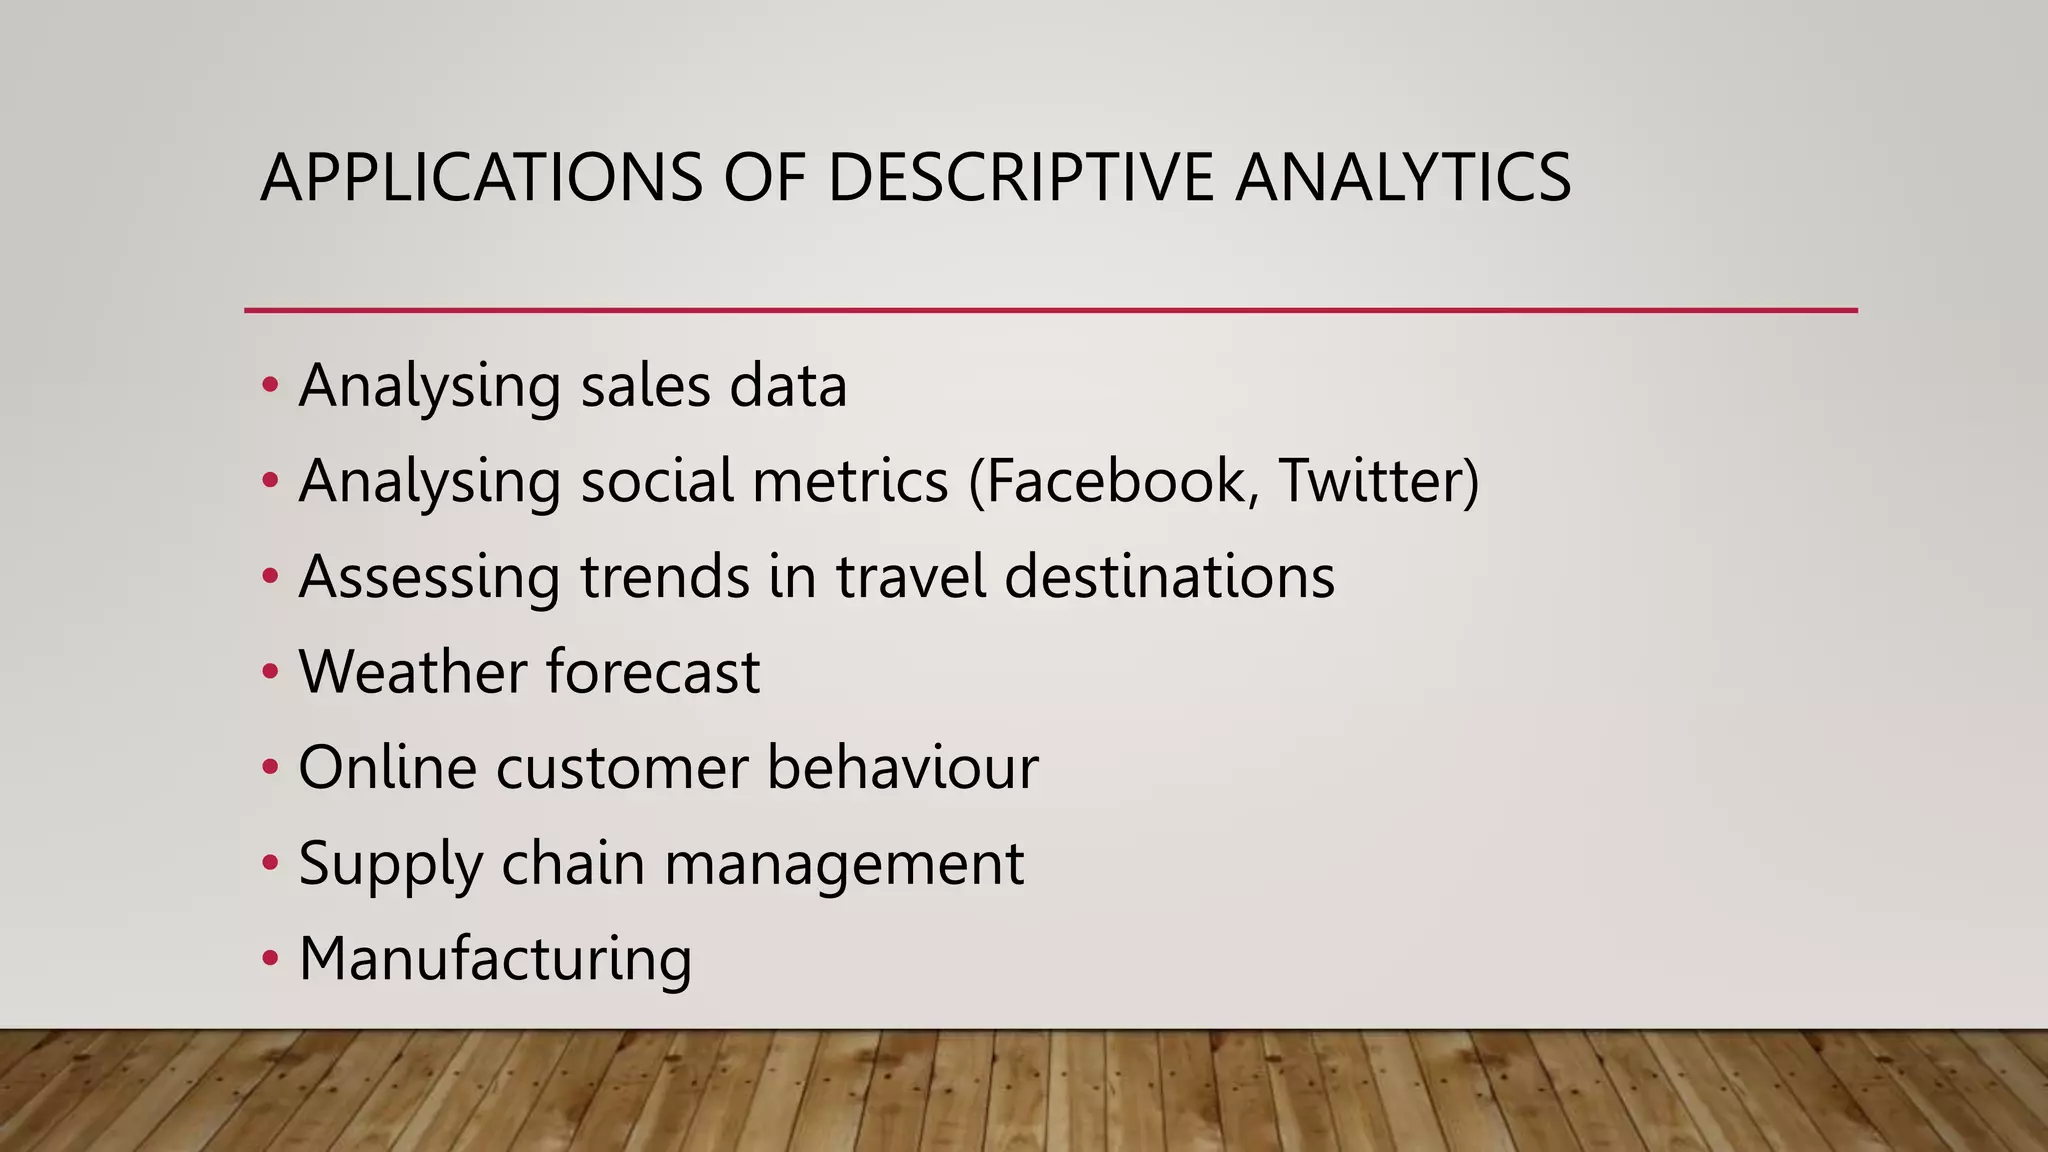
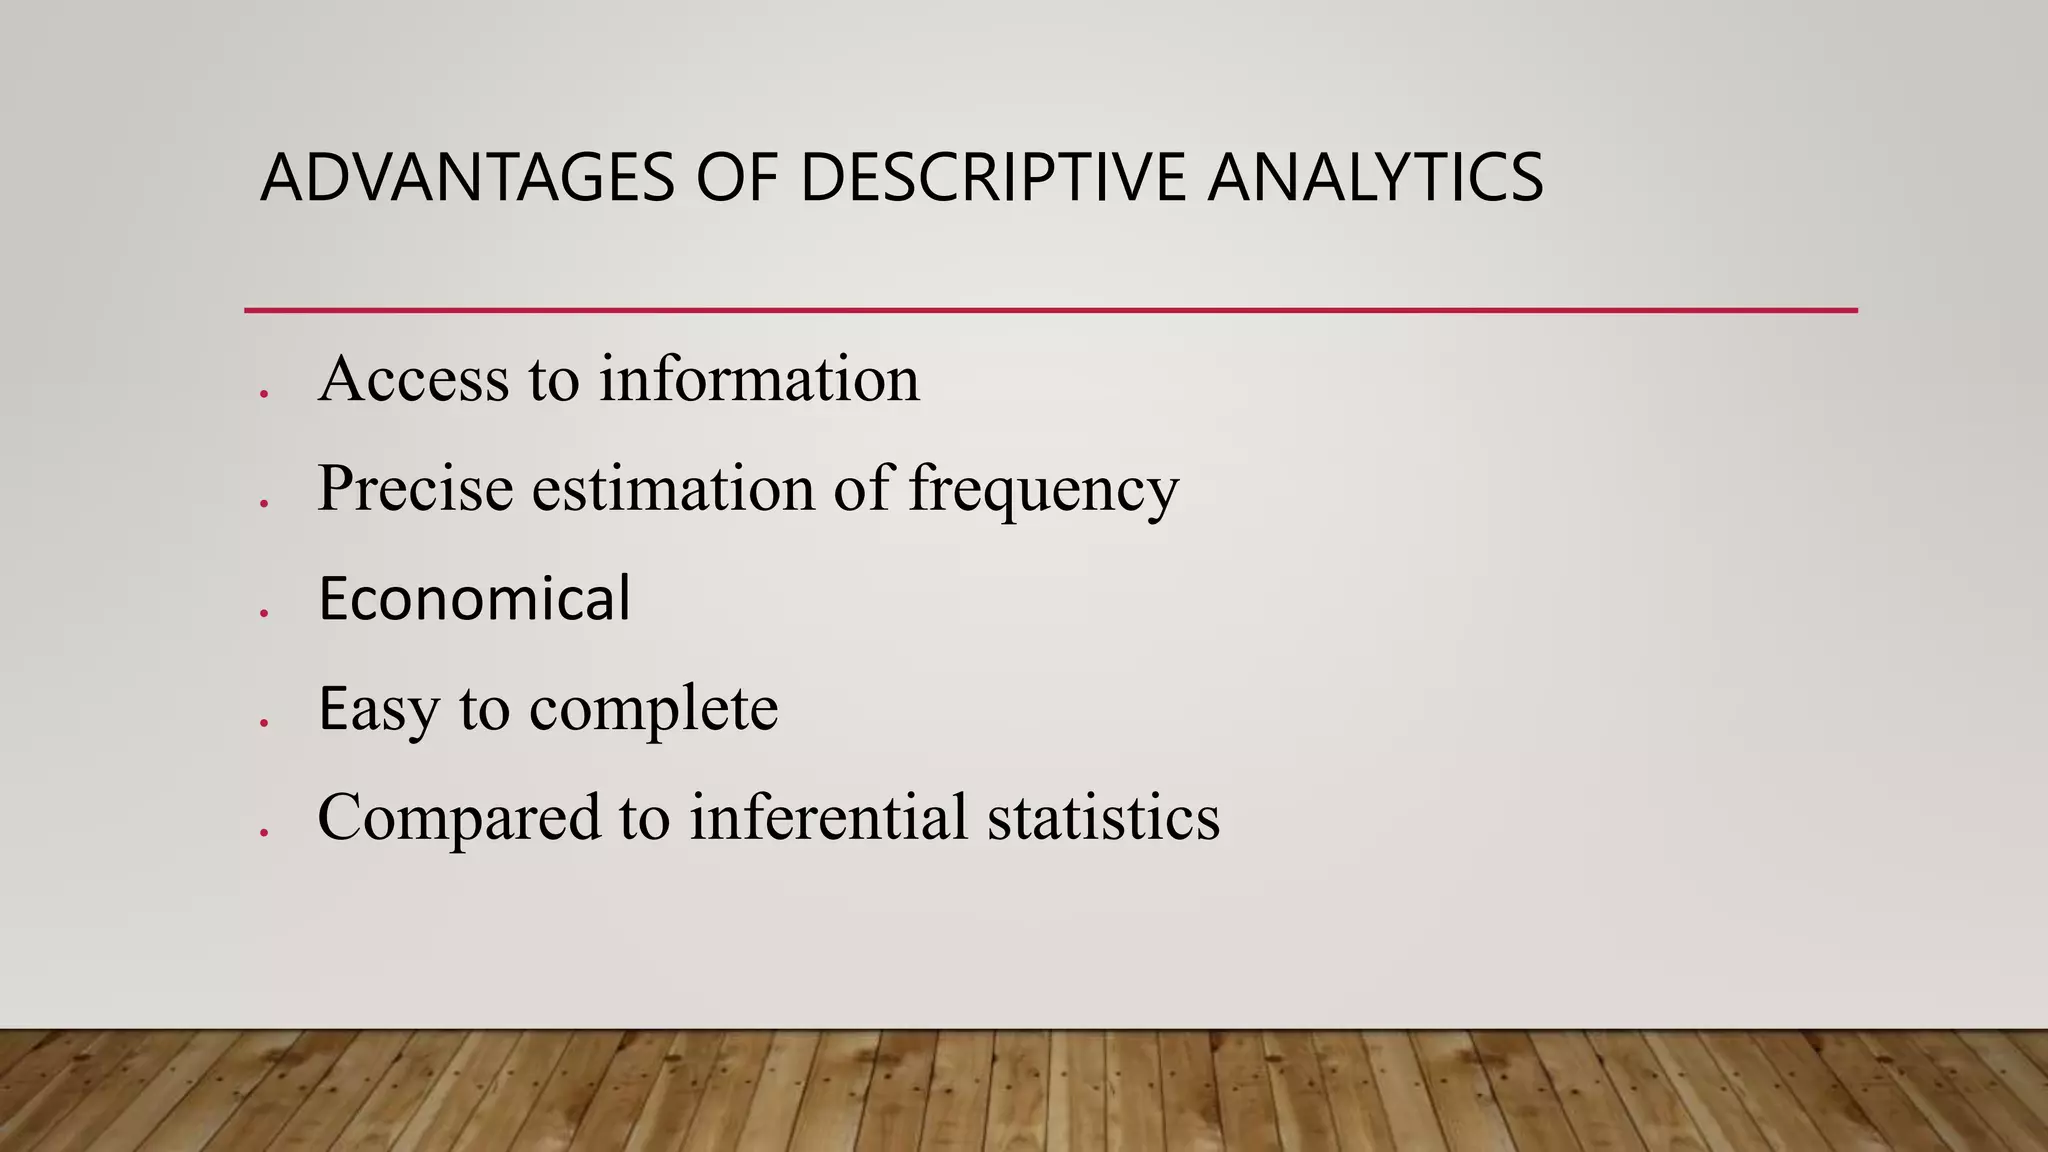
Applications in various sectors, advantages like easy access to information, and disadvantages such as limited predictive capability.
Diagnostic analytics seeks to understand causes behind trends identified by descriptive methods, addressing 'why' events occur.
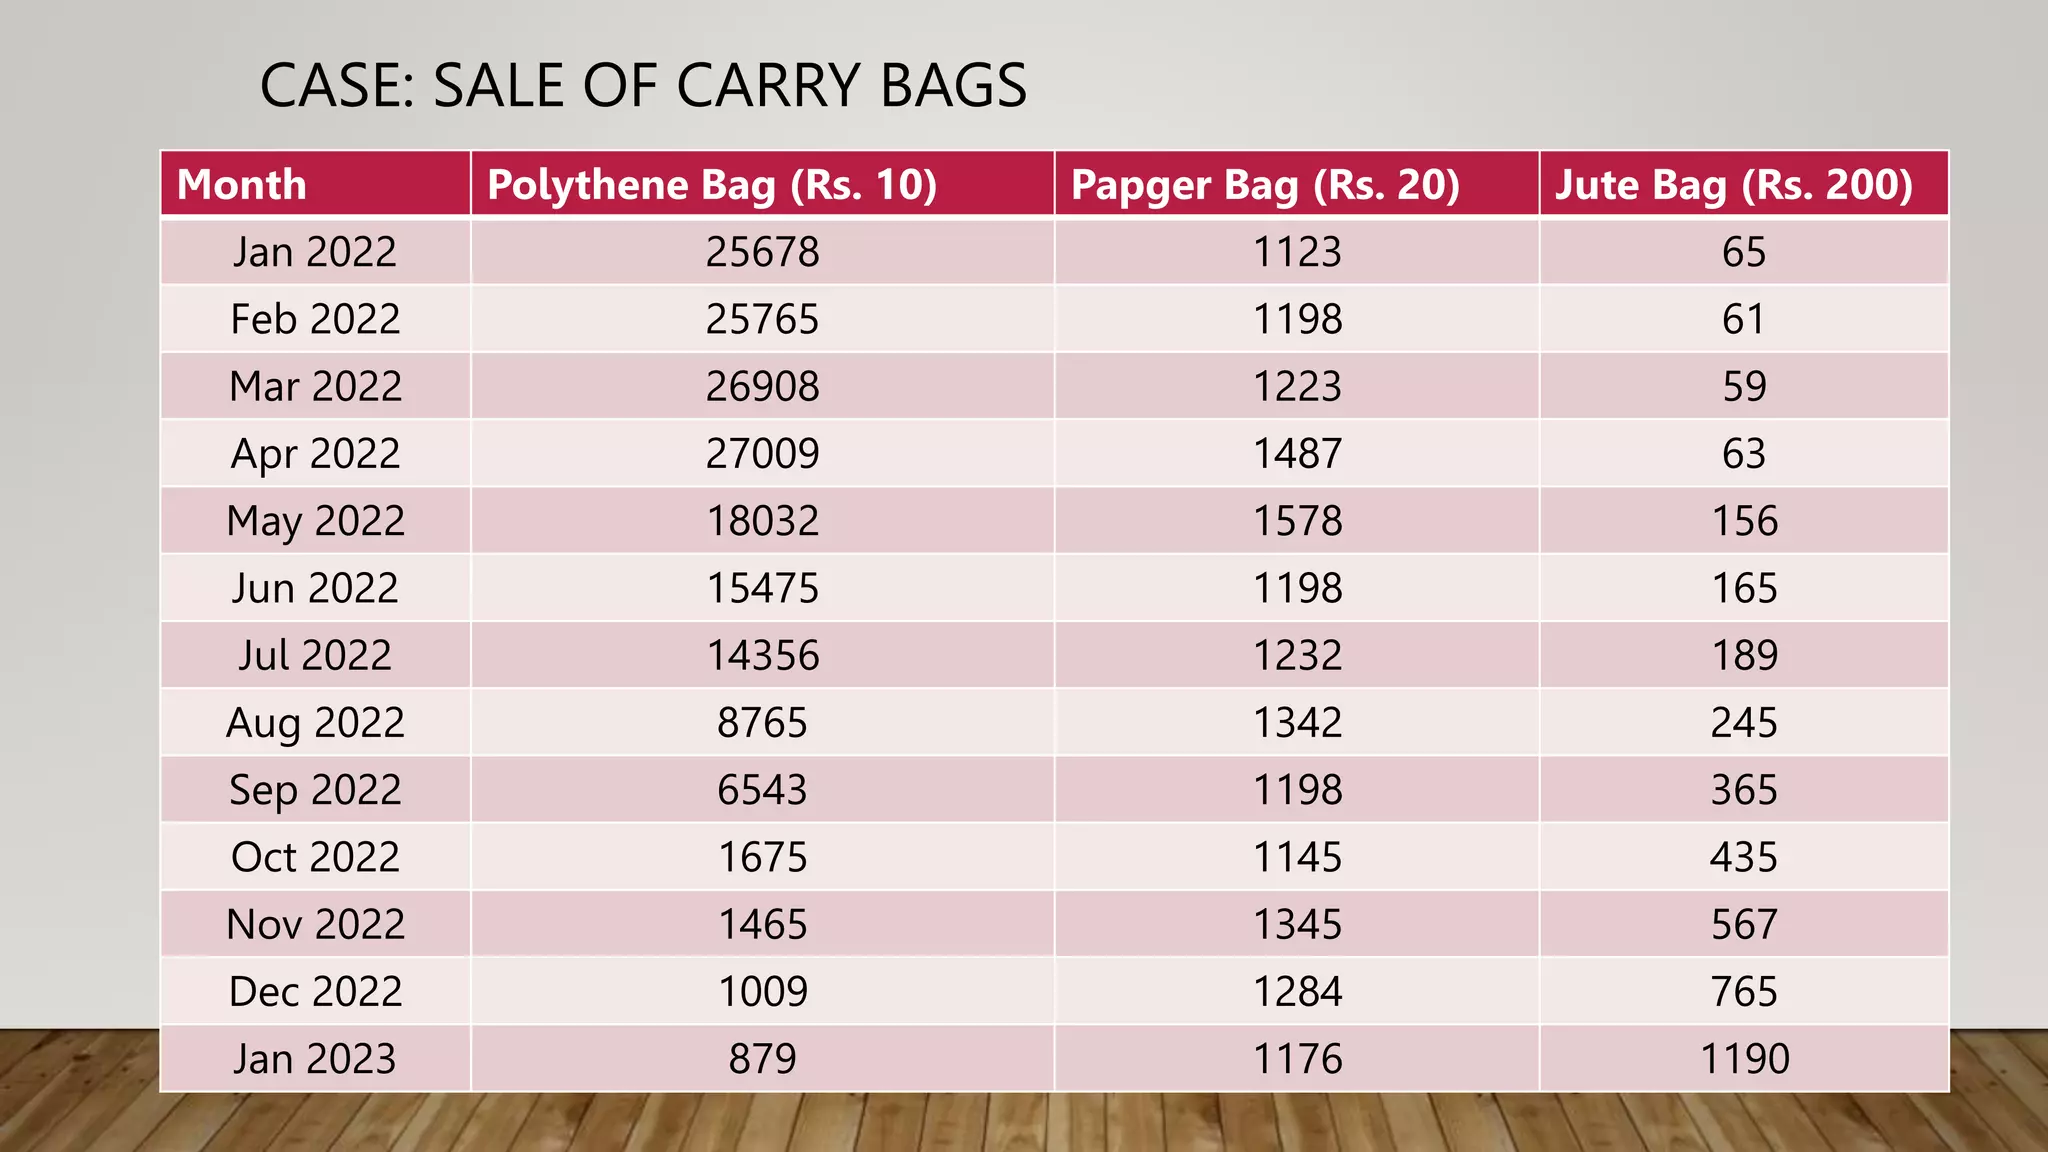
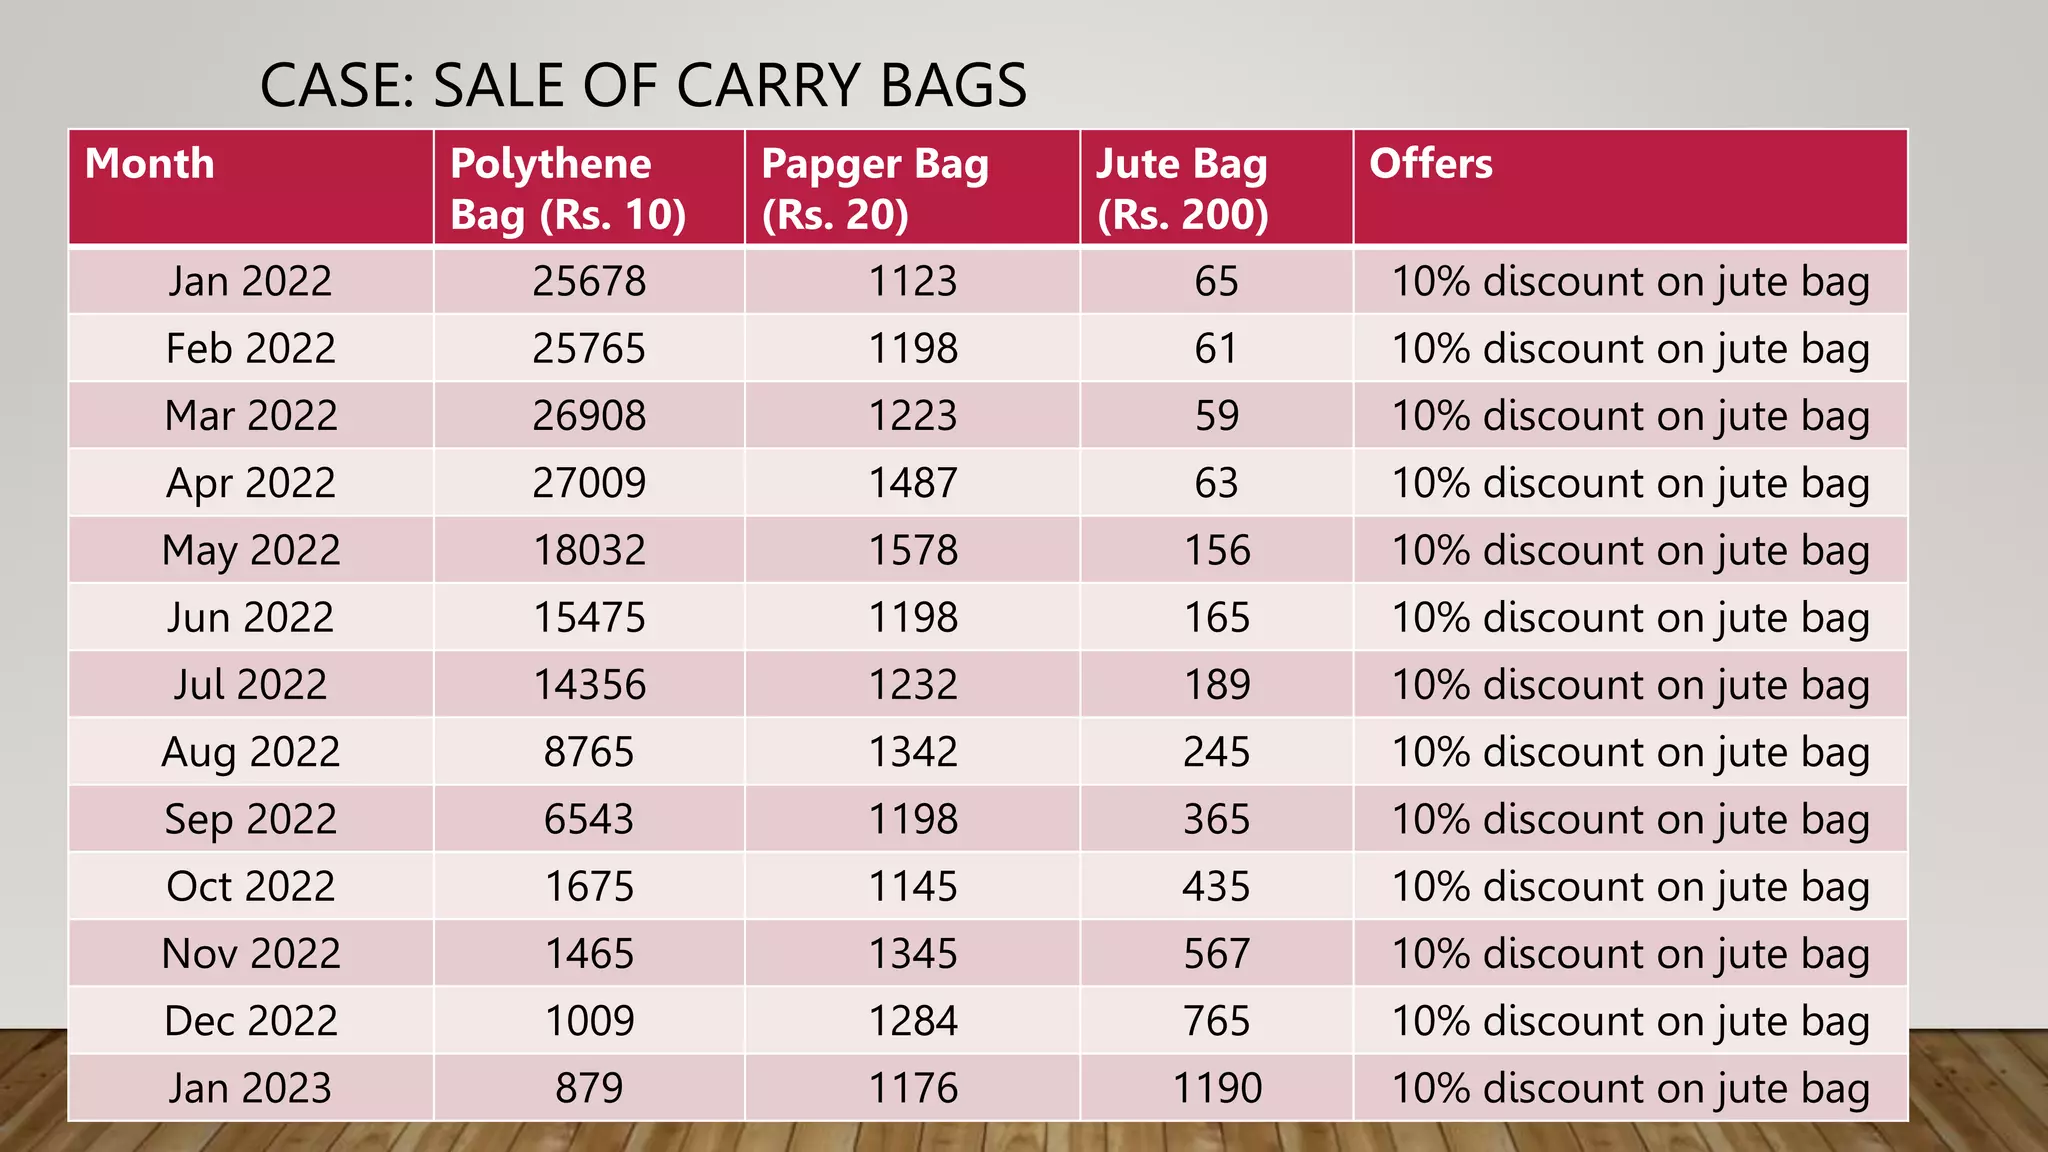
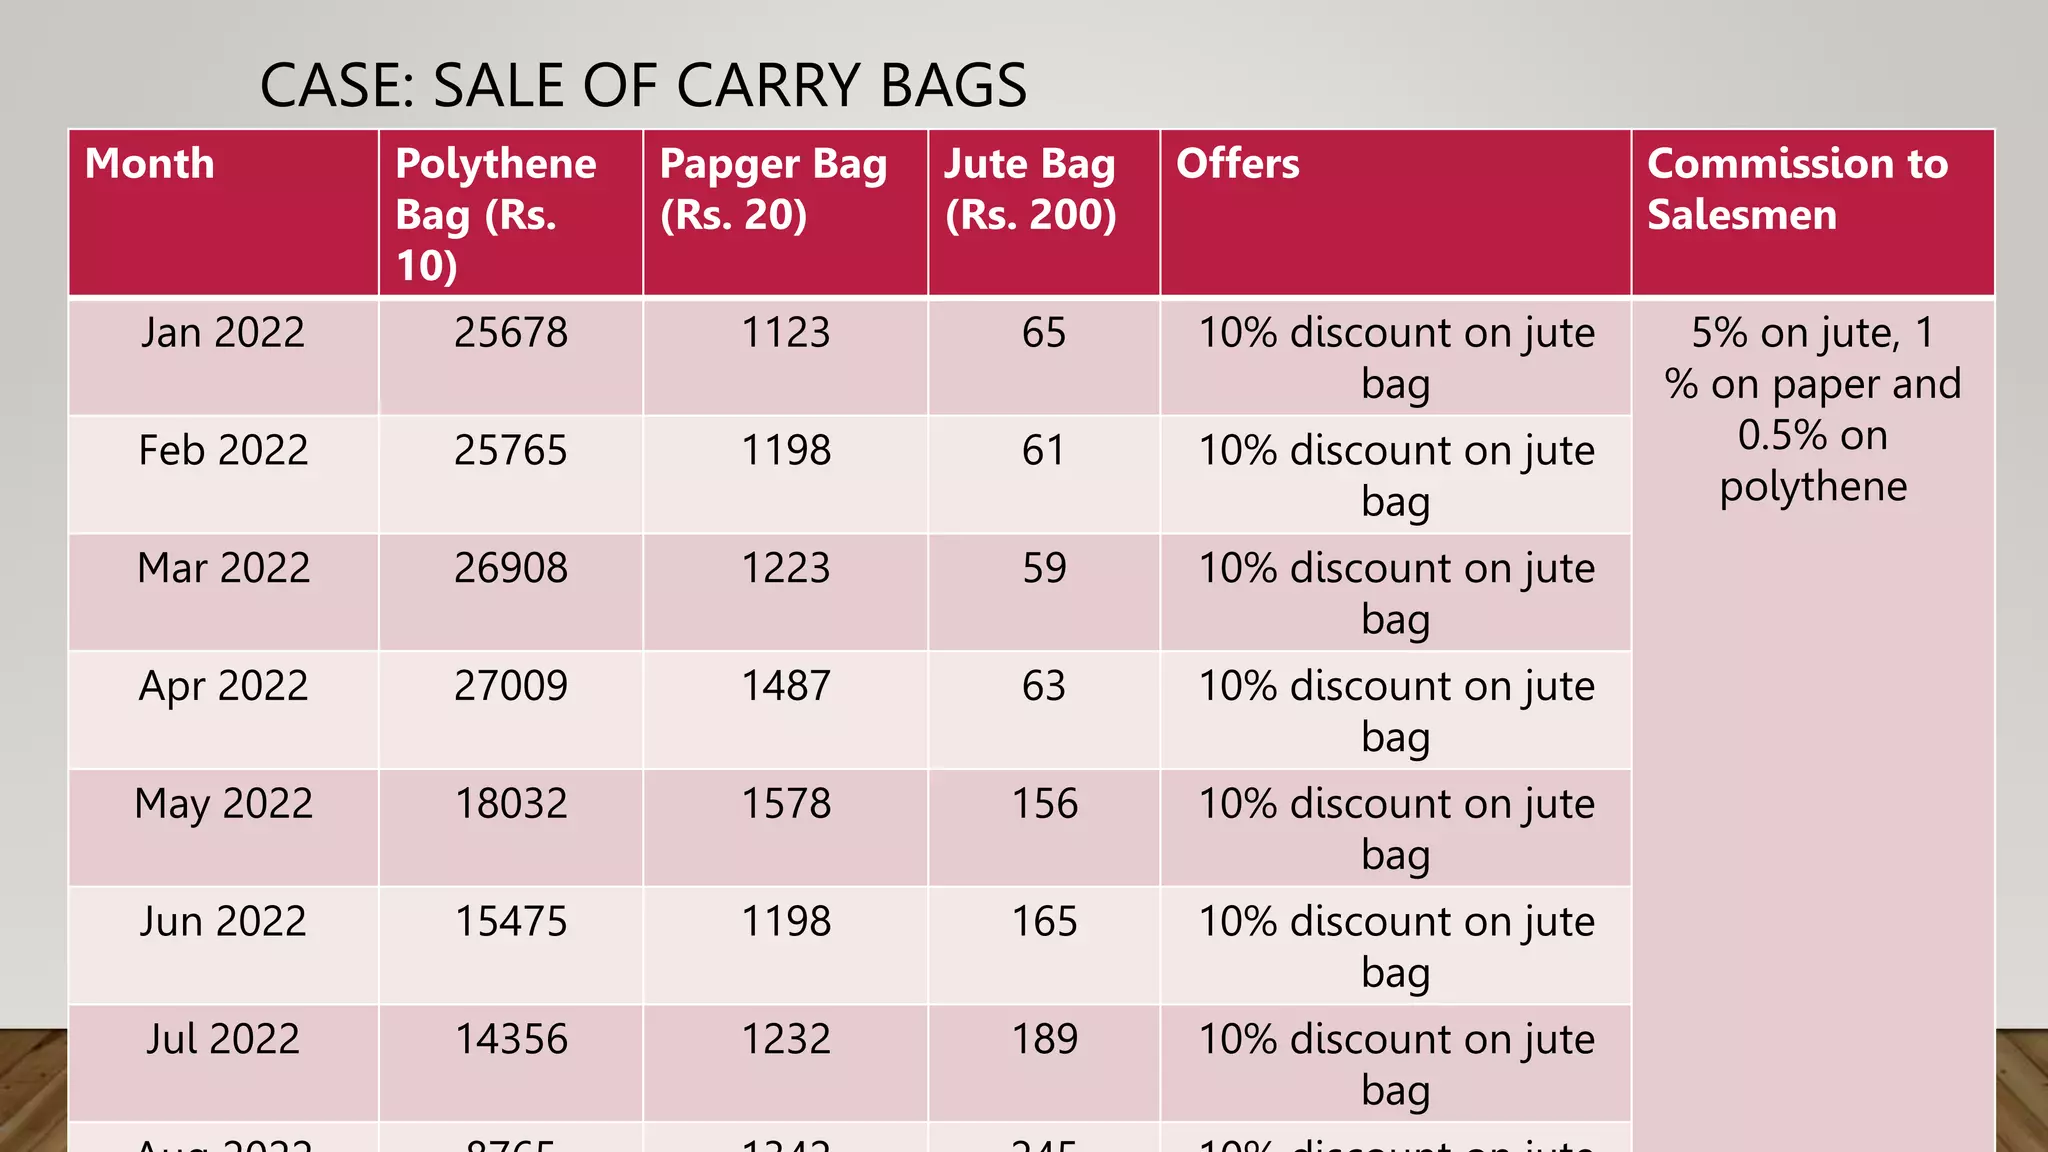
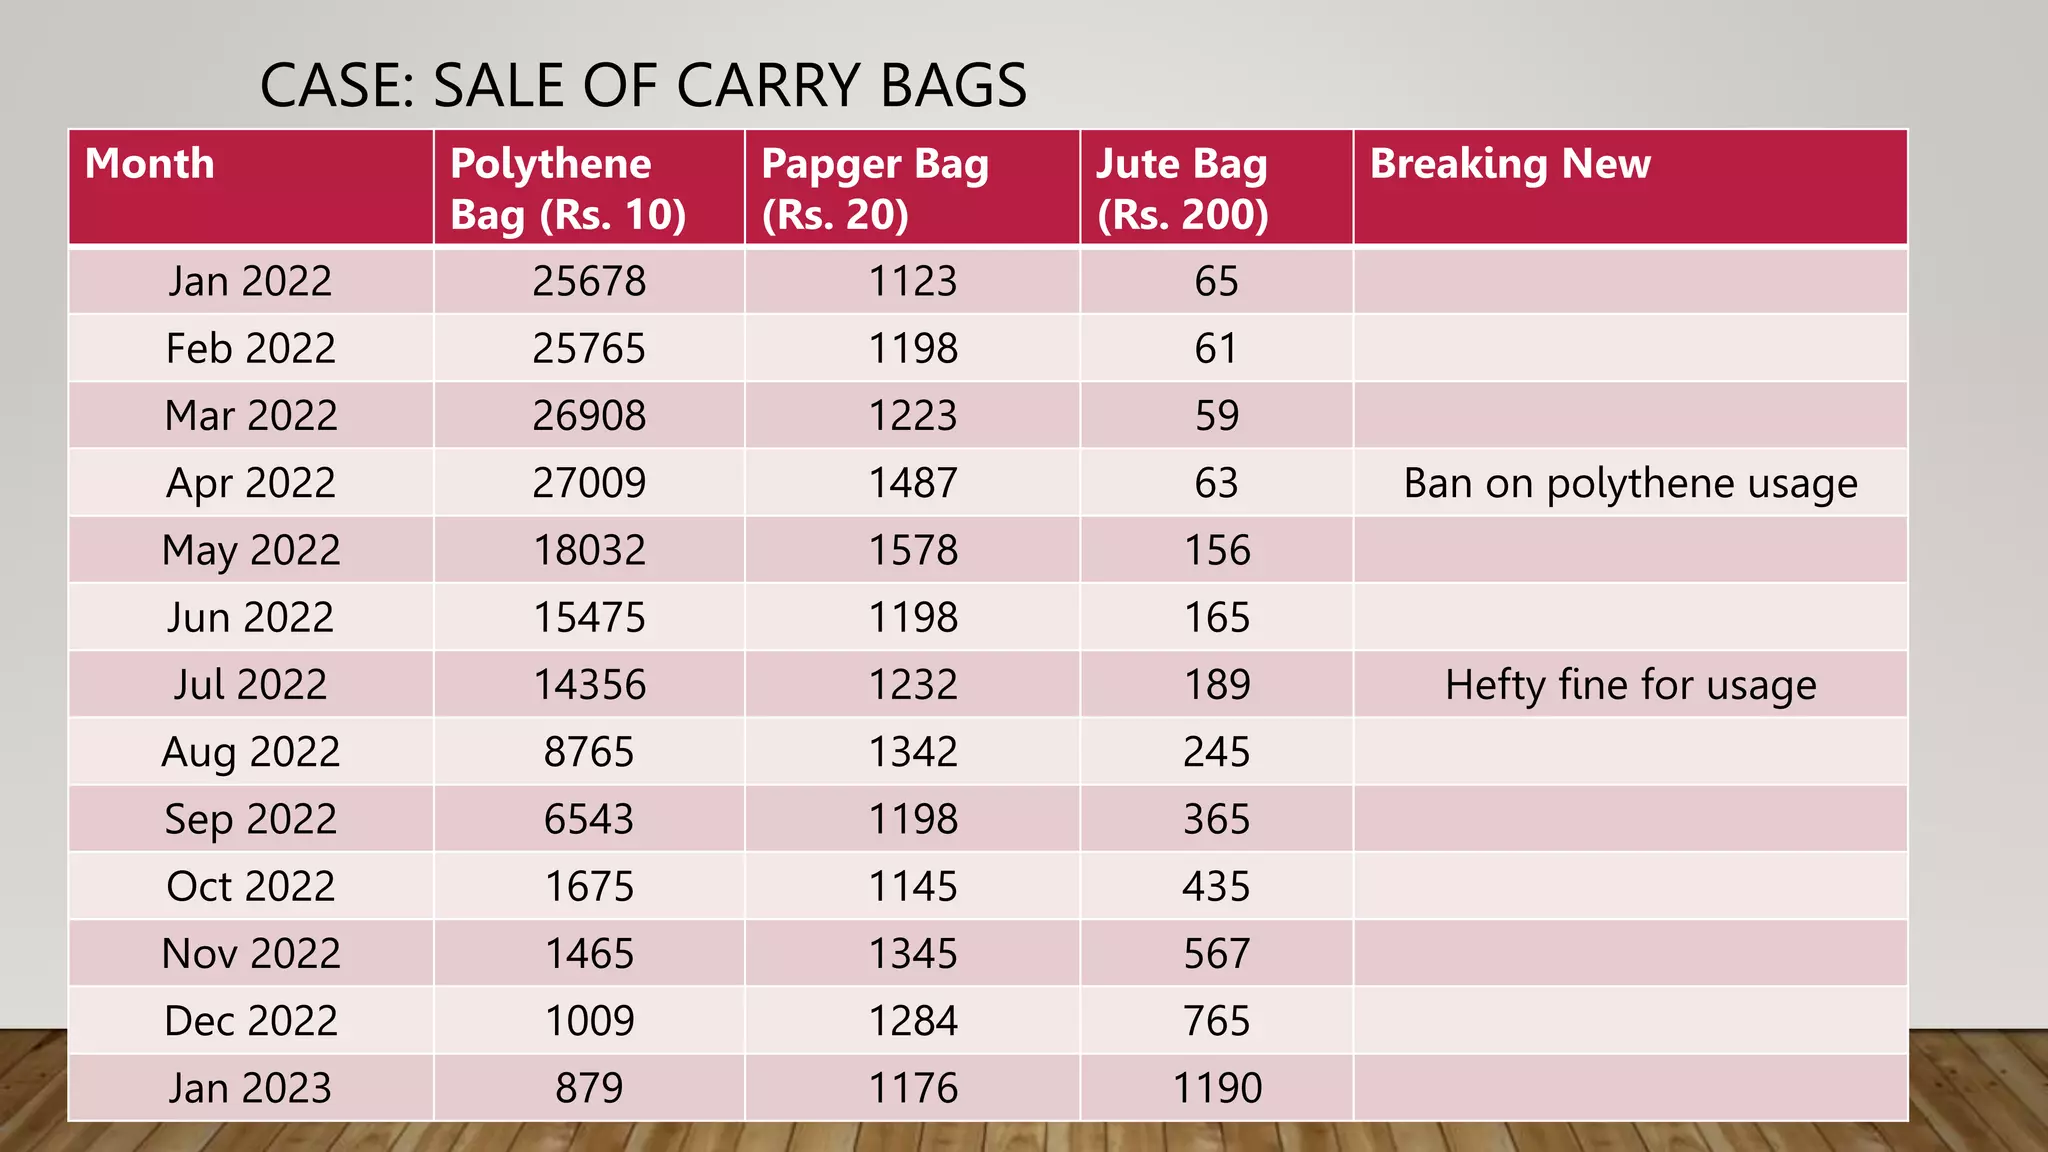
Explores techniques like data drilling, data mining, and correlation analysis using the carry bags sales case to demonstrate concepts. Sales data analysis of different types of carry bags over a year, highlighting discounts and significant changes affecting sales.
Applications of diagnostic analytics in various sectors, advantages in simplifying data for decision-making, and its limitations.
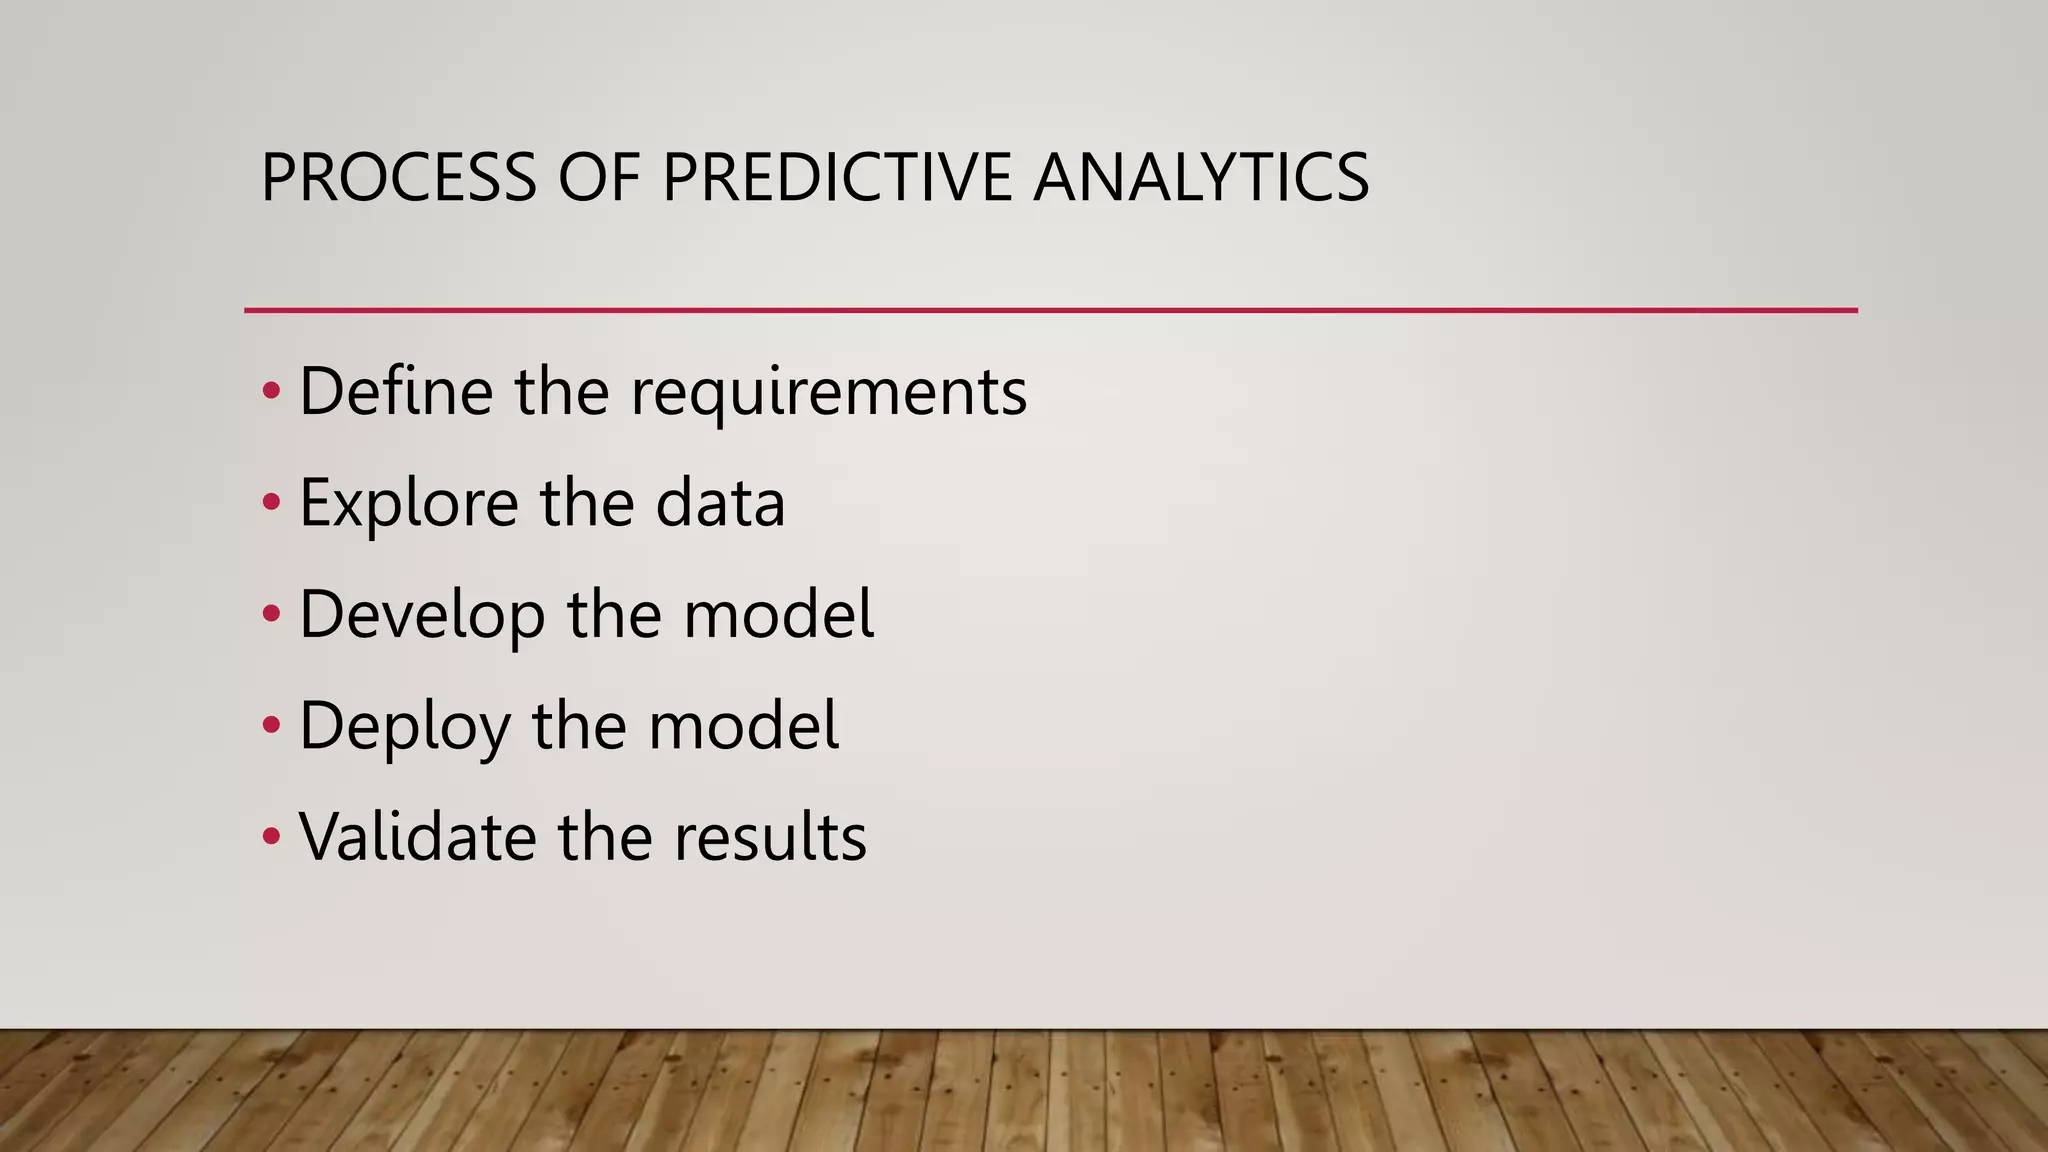
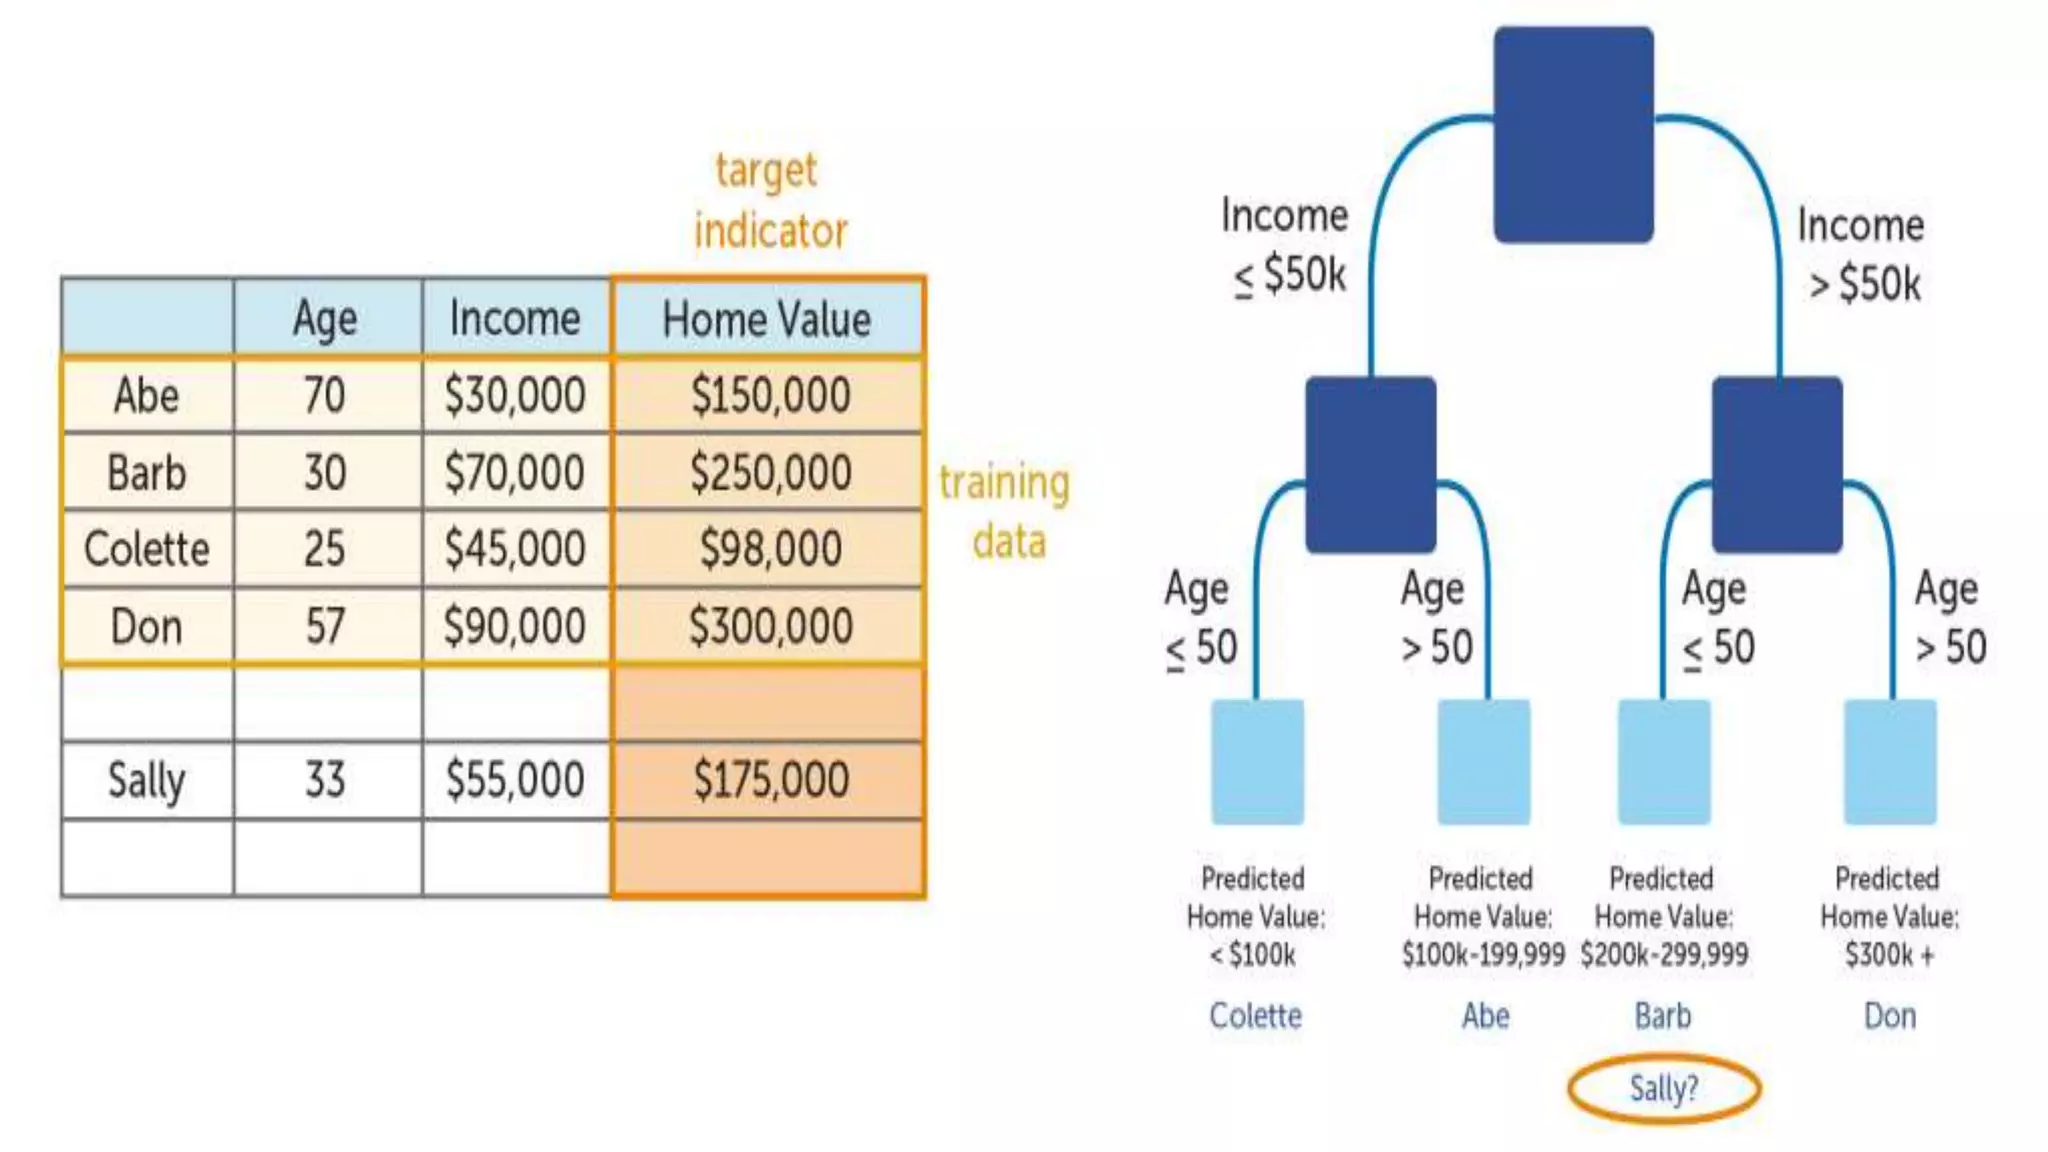
Predictive analytics utilizes statistical techniques to forecast future outcomes based on historical data patterns.
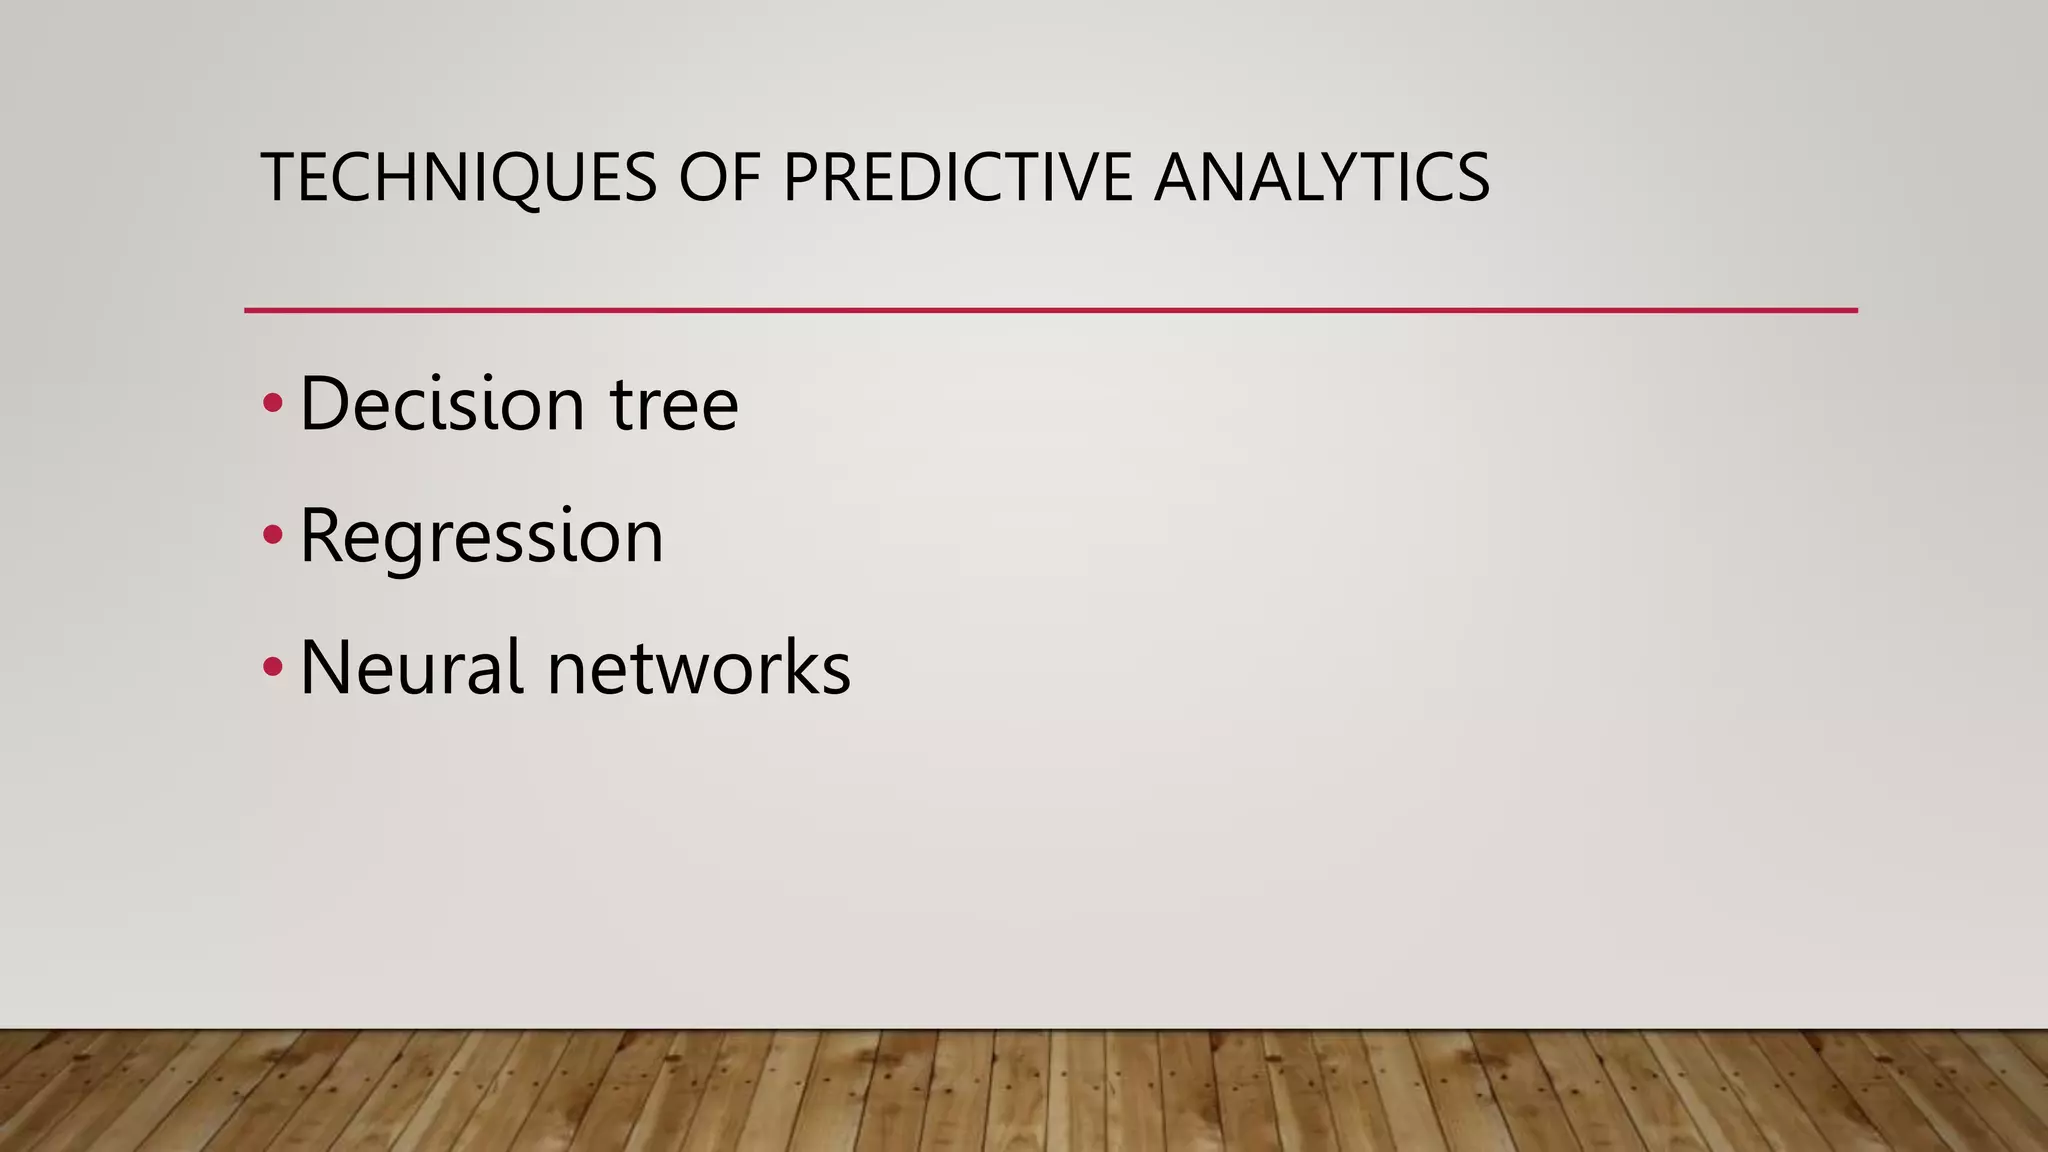
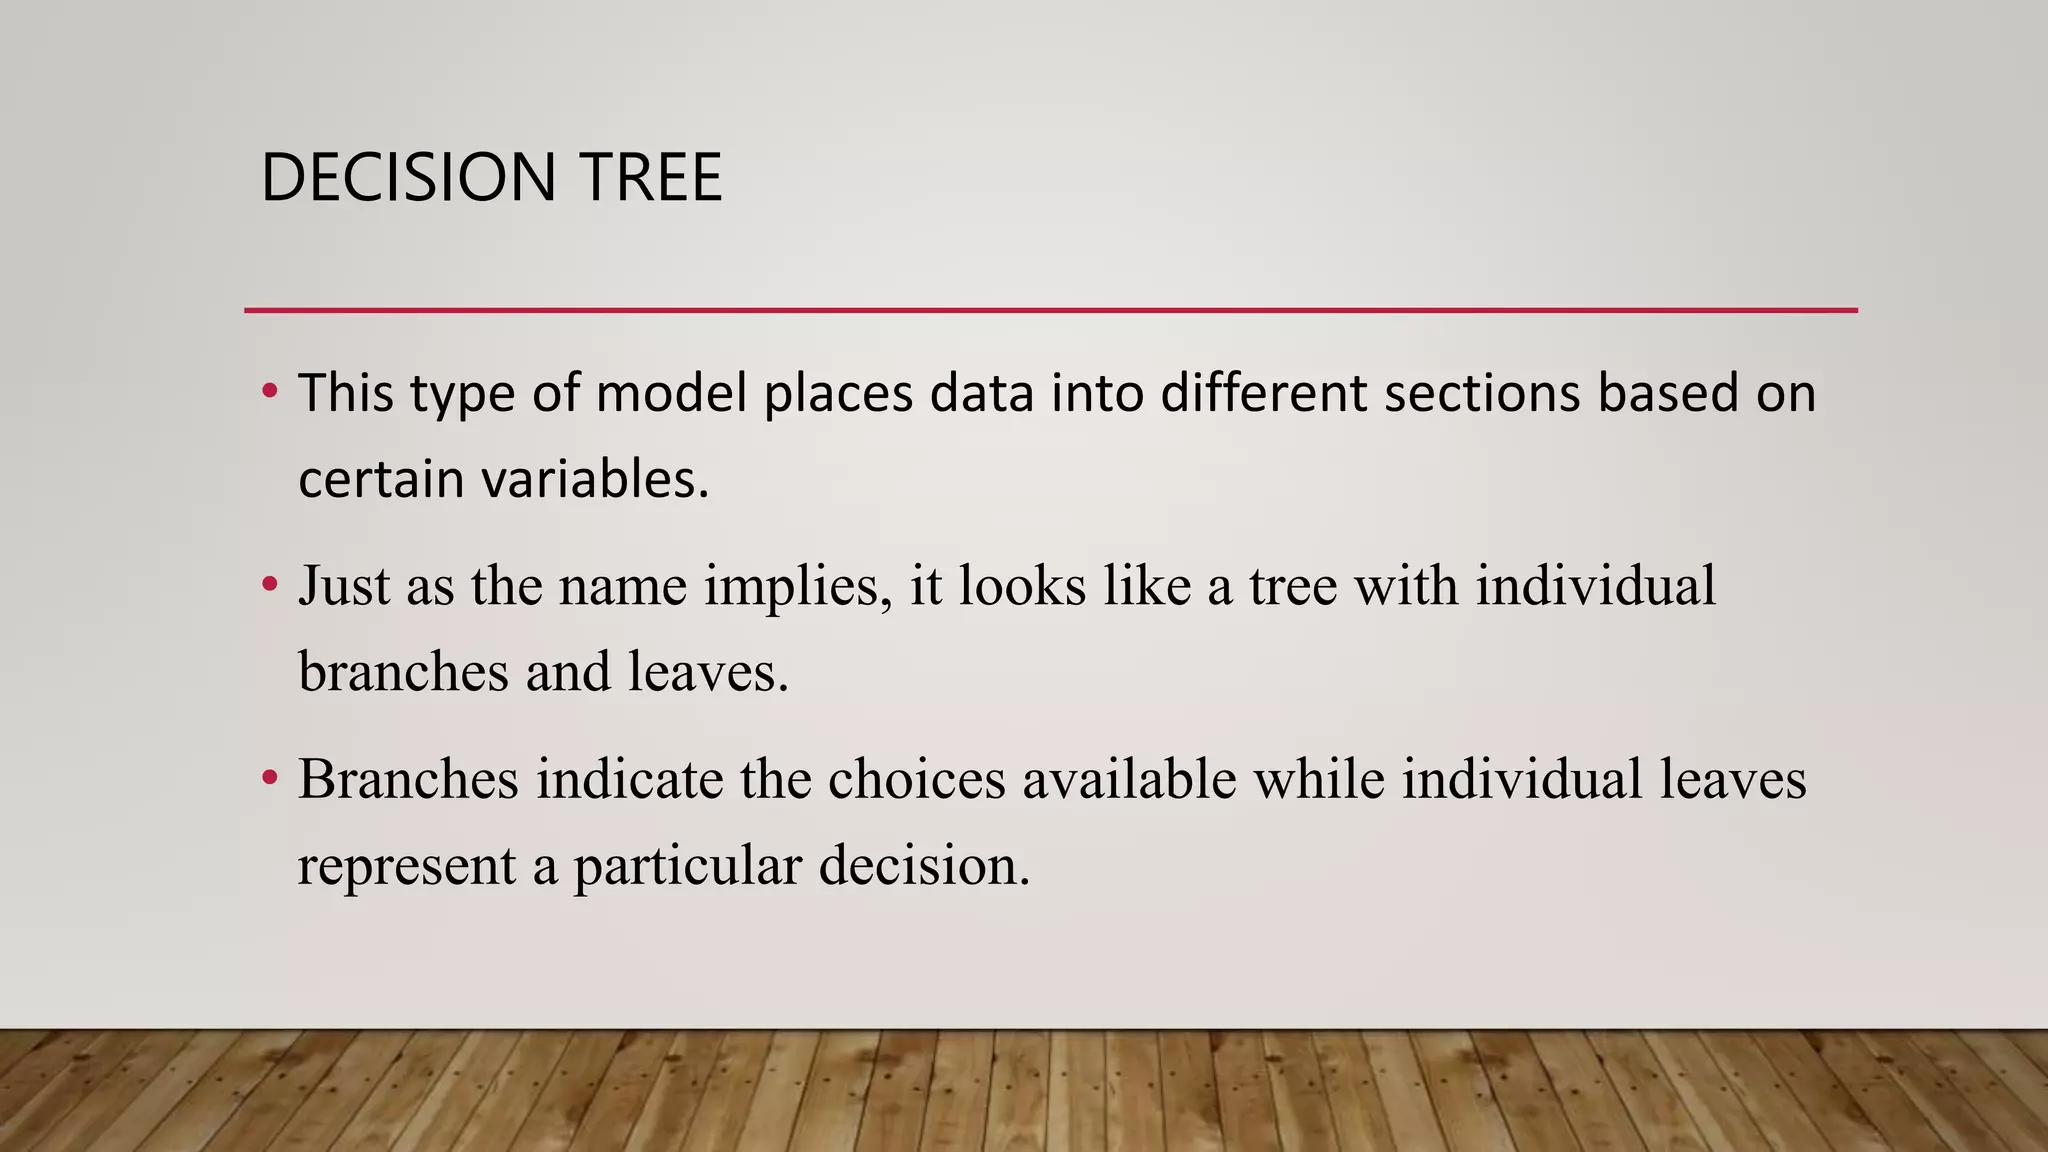
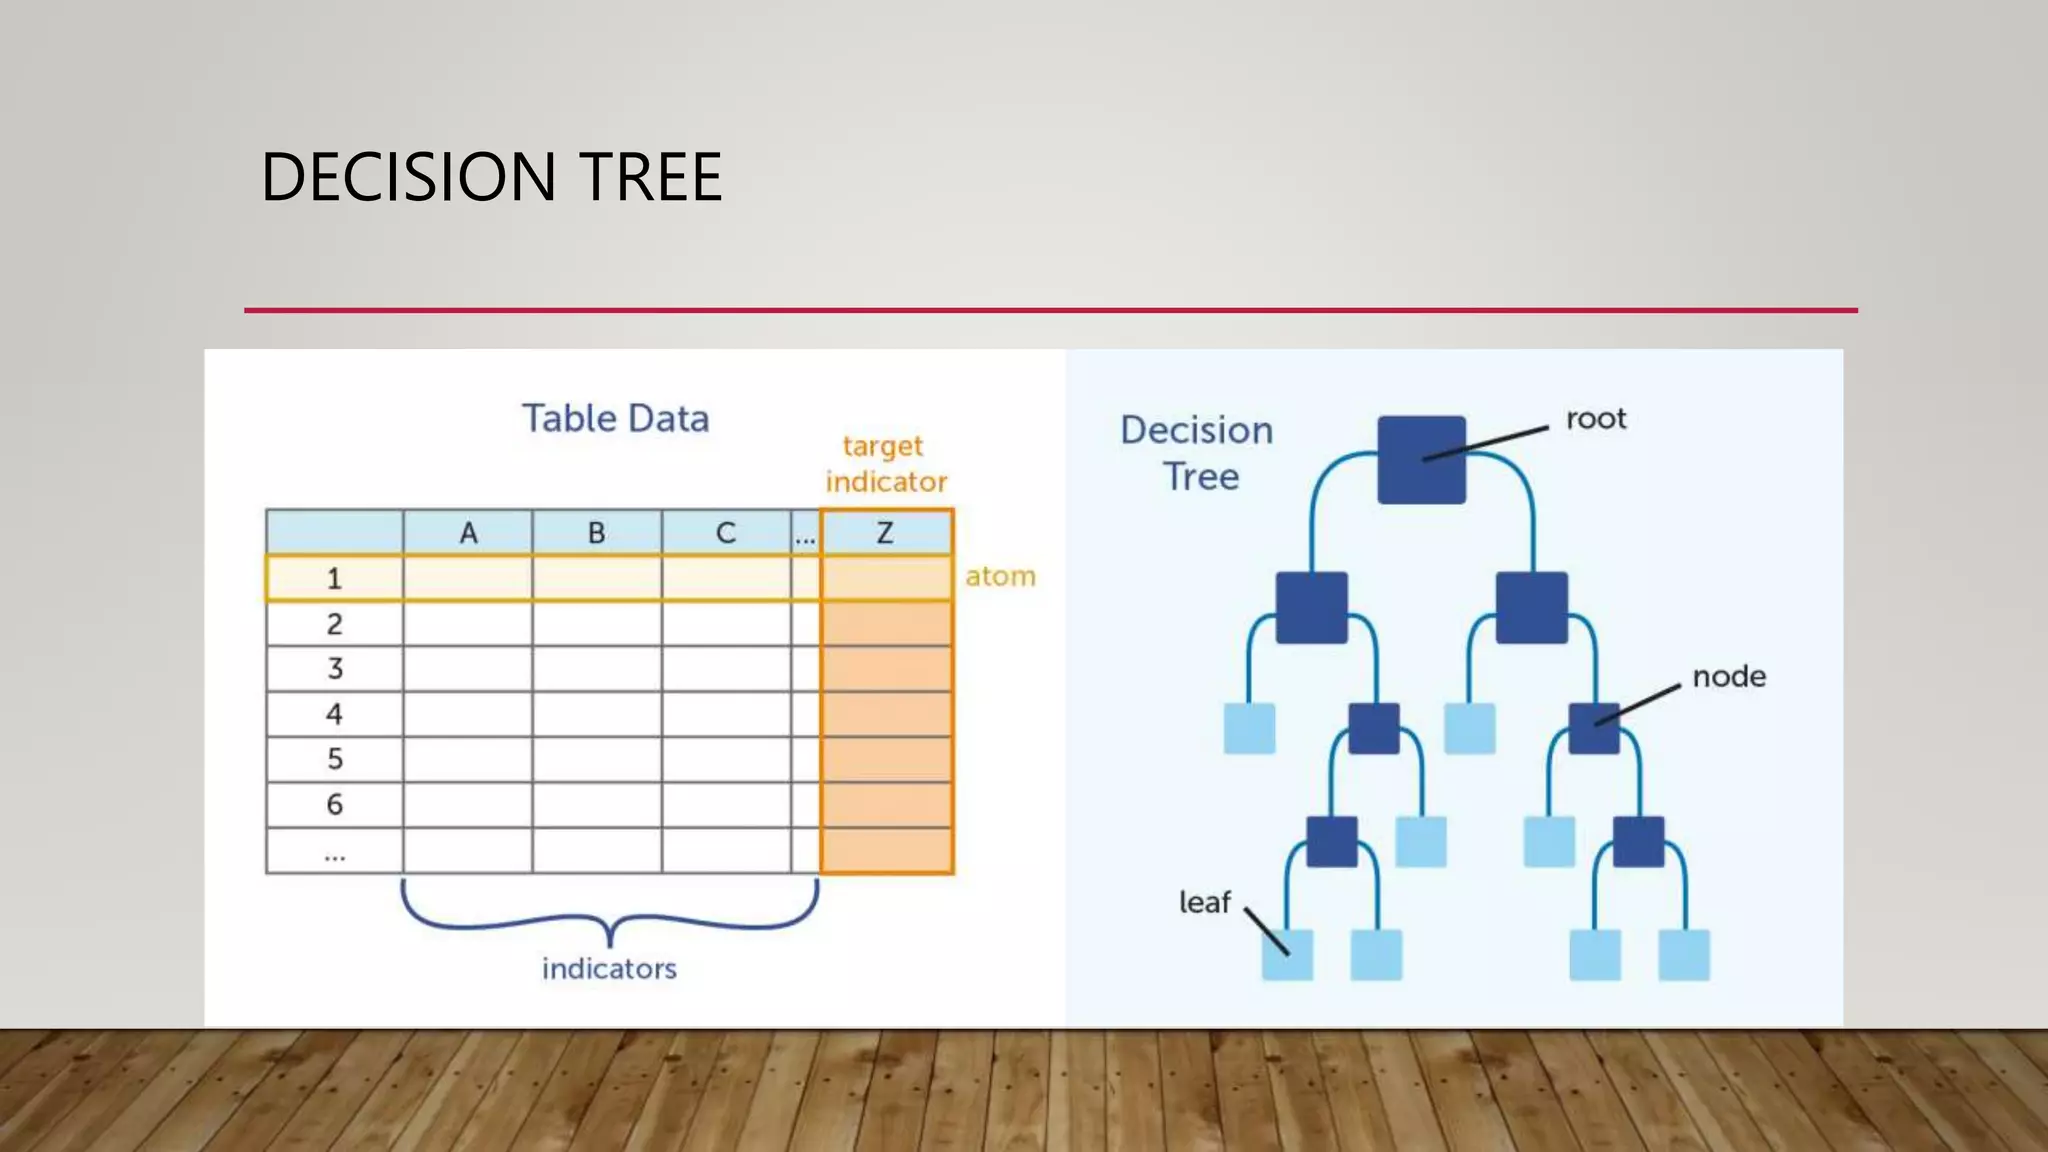
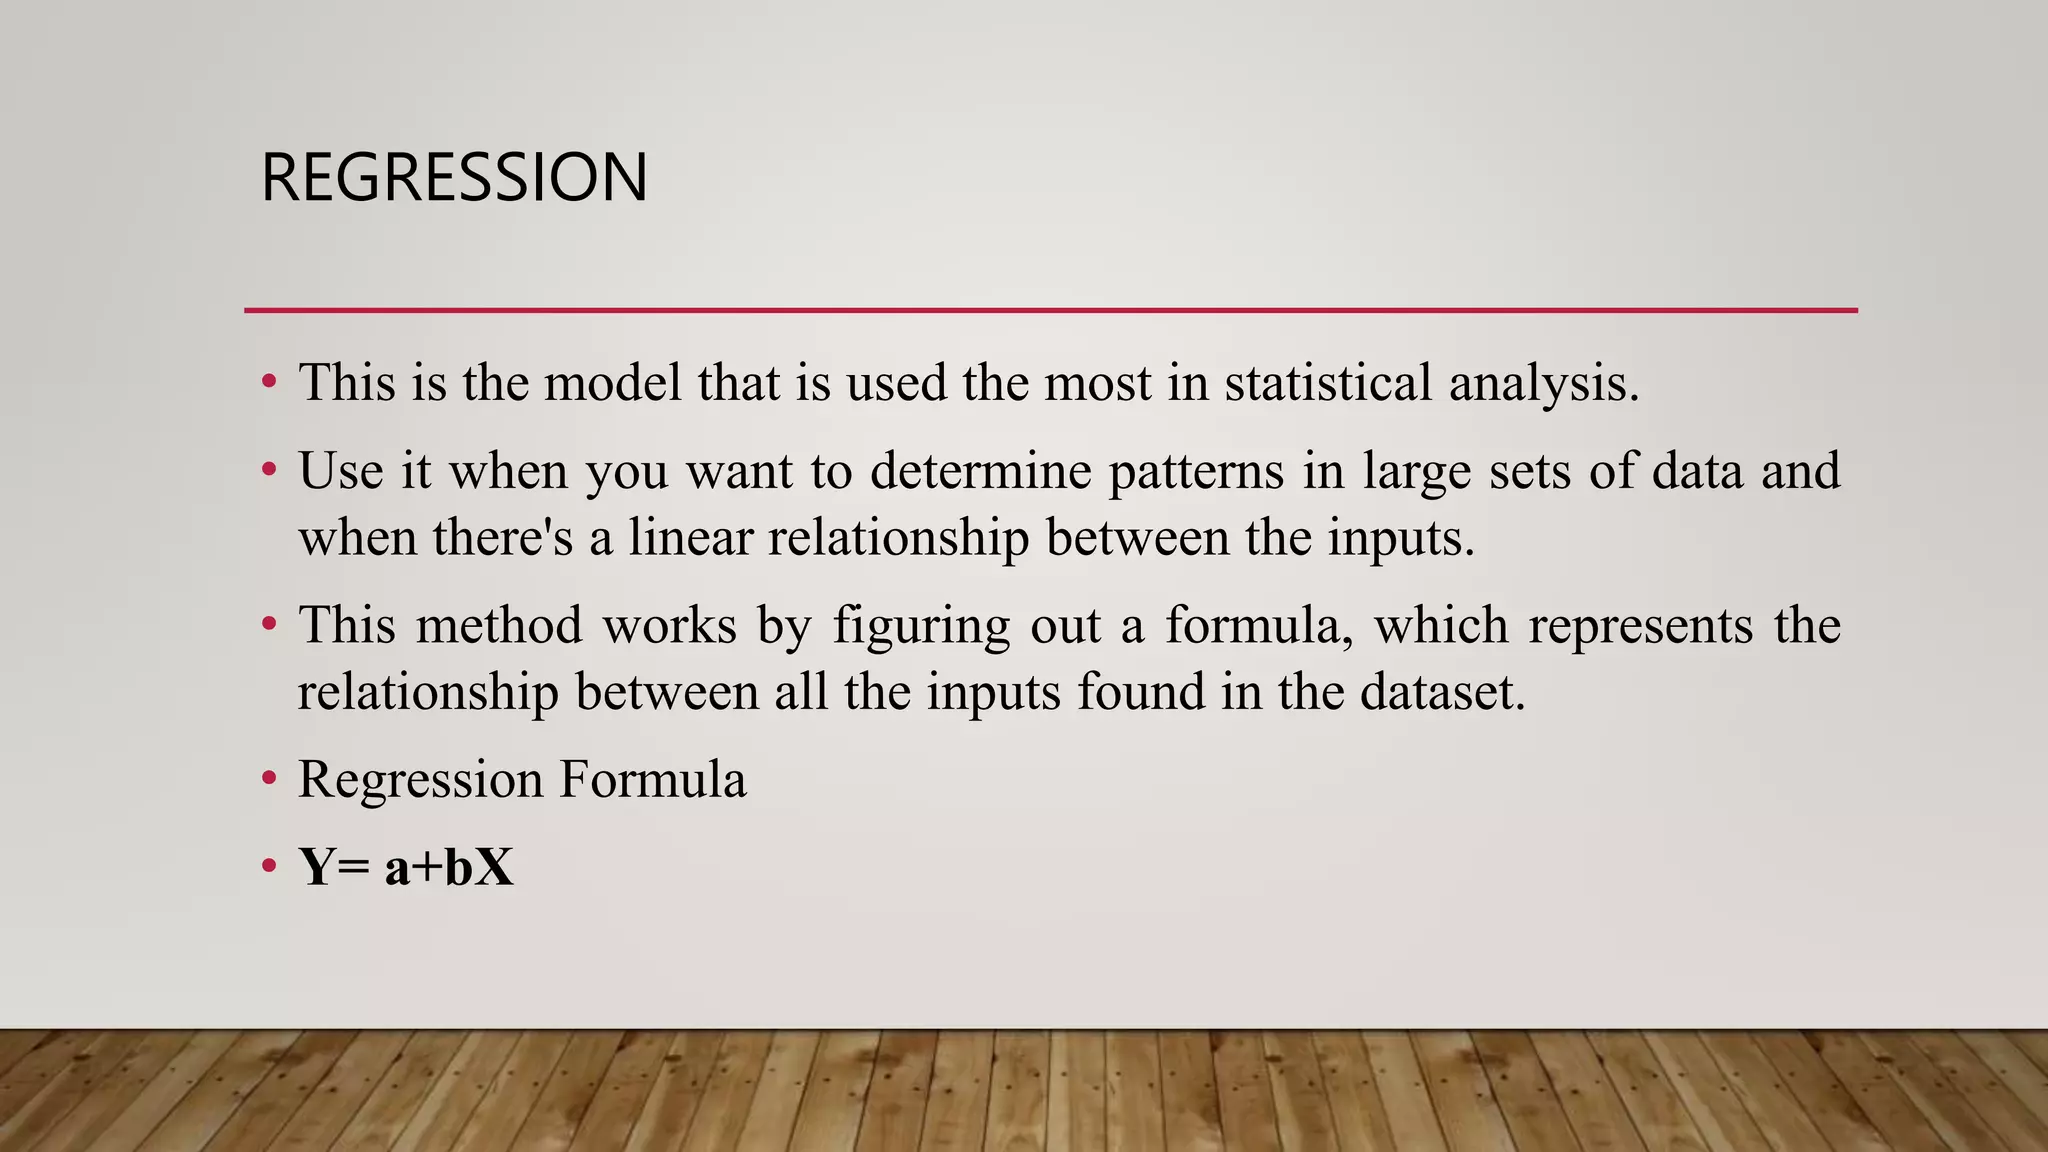
Covers methodologies such as Decision Trees, Regression analysis, and introduction to neural networks for predictive analytics.
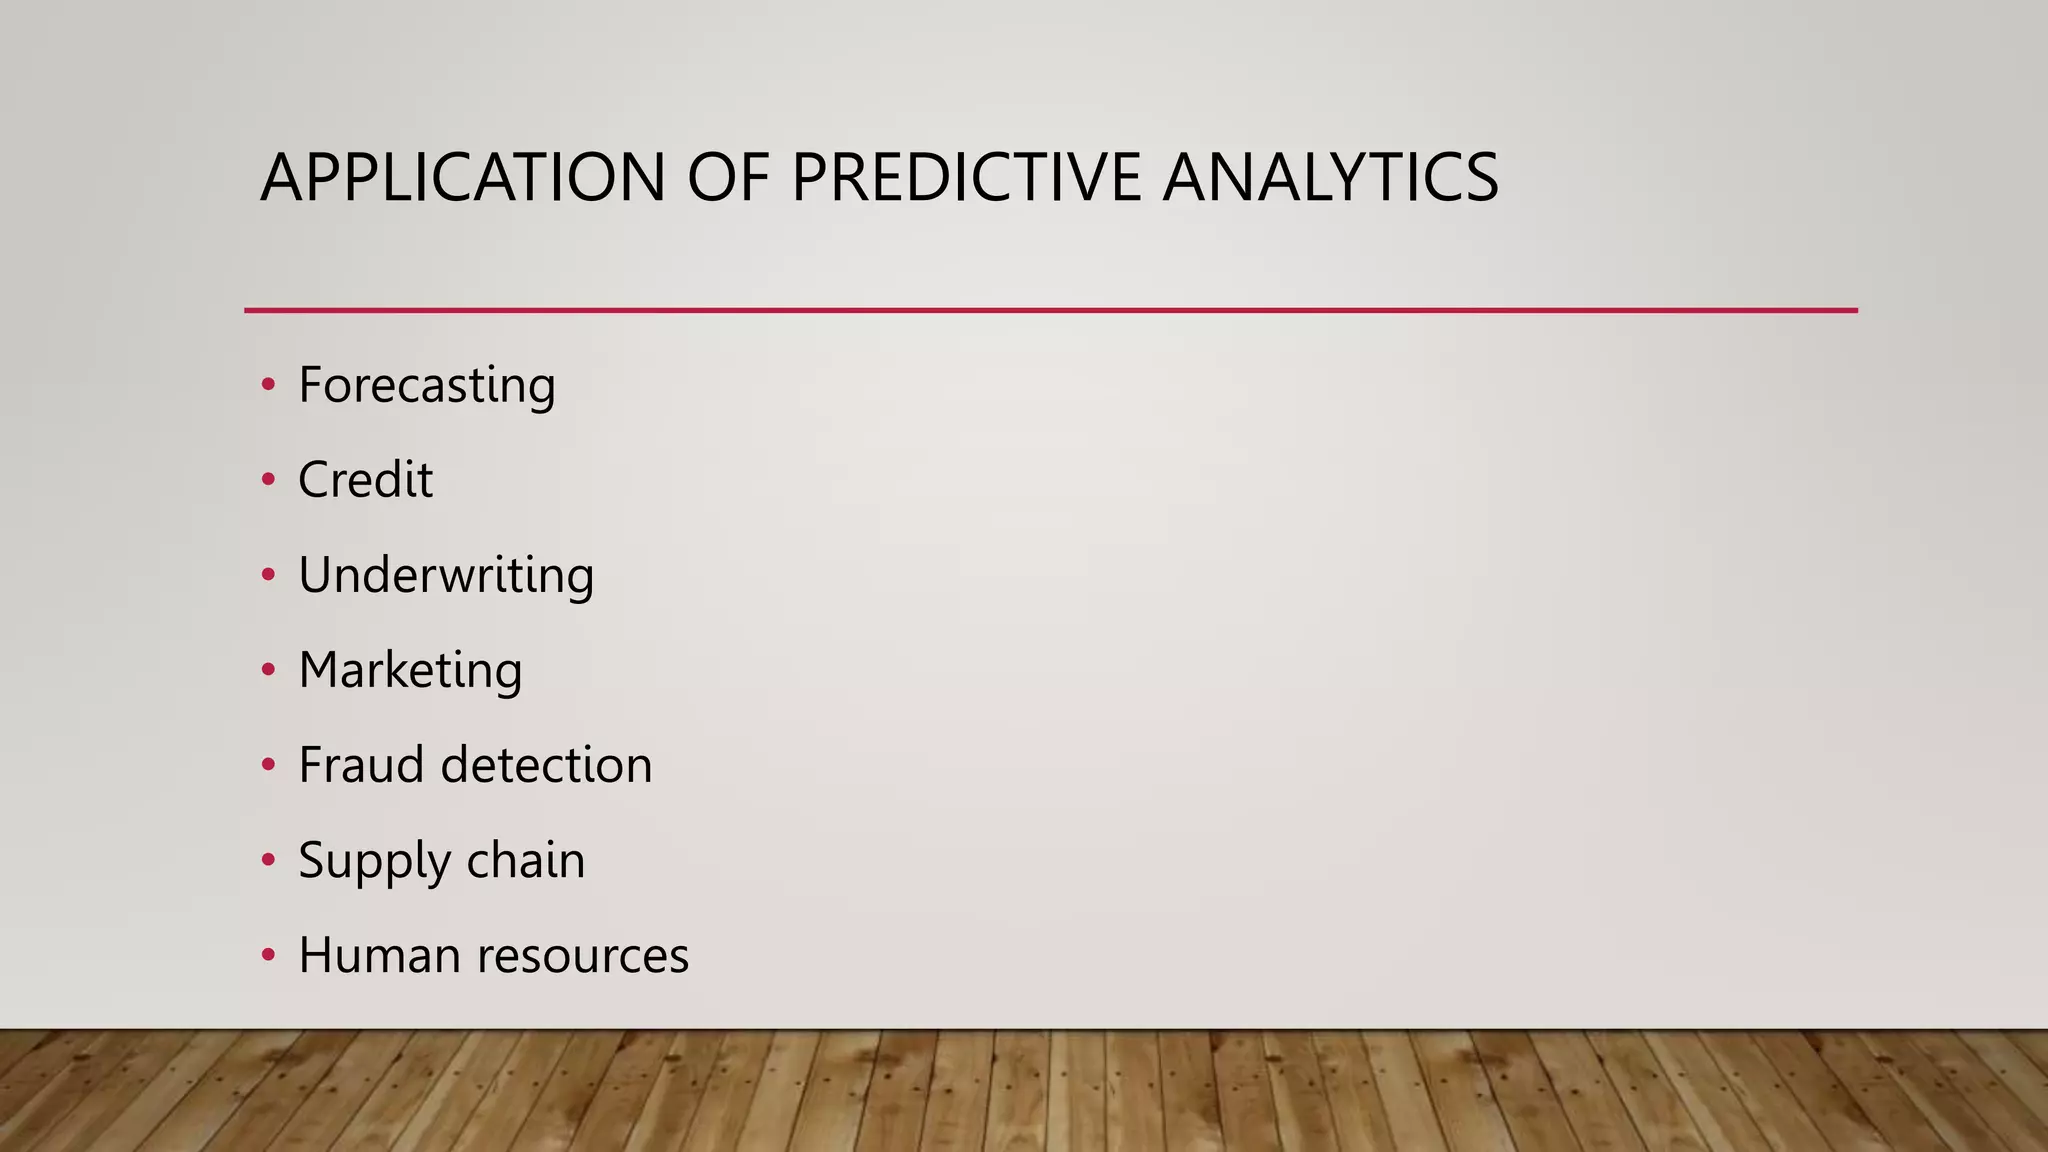
Applications in forecasting, marketing, and fraud detection, along with advantages of risk reduction and limitations.
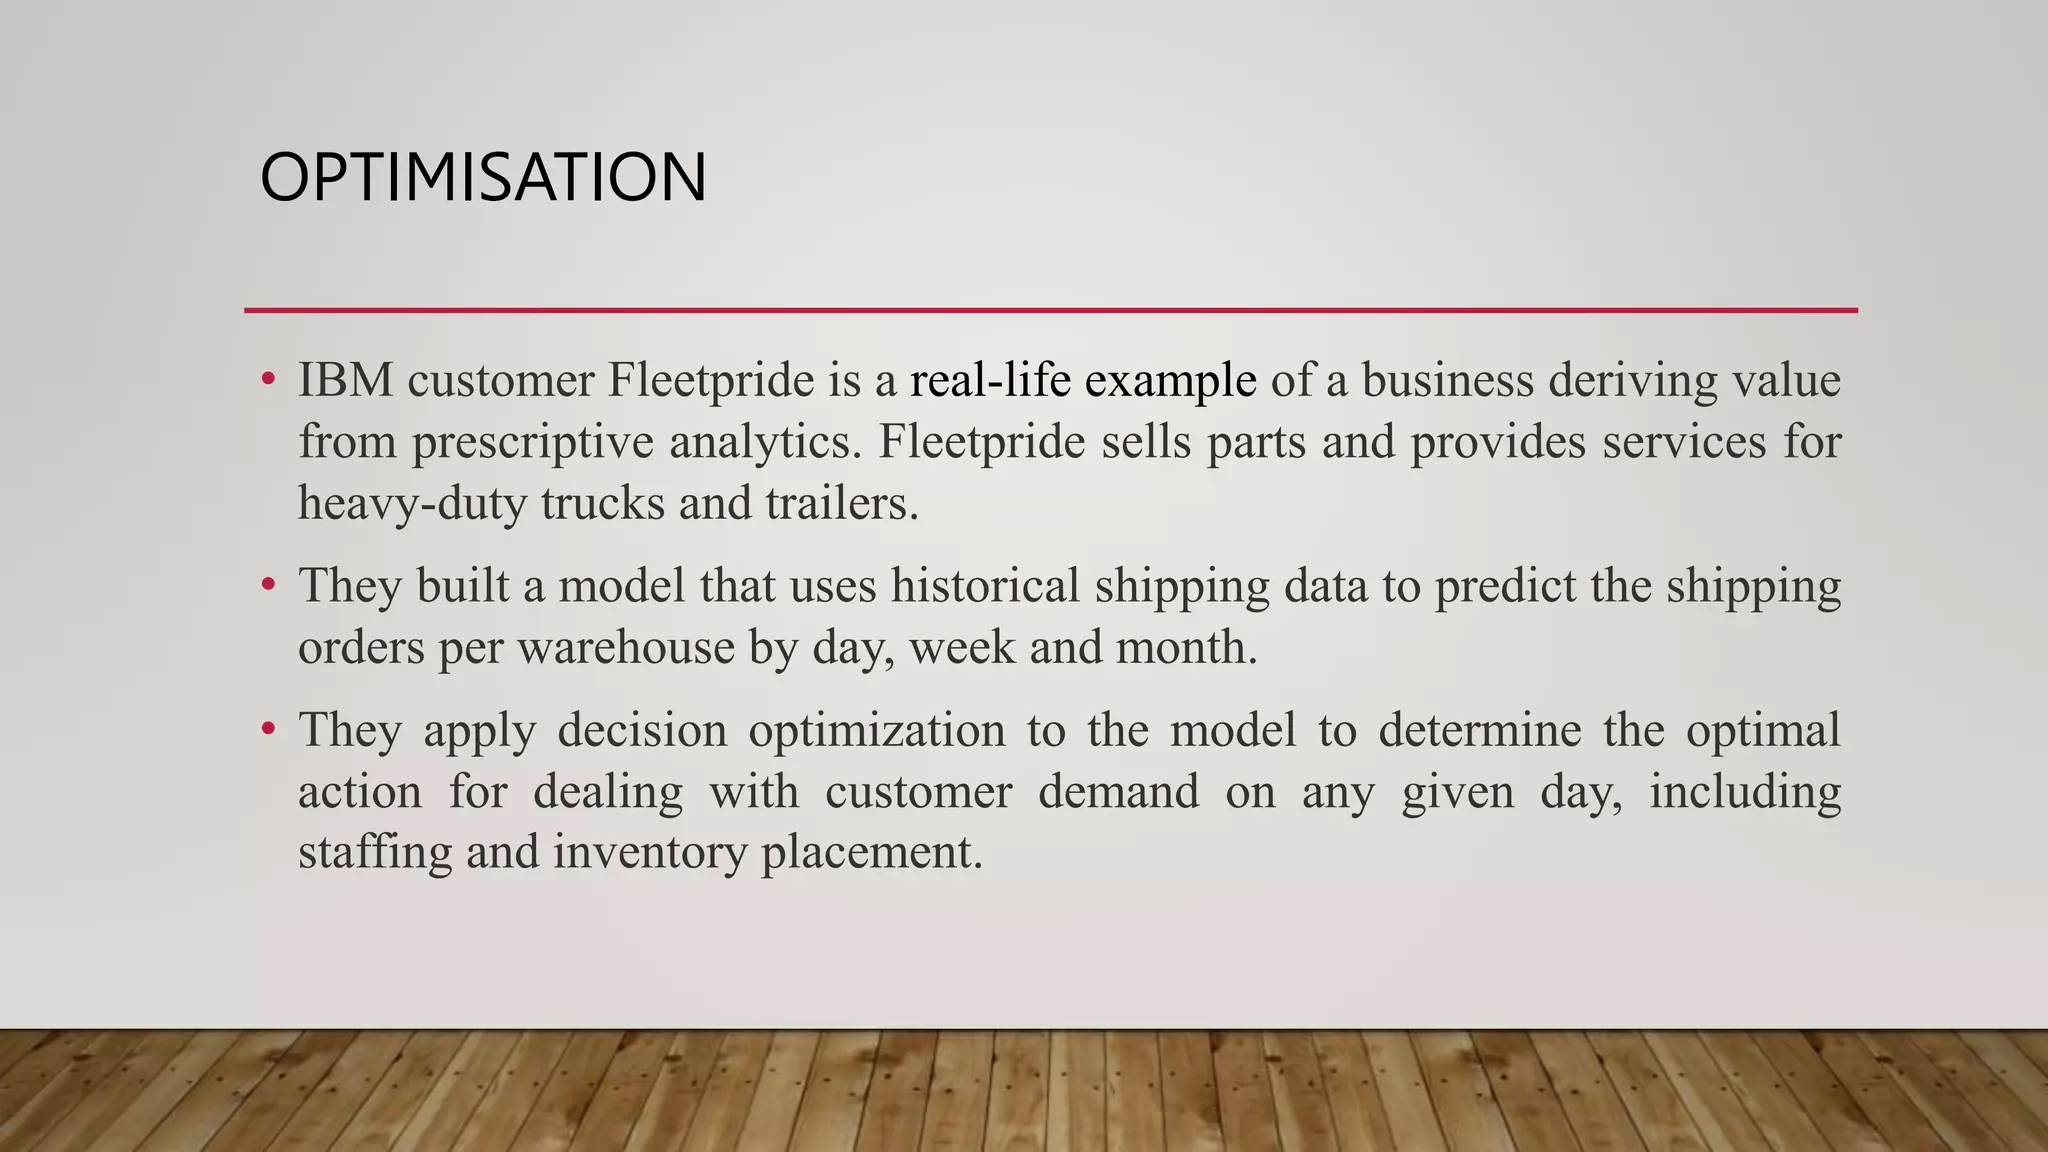
Prescriptive analytics focuses on recommending actions based on data analysis to achieve specific business objectives.
Key processes include defining questions, gathering data, developing models, deploying them, and taking action based on recommendations.
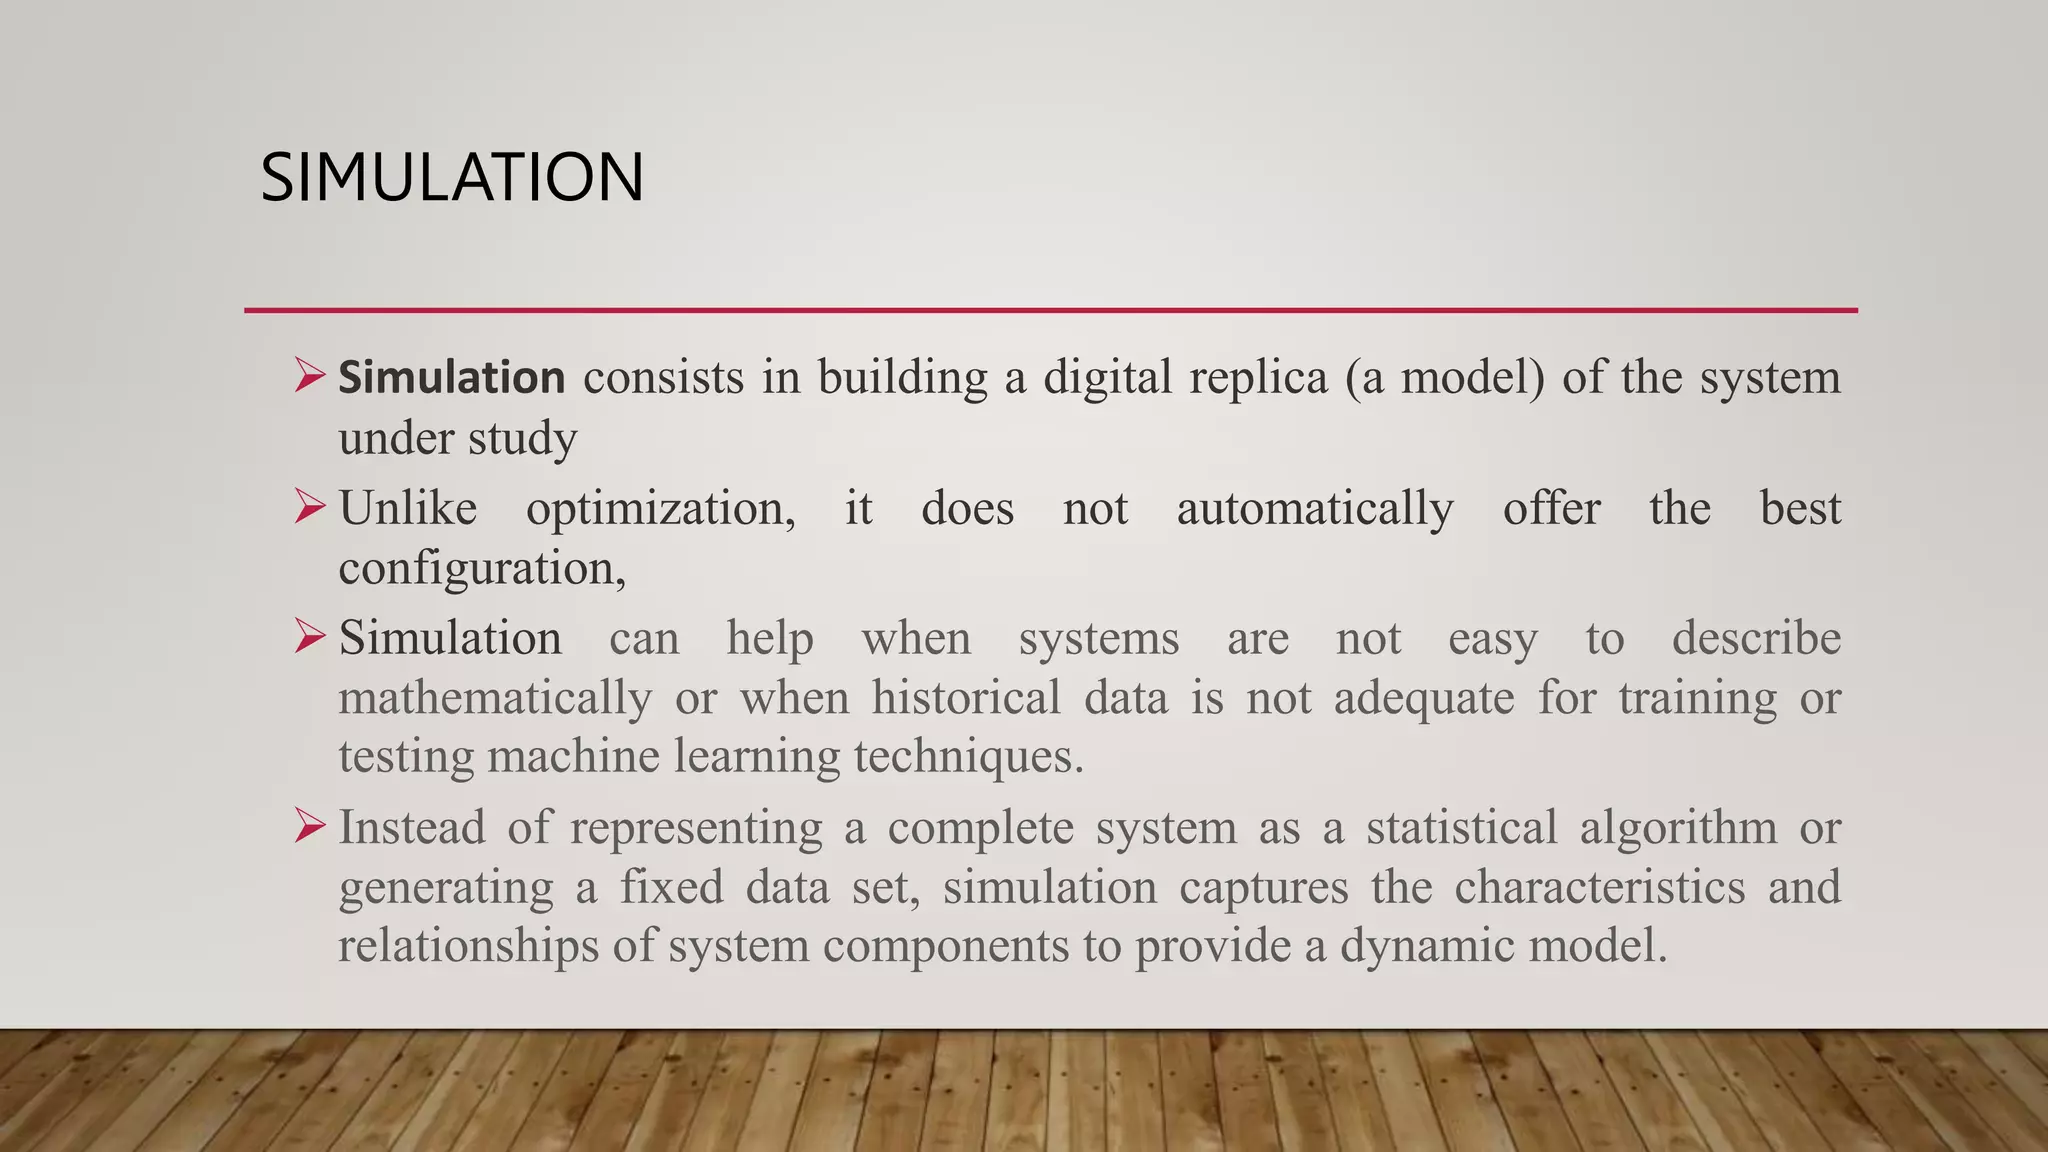
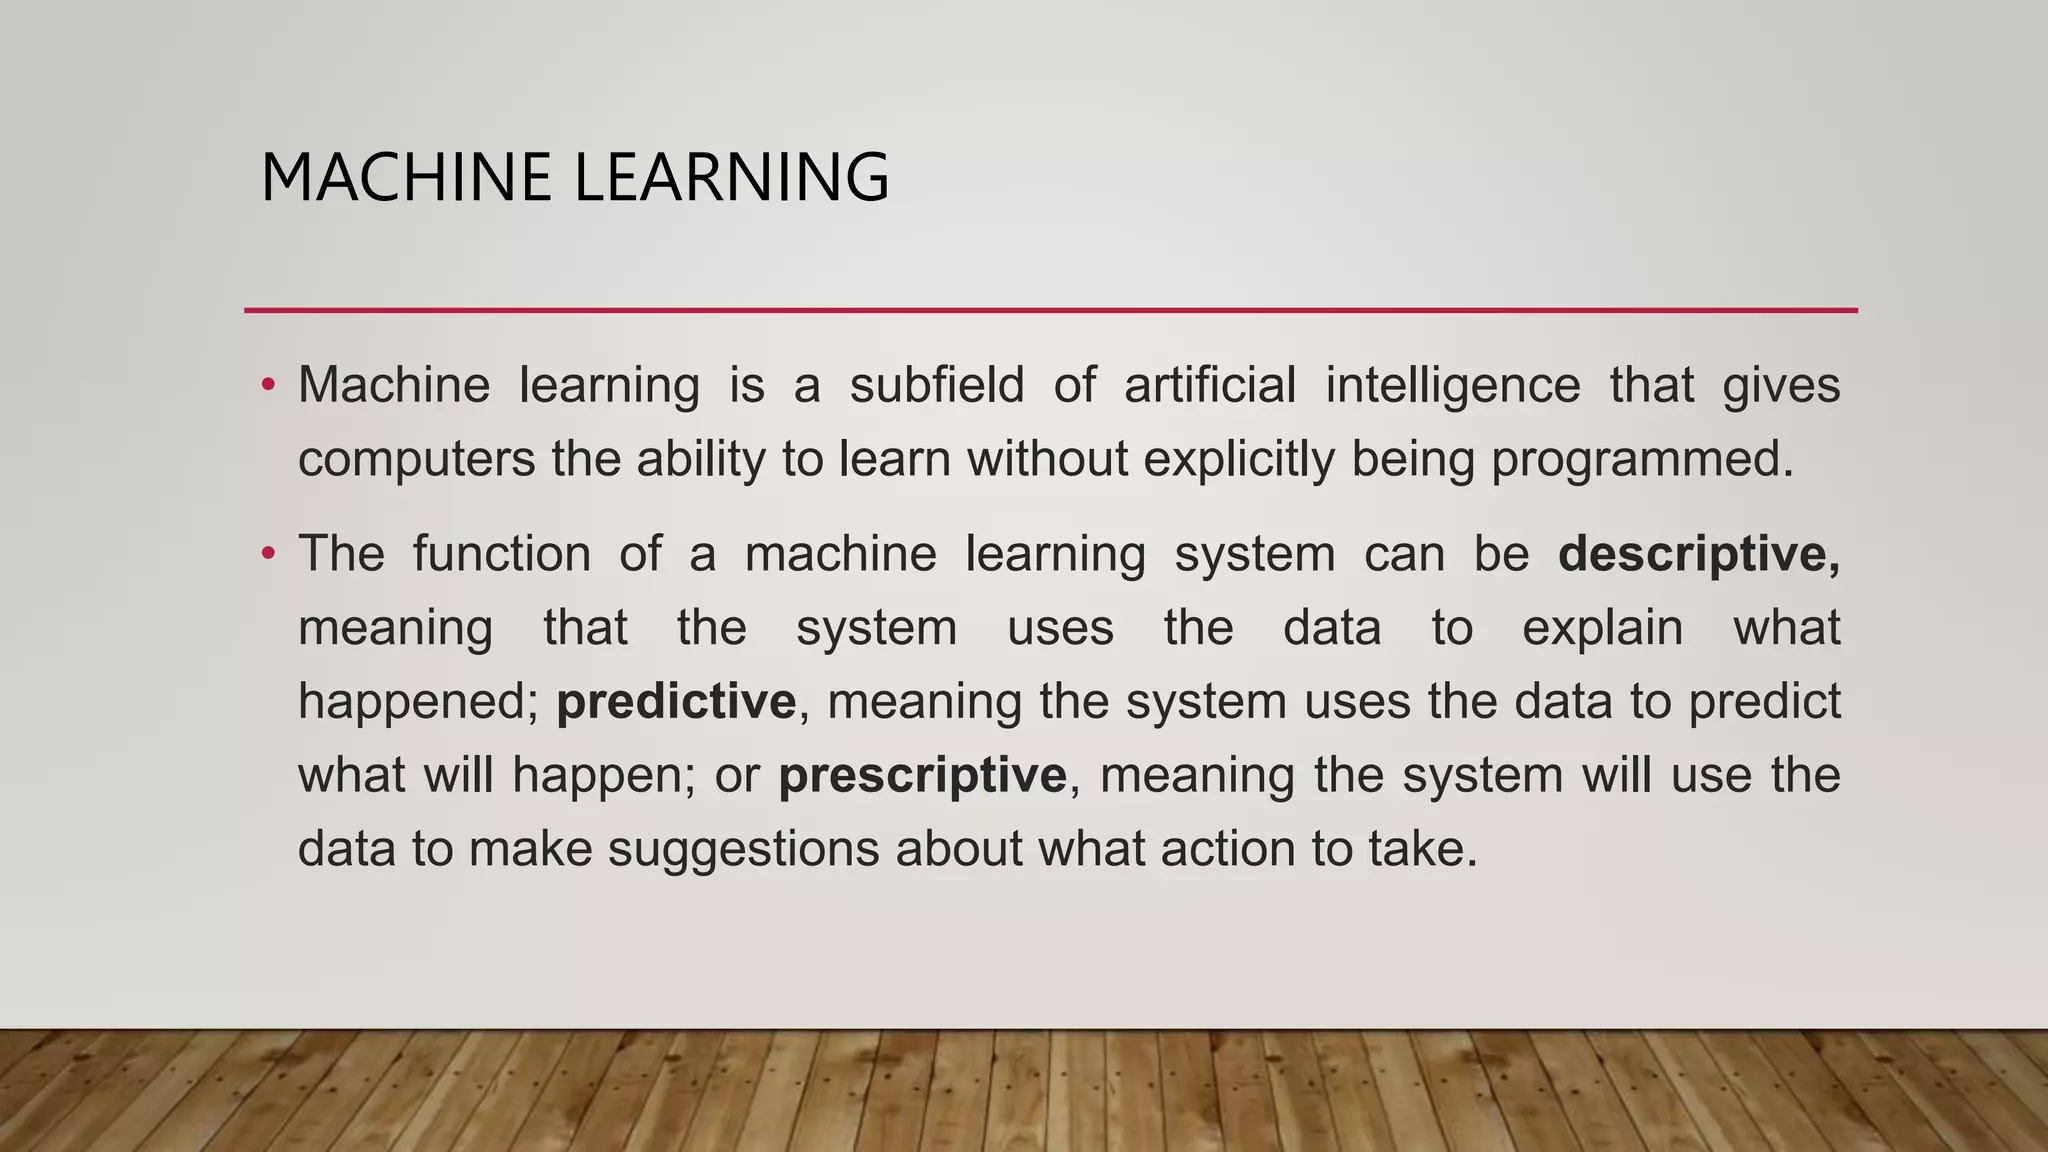
Techniques like optimization, simulation, and machine learning for implementing prescriptive analytics in business.
Benefits like enhanced decision-making and efficiency, alongside drawbacks such as reliance on correct question formulation.