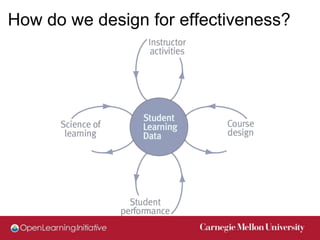
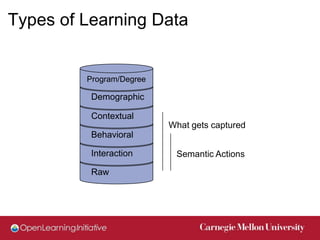
Data Driven Continuous
Improvement

John Rinderle   @JohnRinderle
Norman Bier     @NormanBier
Outcomes for Today
By the end of this session you will be able to…
• Explain the value of a data driven approach.
• Implement design strategies that facilitate
  meaningful data capture and use.
• Avoid commonly pitfalls in the use of
  learning data.
• Share strategies for data driven improvement
  with your project team.
• Explain the data collected and analysis tools
  available to co-development and platform+.
Infinite Points of Light
Infinite Proliferation

The 4 R’s
Reuse
Redistribute
Revise
Remix
Infinite Proliferation

The 4 R’s           NOT:
Reuse               Recreate
Redistribute
Revise
Remix               Add:
                    Evaluate
The problems of variety

• Quality is highly variable
• Much duplication of effort
• Difficult to choose appropriately
• Hard to evaluate
• Impossible to improve
• Hard to scale success up
Effectiveness
Can be hit or miss
Effectiveness


     Demonstrably support students in meeting
   articulated, measurable learning outcomes in a
                 given set of contexts
How do we design for effectiveness?
The Course Design Triangle
                          Objectives
                          Descriptions of what students
                           should be able to do at the
                               end of the course
 Assessments
  Tasks that provide
feedback on students’
 knowledge and skills
                            Instructional Activities
                        Contexts and activities that foster
                                13
                         students’ active engagement in
                                     learning
Why Focus on Objectives?
       1. They communicate our intentions clearly to students
          and to colleagues.
       2. They provide a framework for selecting and
          organizing course content.
       3. They guide in decisions about assessment and
          evaluation methods.
       4. They provide a framework for selecting appropriate
          teaching and learning activities.
       5. They give students information for directing their
          learning efforts and monitoring their own progress.
                                                                                                    14
Based on A.H. Miller (1987), Course Design for University Lecturers. New York: Nichols Publishing.
Also see, C.I. Davidson & S. A. Ambrose (1994), The New Professor’s Handbook: A Guide to Teaching and Research in Engineering and Sciences.
         Bolton, MA: Anker Publishing Company Inc.
Why a “learner-centered”
approach?
 Learning results from what the student does and
 thinks and only from what the student does
 and thinks. The teacher can advance learning
 only by influencing what the student does to
 learn (Herb Simon, 2001).

 It’s not teaching that causes learning. Attempts
 by the learner to perform cause learning,
 dependent upon the quality of feedback and
 opportunities to use it (Grant Wiggins, 1993).
Learning Dashboard
Let’s Analyze Some Examples

Checklist: Is the objective…?
  •   Student centered (i.e., student should be able to…)
  •   Broken down into component skills (grain size)
  •   Phrased with an action verb
  •   Measurable
Here are some samples:
  •   Understand the U.S. stock market
  •   Recognize logical flaws in a written argument
  •   Appreciate the historical context of the 1940’s
                                        17


  •   Apply Newton’s Second Law appropriately
Scenario #1: Early Enrollment vs.
Performance
                     Success by Enrollment Date


     1   2   3   4   5   6     7      8     9     10      11   12   13   14   15   16
                             Days Before Semester Start
Data needs to be actionable!


                   19
Scenario #2: Psychology Pilot
“liking” ≠ learning


               21
Types of Learning Data


         Program/Degree

          Demographic

          Contextual
                          What gets captured
          Behavioral

          Interaction      Semantic Actions

          Raw
Learning Curve Analysis


DataShop: Pittsburgh Science of Learning Center
Other Learning Curves
learnig


DataShop: Pittsburgh Science of Learning Center
1.2


 1


0.8


0.6


0.4

      Activites 1st Try Correct
0.2   Activities Eventually Correct
      Assessment Correct

 0
Other Metrics
            Engaged     Didn’t Engage

College   Pass   Fail   Pass     Fail

 CFA      87%    13%    36%     64%
  CIT     98%    2%     81%     19%
 CMU      100%   0%     67%     33%
 HSS      98%    1%     58%     42%
 MCS      96%    4%     75%     25%
 SCS      99%    1%     83%     17%
 TSB      98%    2%     69%     31%
 Total    96%    4%     67%     33%
A Virtuous Cycle

        Educational
        Technology             Data
         & Practice


                      Theory
Share Alike and Share Data

Data Driven Continuous Improvement

  • 1.
    Data Driven Continuous Improvement JohnRinderle @JohnRinderle Norman Bier @NormanBier
  • 2.
    Outcomes for Today Bythe end of this session you will be able to… • Explain the value of a data driven approach. • Implement design strategies that facilitate meaningful data capture and use. • Avoid commonly pitfalls in the use of learning data. • Share strategies for data driven improvement with your project team. • Explain the data collected and analysis tools available to co-development and platform+.
  • 3.
  • 4.
  • 5.
  • 6.
  • 7.
    Infinite Proliferation The 4R’s Reuse Redistribute Revise Remix
  • 8.
    Infinite Proliferation The 4R’s NOT: Reuse Recreate Redistribute Revise Remix Add: Evaluate
  • 9.
    The problems ofvariety • Quality is highly variable • Much duplication of effort • Difficult to choose appropriately • Hard to evaluate • Impossible to improve • Hard to scale success up
  • 10.
  • 11.
    Effectiveness Demonstrably support students in meeting articulated, measurable learning outcomes in a given set of contexts
  • 12.
    How do wedesign for effectiveness?
  • 13.
    The Course DesignTriangle Objectives Descriptions of what students should be able to do at the end of the course Assessments Tasks that provide feedback on students’ knowledge and skills Instructional Activities Contexts and activities that foster 13 students’ active engagement in learning
  • 14.
    Why Focus onObjectives? 1. They communicate our intentions clearly to students and to colleagues. 2. They provide a framework for selecting and organizing course content. 3. They guide in decisions about assessment and evaluation methods. 4. They provide a framework for selecting appropriate teaching and learning activities. 5. They give students information for directing their learning efforts and monitoring their own progress. 14 Based on A.H. Miller (1987), Course Design for University Lecturers. New York: Nichols Publishing. Also see, C.I. Davidson & S. A. Ambrose (1994), The New Professor’s Handbook: A Guide to Teaching and Research in Engineering and Sciences. Bolton, MA: Anker Publishing Company Inc.
  • 15.
    Why a “learner-centered” approach? Learning results from what the student does and thinks and only from what the student does and thinks. The teacher can advance learning only by influencing what the student does to learn (Herb Simon, 2001). It’s not teaching that causes learning. Attempts by the learner to perform cause learning, dependent upon the quality of feedback and opportunities to use it (Grant Wiggins, 1993).
  • 16.
  • 17.
    Let’s Analyze SomeExamples Checklist: Is the objective…? • Student centered (i.e., student should be able to…) • Broken down into component skills (grain size) • Phrased with an action verb • Measurable Here are some samples: • Understand the U.S. stock market • Recognize logical flaws in a written argument • Appreciate the historical context of the 1940’s 17 • Apply Newton’s Second Law appropriately
  • 18.
    Scenario #1: EarlyEnrollment vs. Performance Success by Enrollment Date 1 2 3 4 5 6 7 8 9 10 11 12 13 14 15 16 Days Before Semester Start
  • 19.
    Data needs tobe actionable! 19
  • 20.
  • 21.
  • 22.
    Types of LearningData Program/Degree Demographic Contextual What gets captured Behavioral Interaction Semantic Actions Raw
  • 23.
    Learning Curve Analysis DataShop:Pittsburgh Science of Learning Center
  • 24.
    Other Learning Curves learnig DataShop:Pittsburgh Science of Learning Center
  • 25.
    1.2 1 0.8 0.6 0.4 Activites 1st Try Correct 0.2 Activities Eventually Correct Assessment Correct 0
  • 26.
    Other Metrics Engaged Didn’t Engage College Pass Fail Pass Fail CFA 87% 13% 36% 64% CIT 98% 2% 81% 19% CMU 100% 0% 67% 33% HSS 98% 1% 58% 42% MCS 96% 4% 75% 25% SCS 99% 1% 83% 17% TSB 98% 2% 69% 31% Total 96% 4% 67% 33%
  • 27.
    A Virtuous Cycle Educational Technology Data & Practice Theory
  • 28.
    Share Alike andShare Data

Editor's Notes

  • #4 Making assumptions about data is difficult because of variety.
  • #6 Each OER is collecting and capturing different things or not collecting data at all.
  • #7 We need a basis of choice. How do I know if a resource will work with my students?
  • #17 Data needs to be actionable to guide student learning.