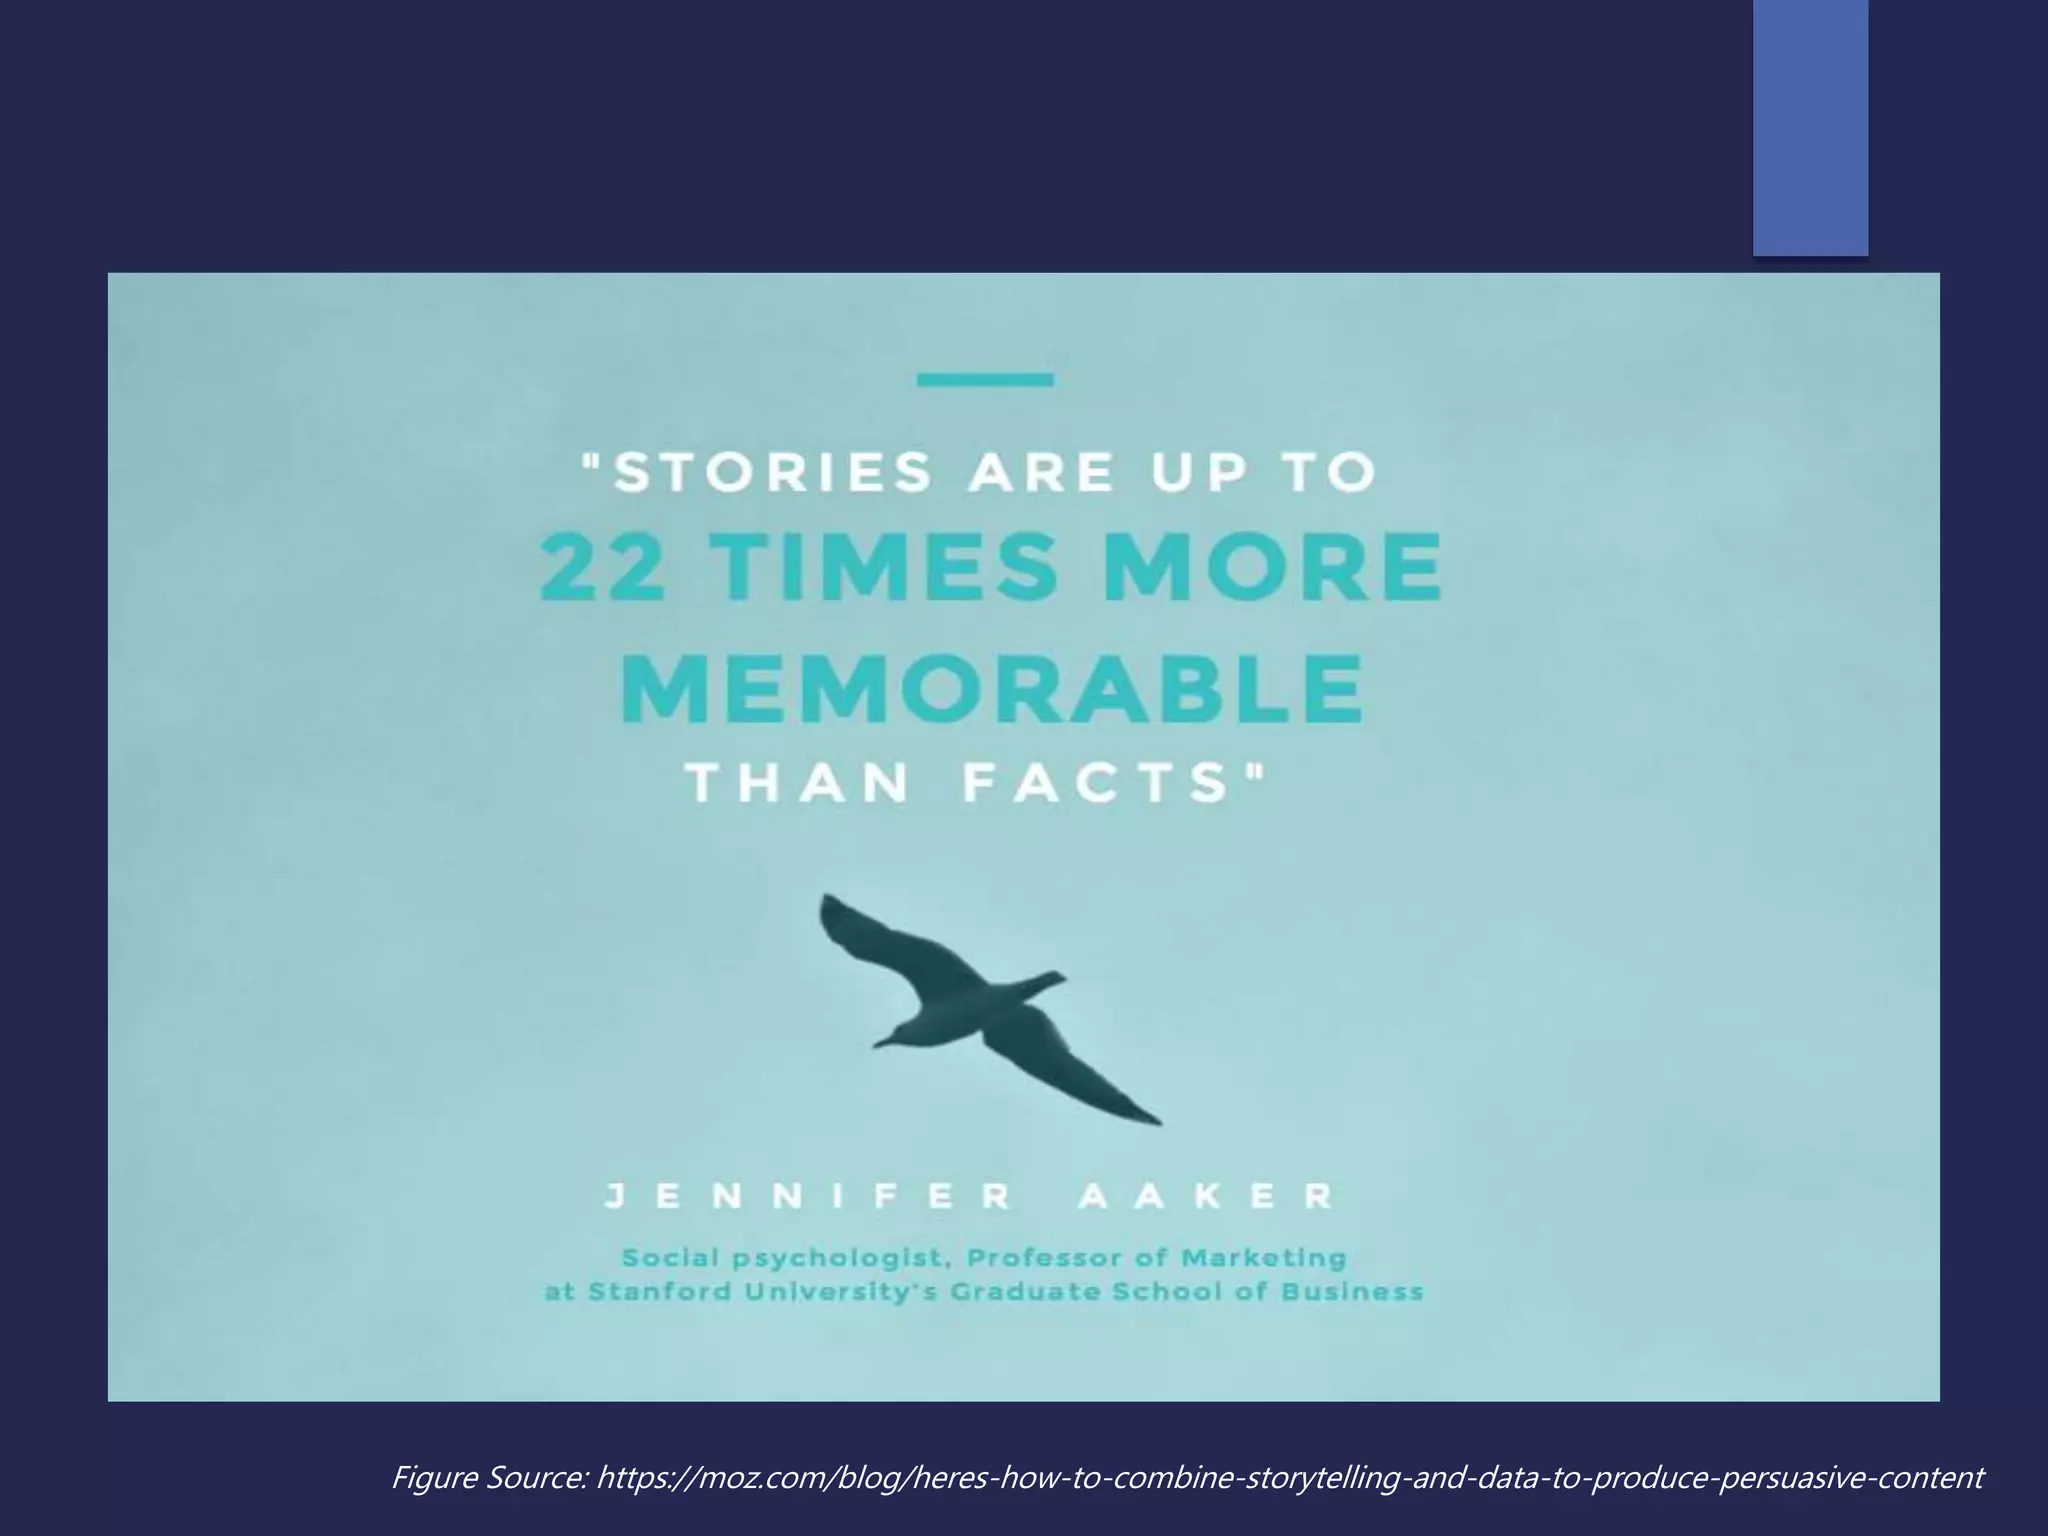
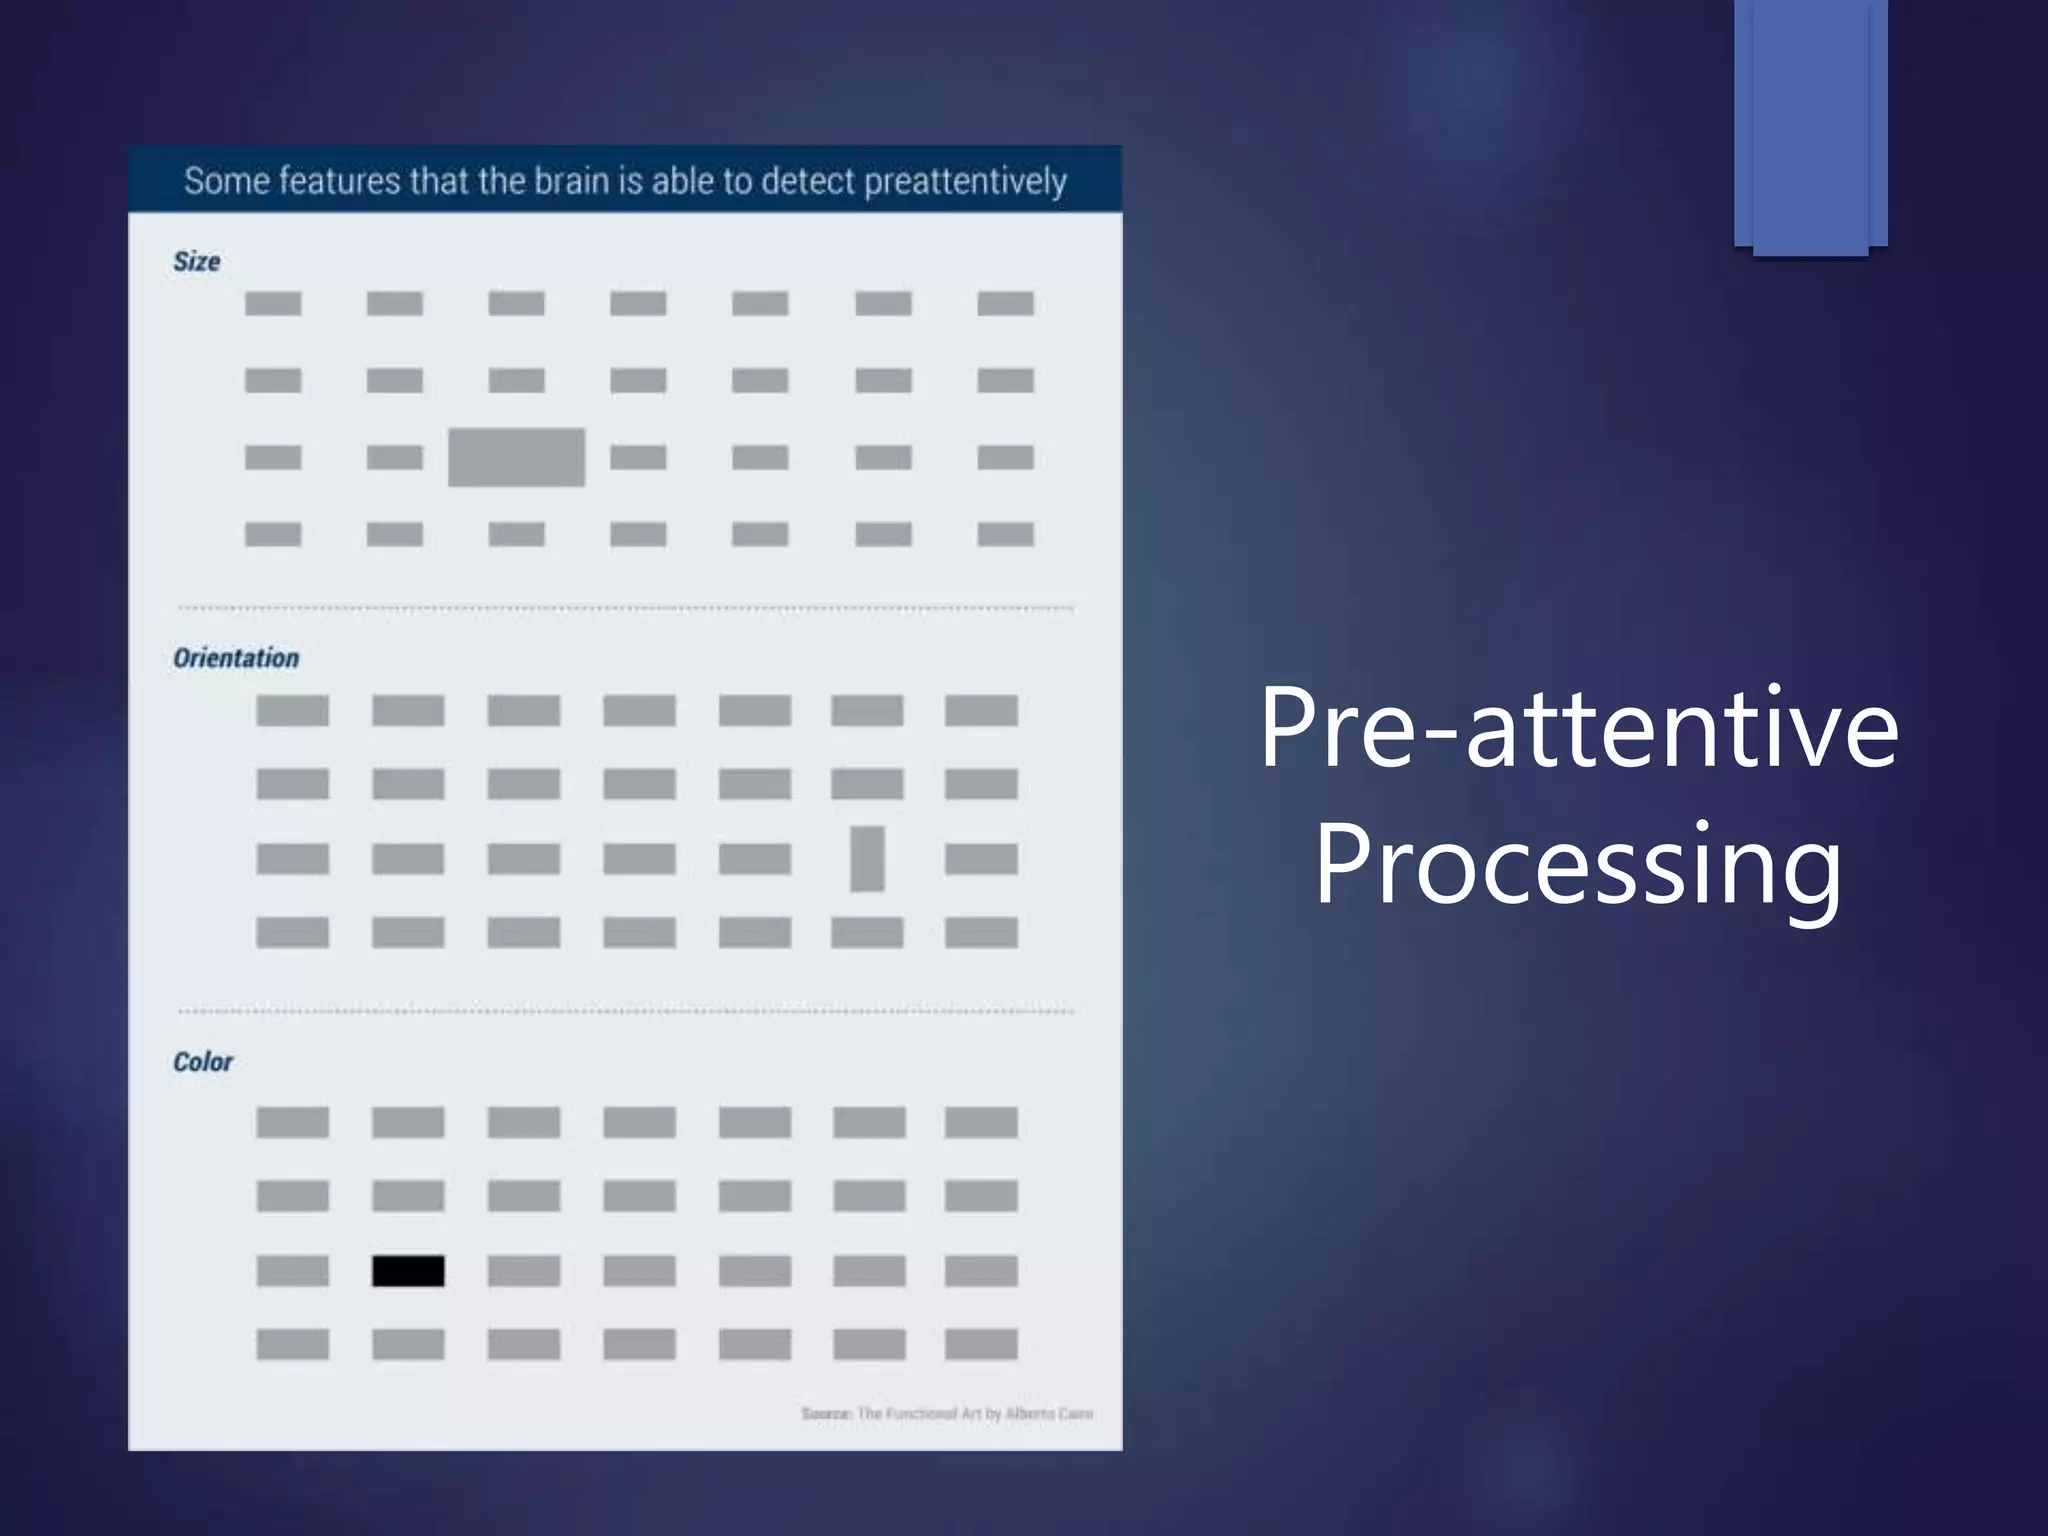
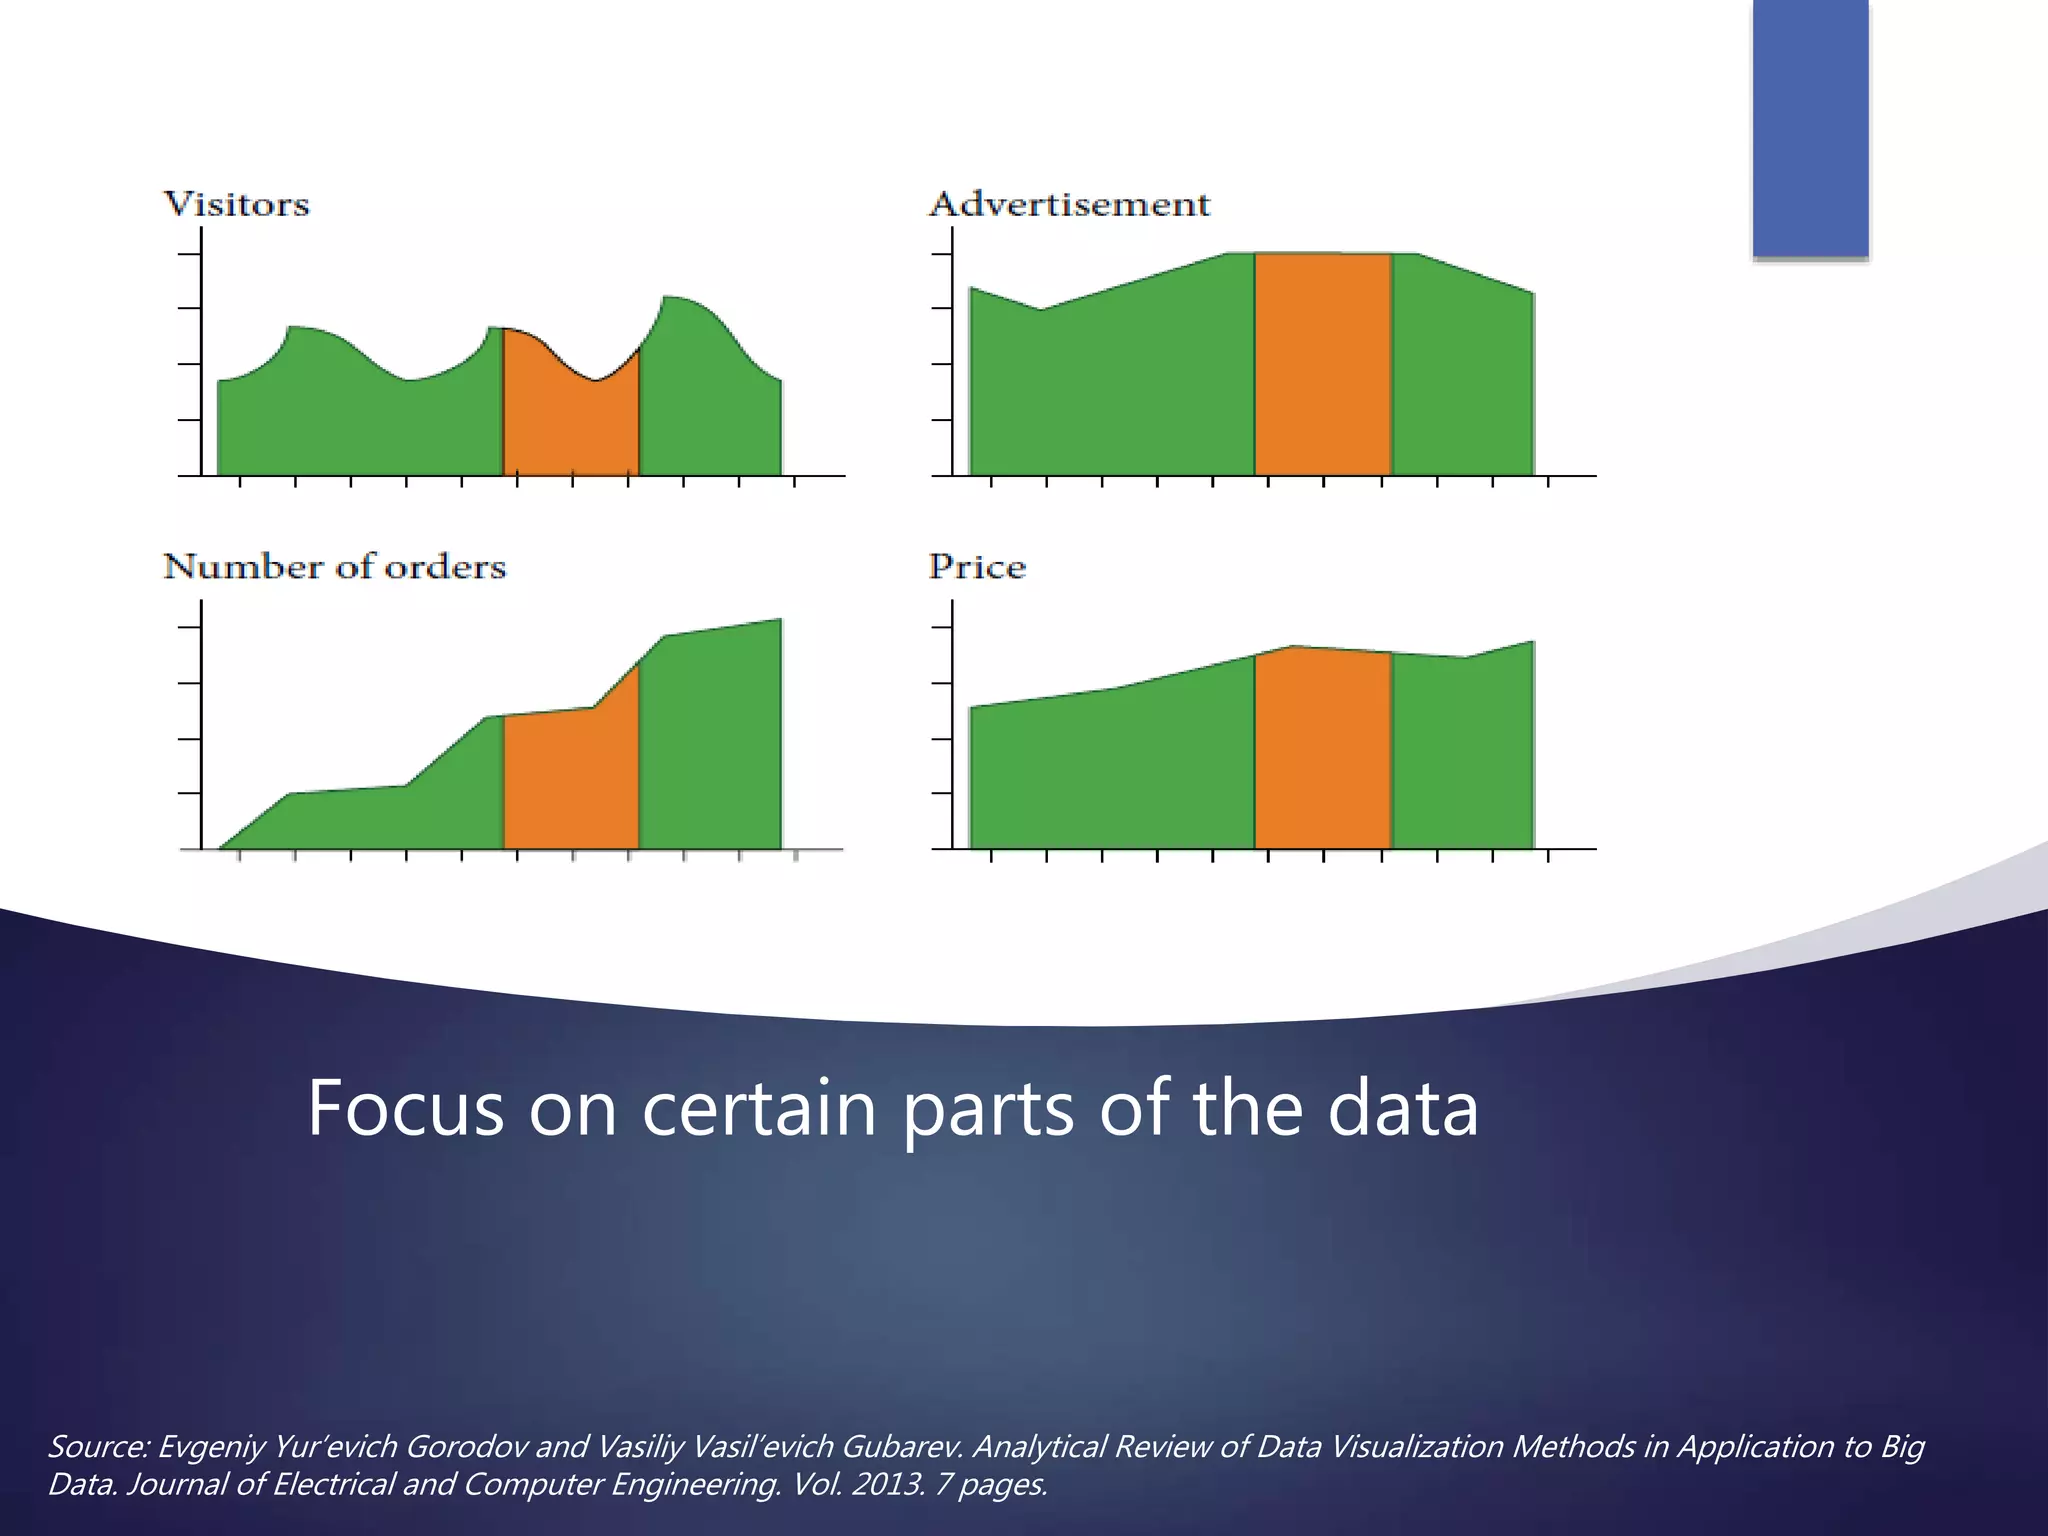
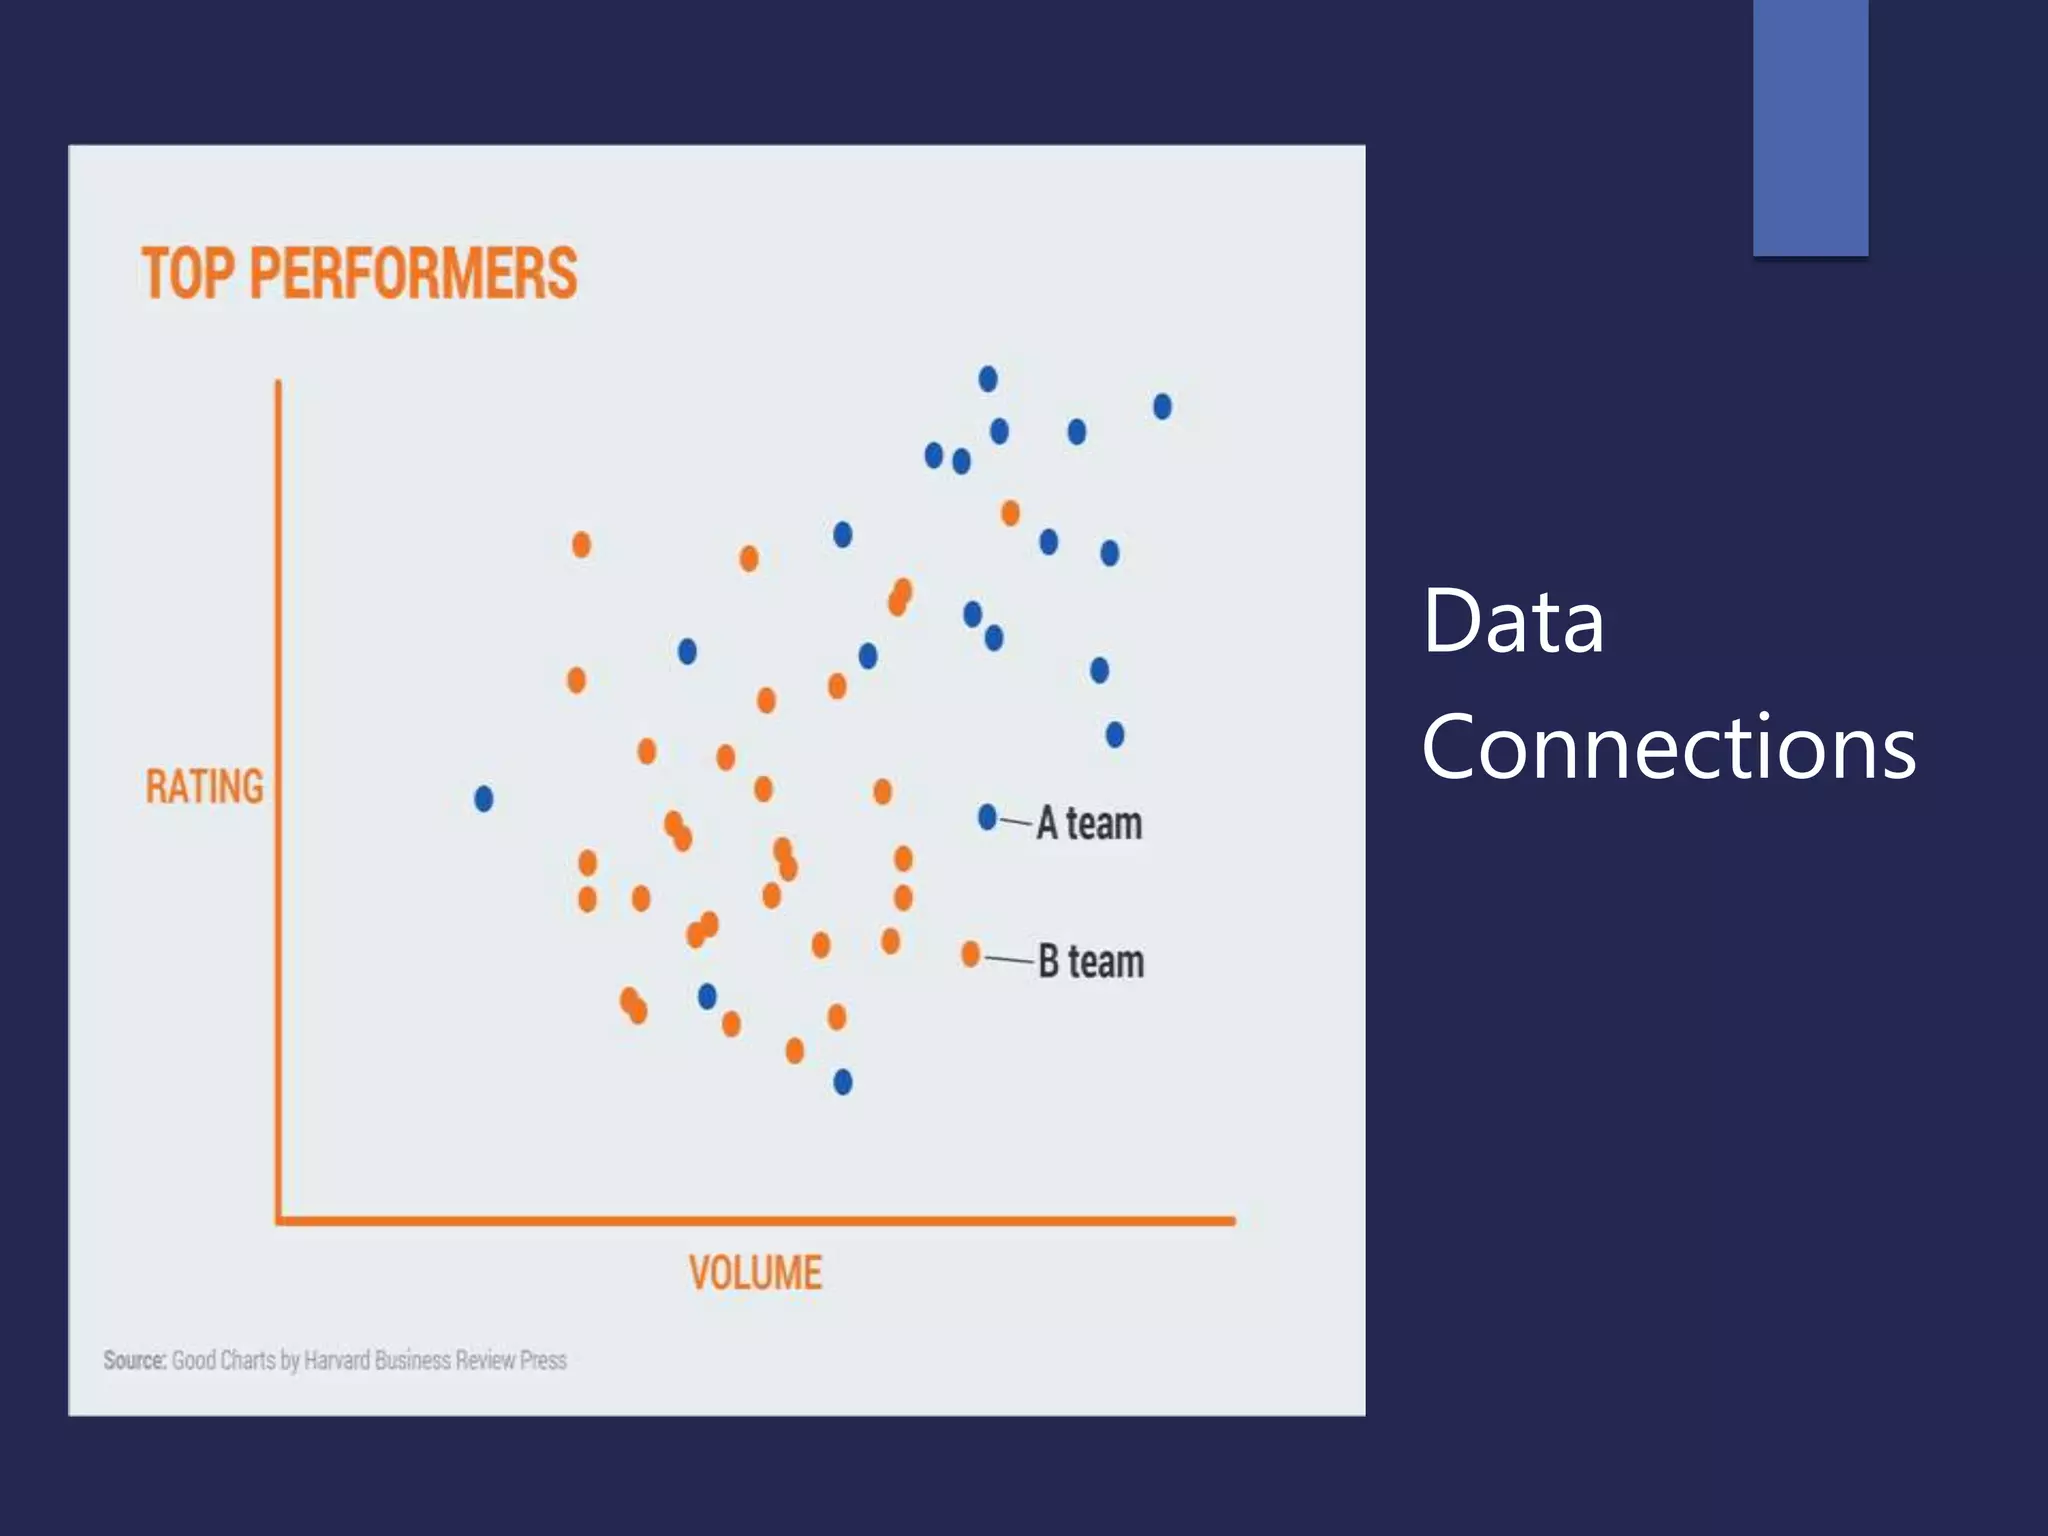
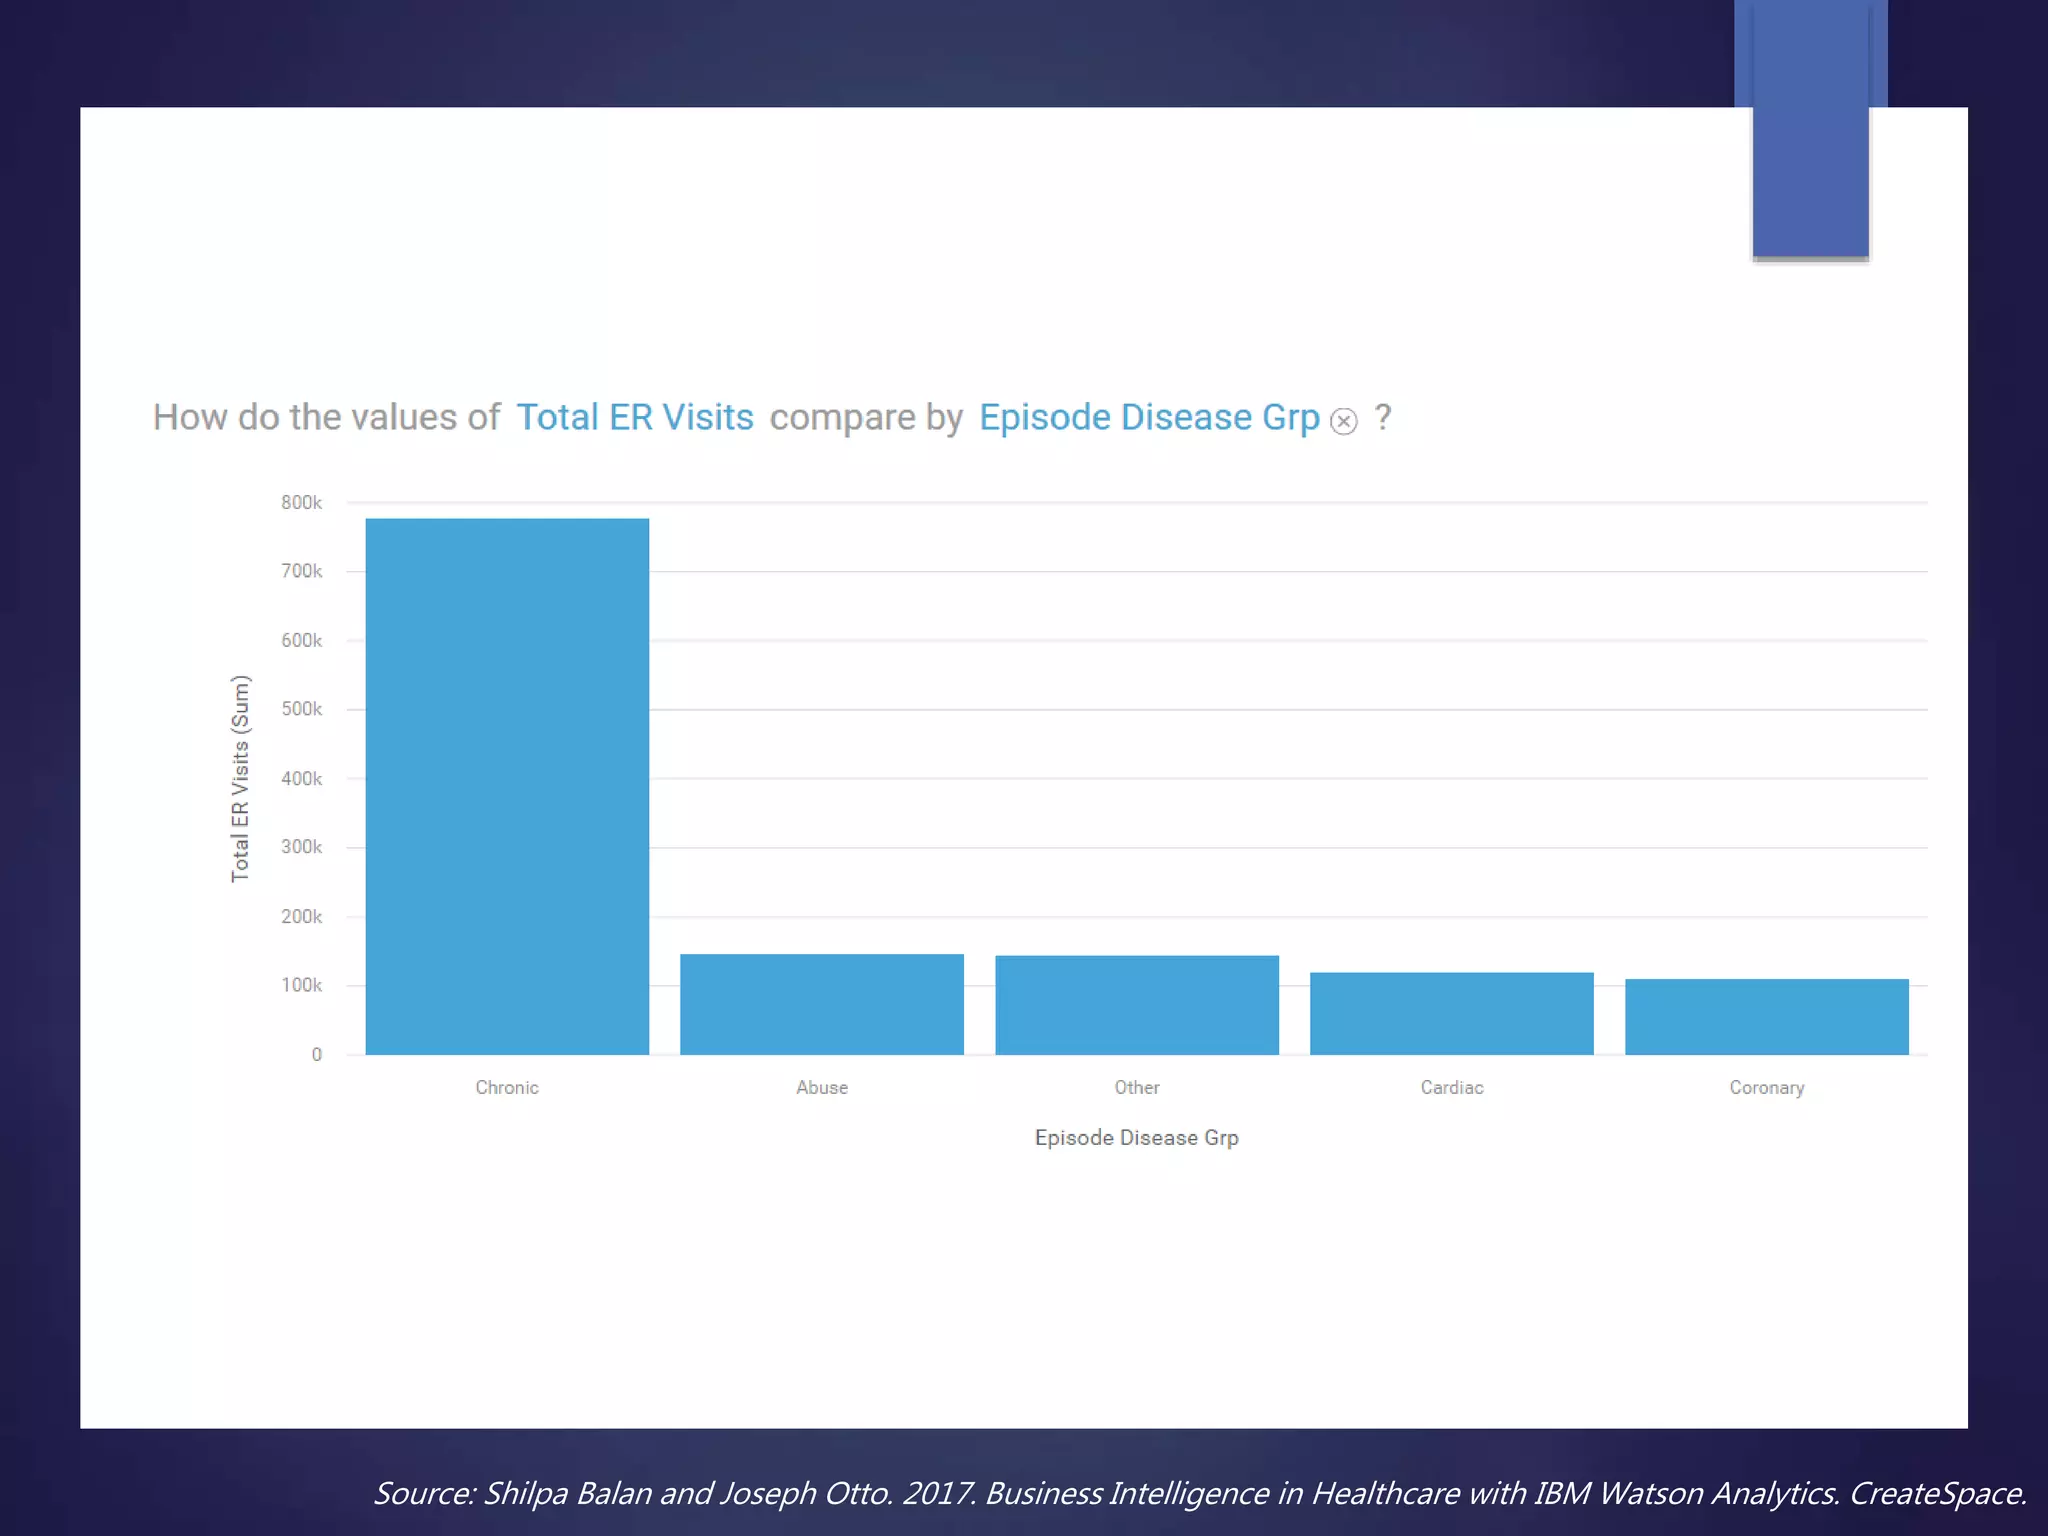
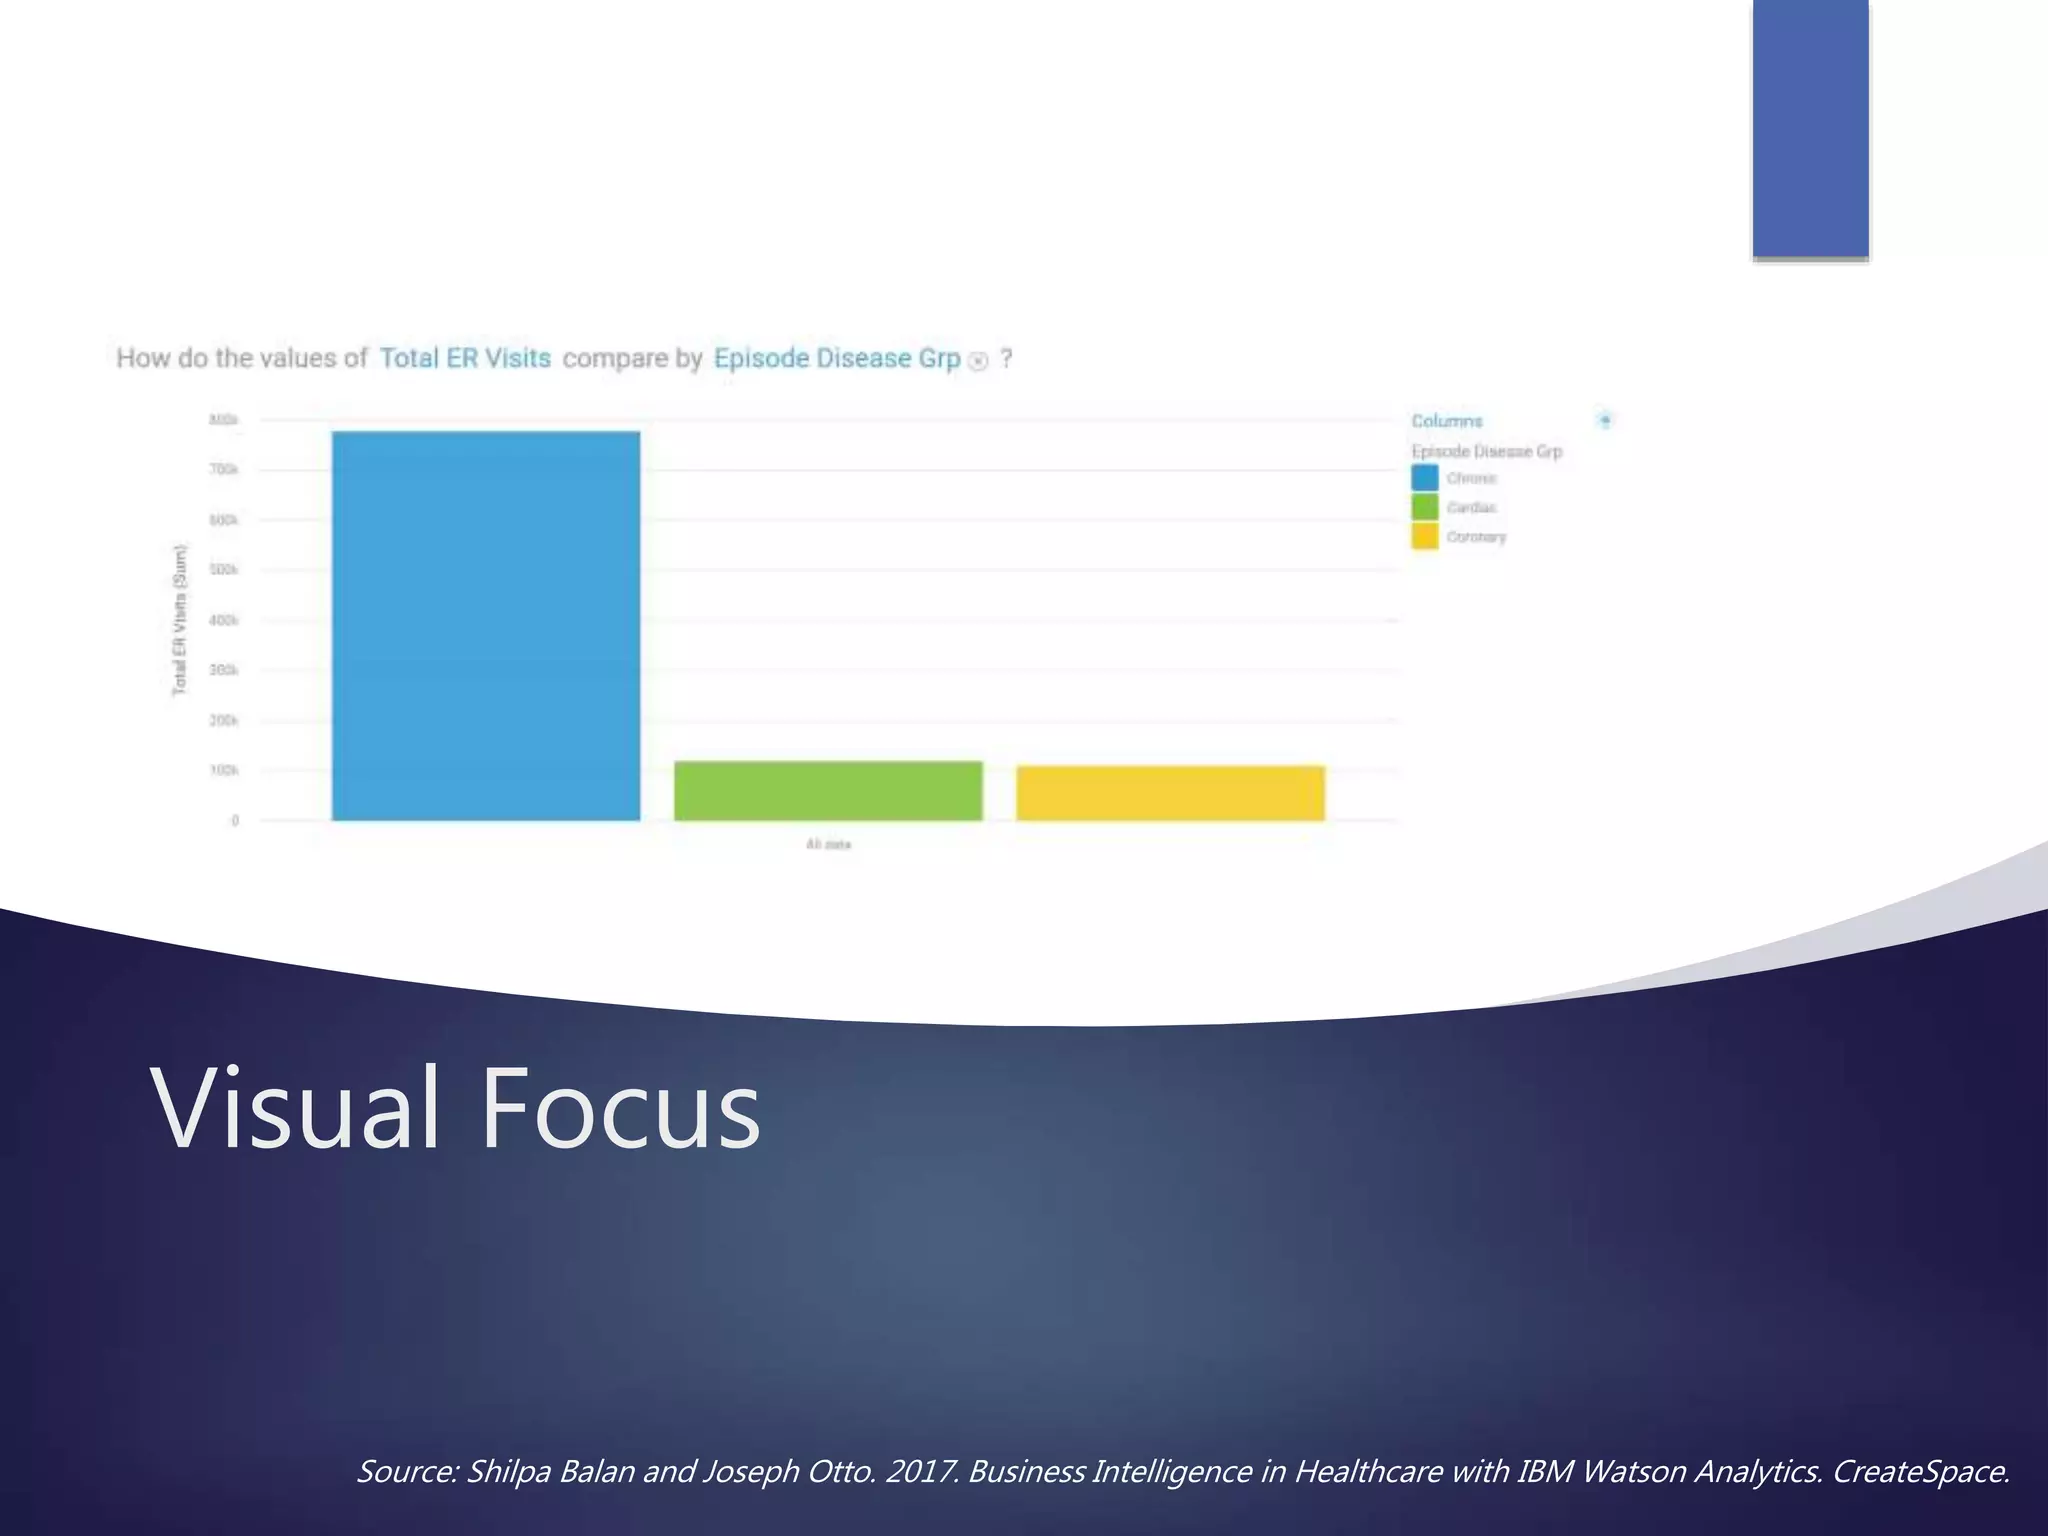
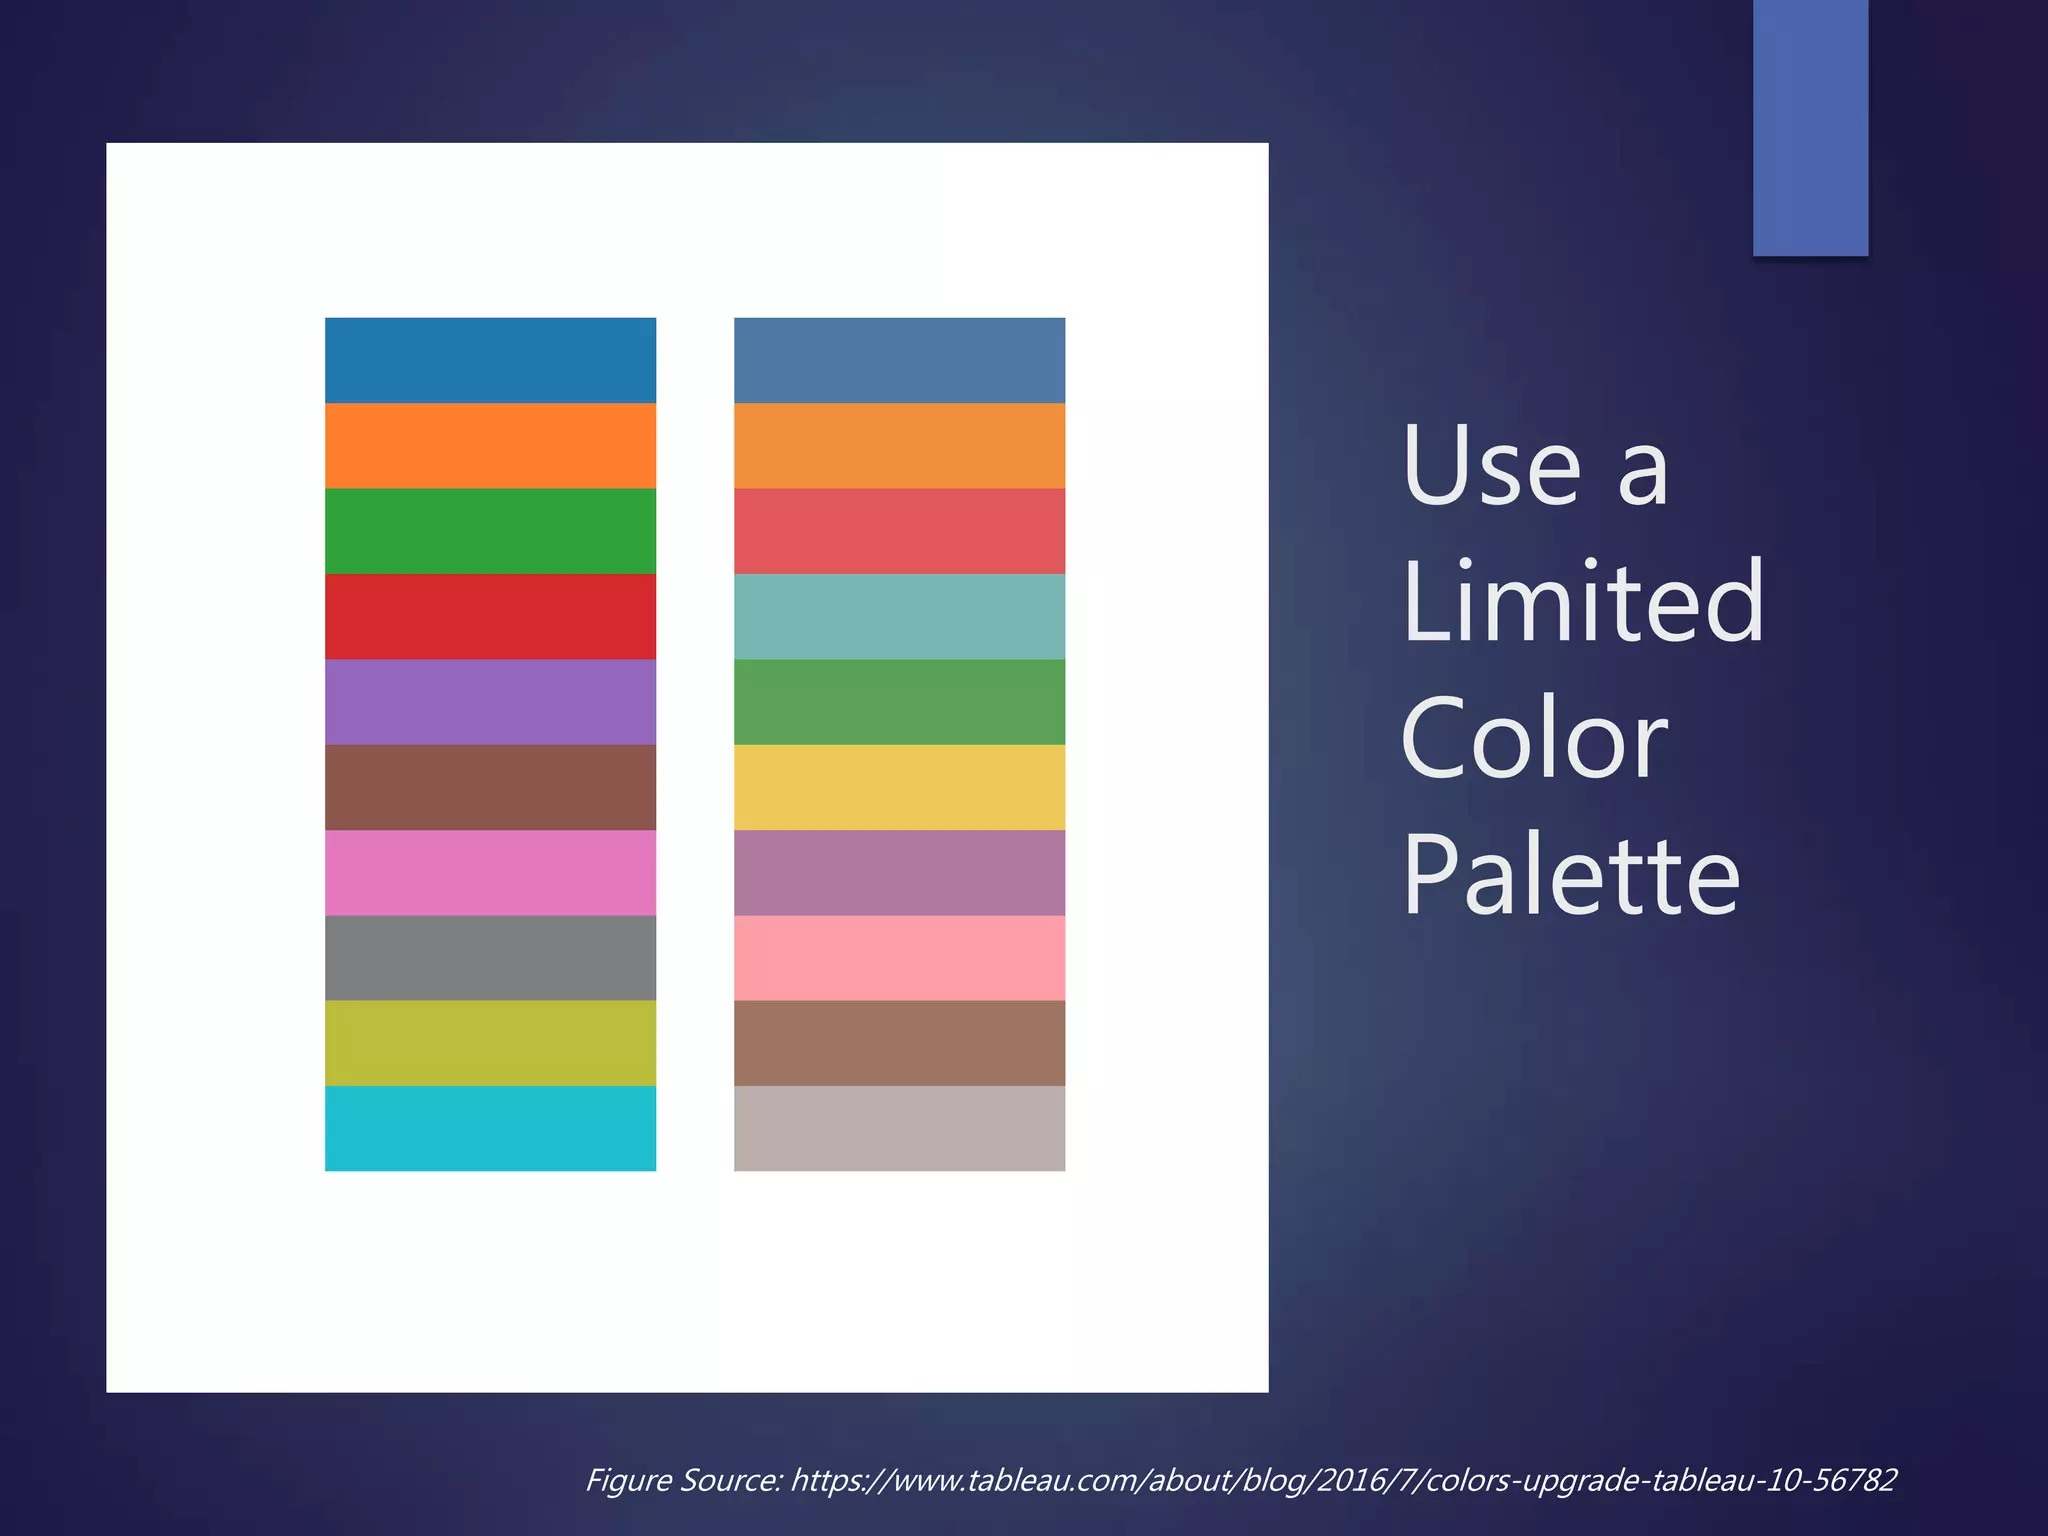
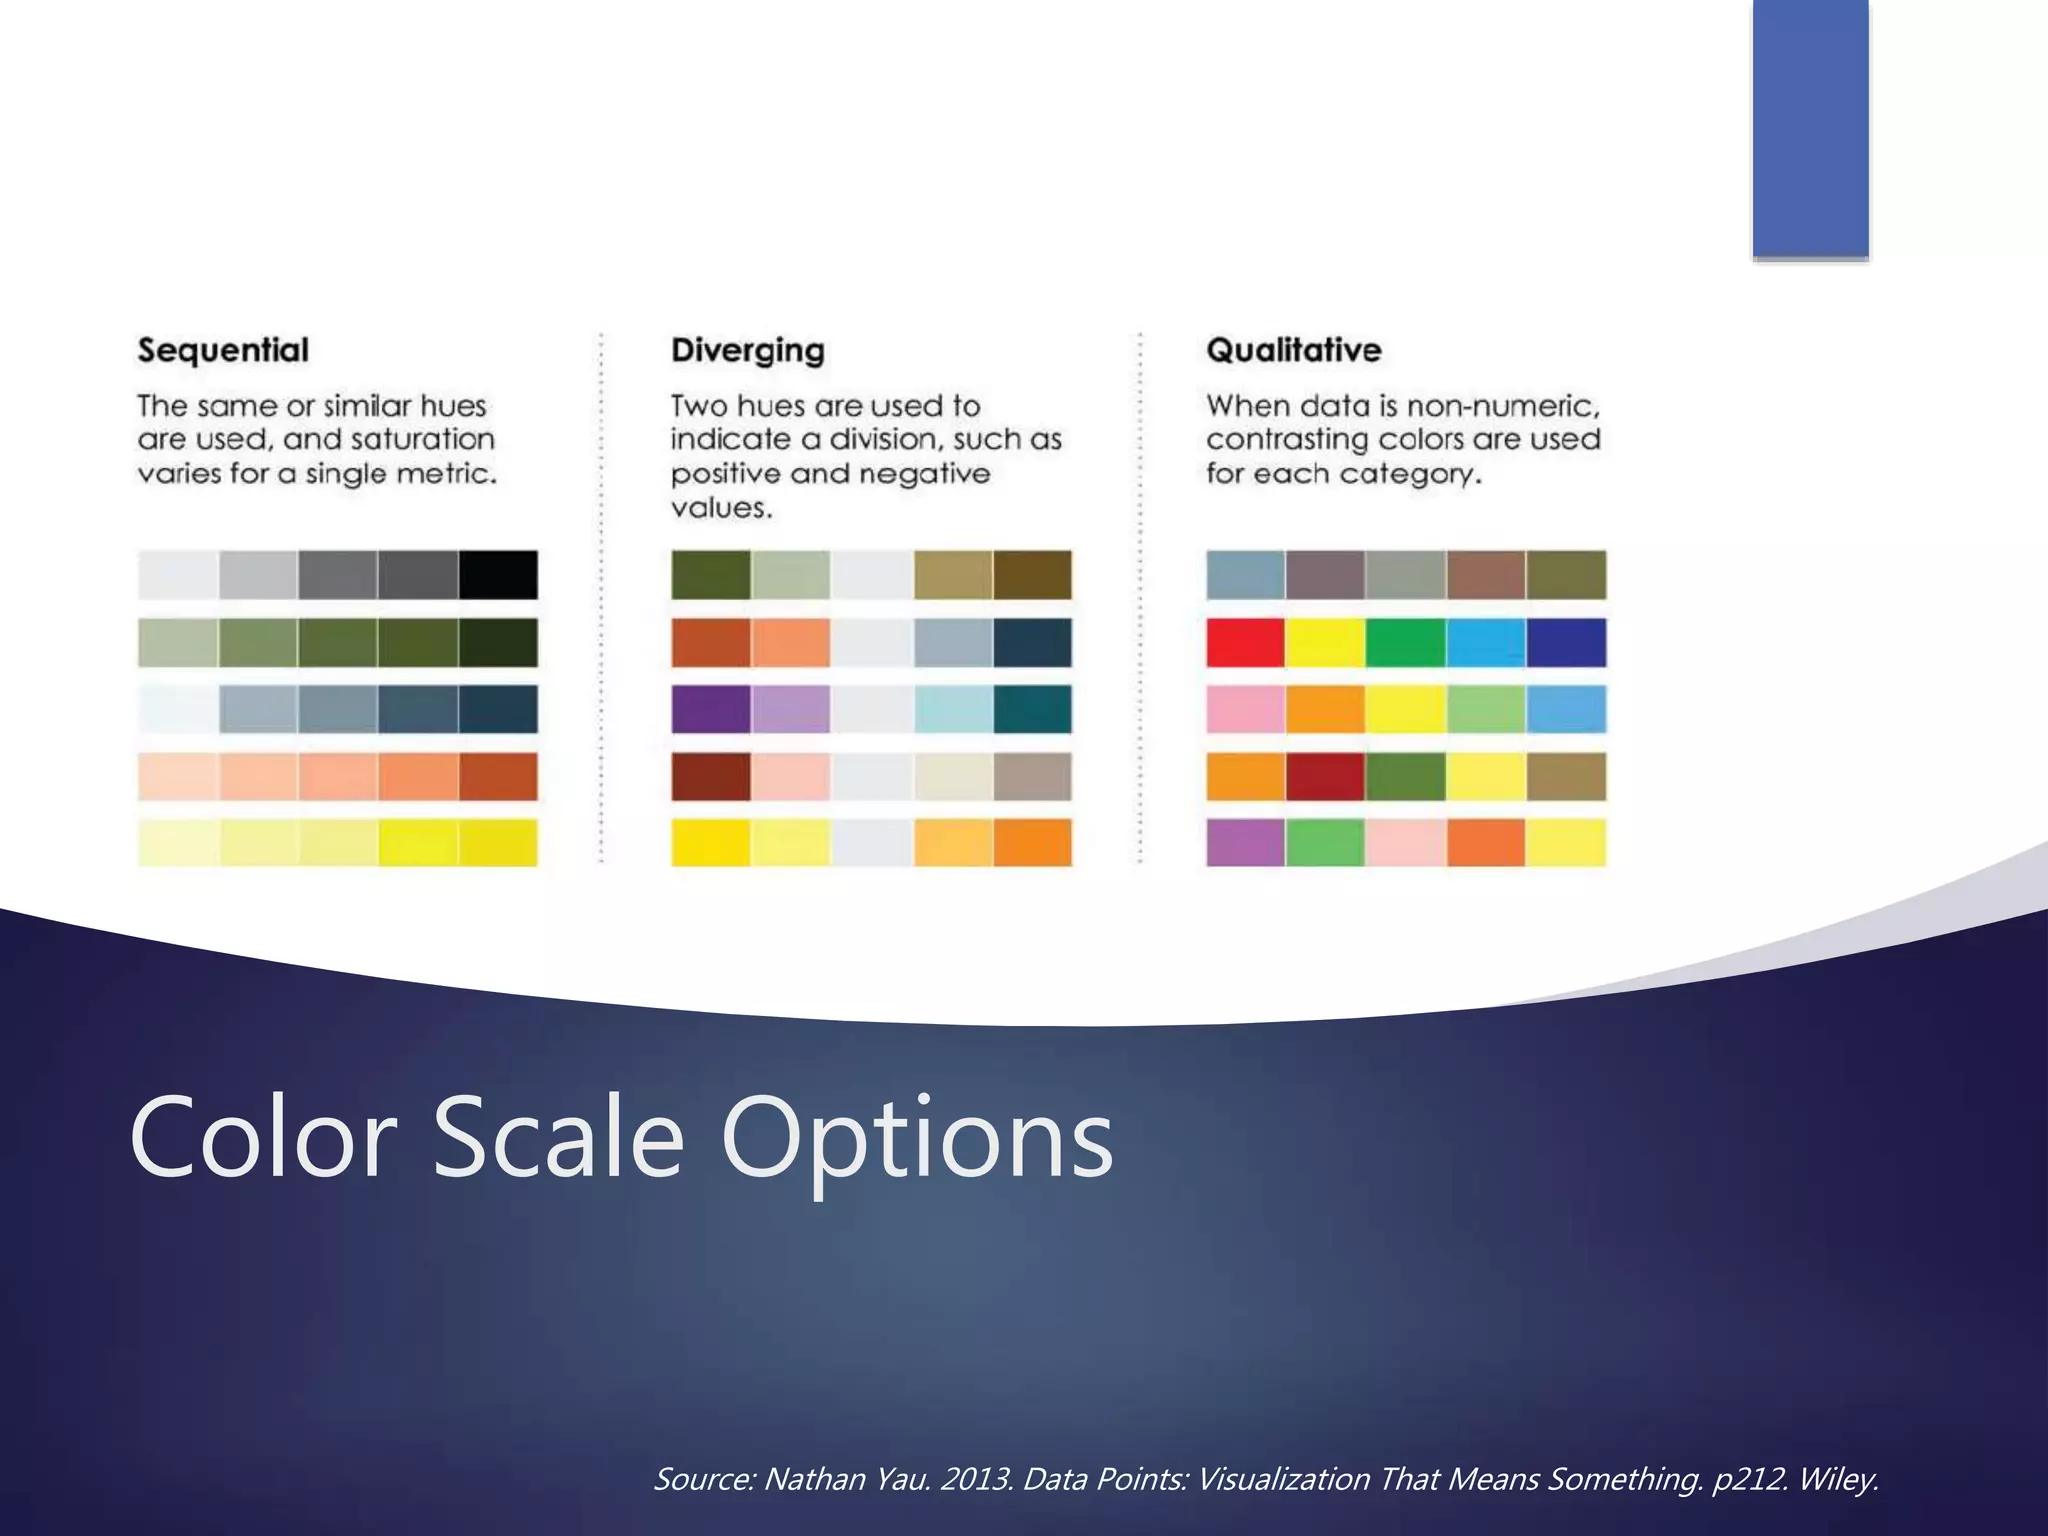
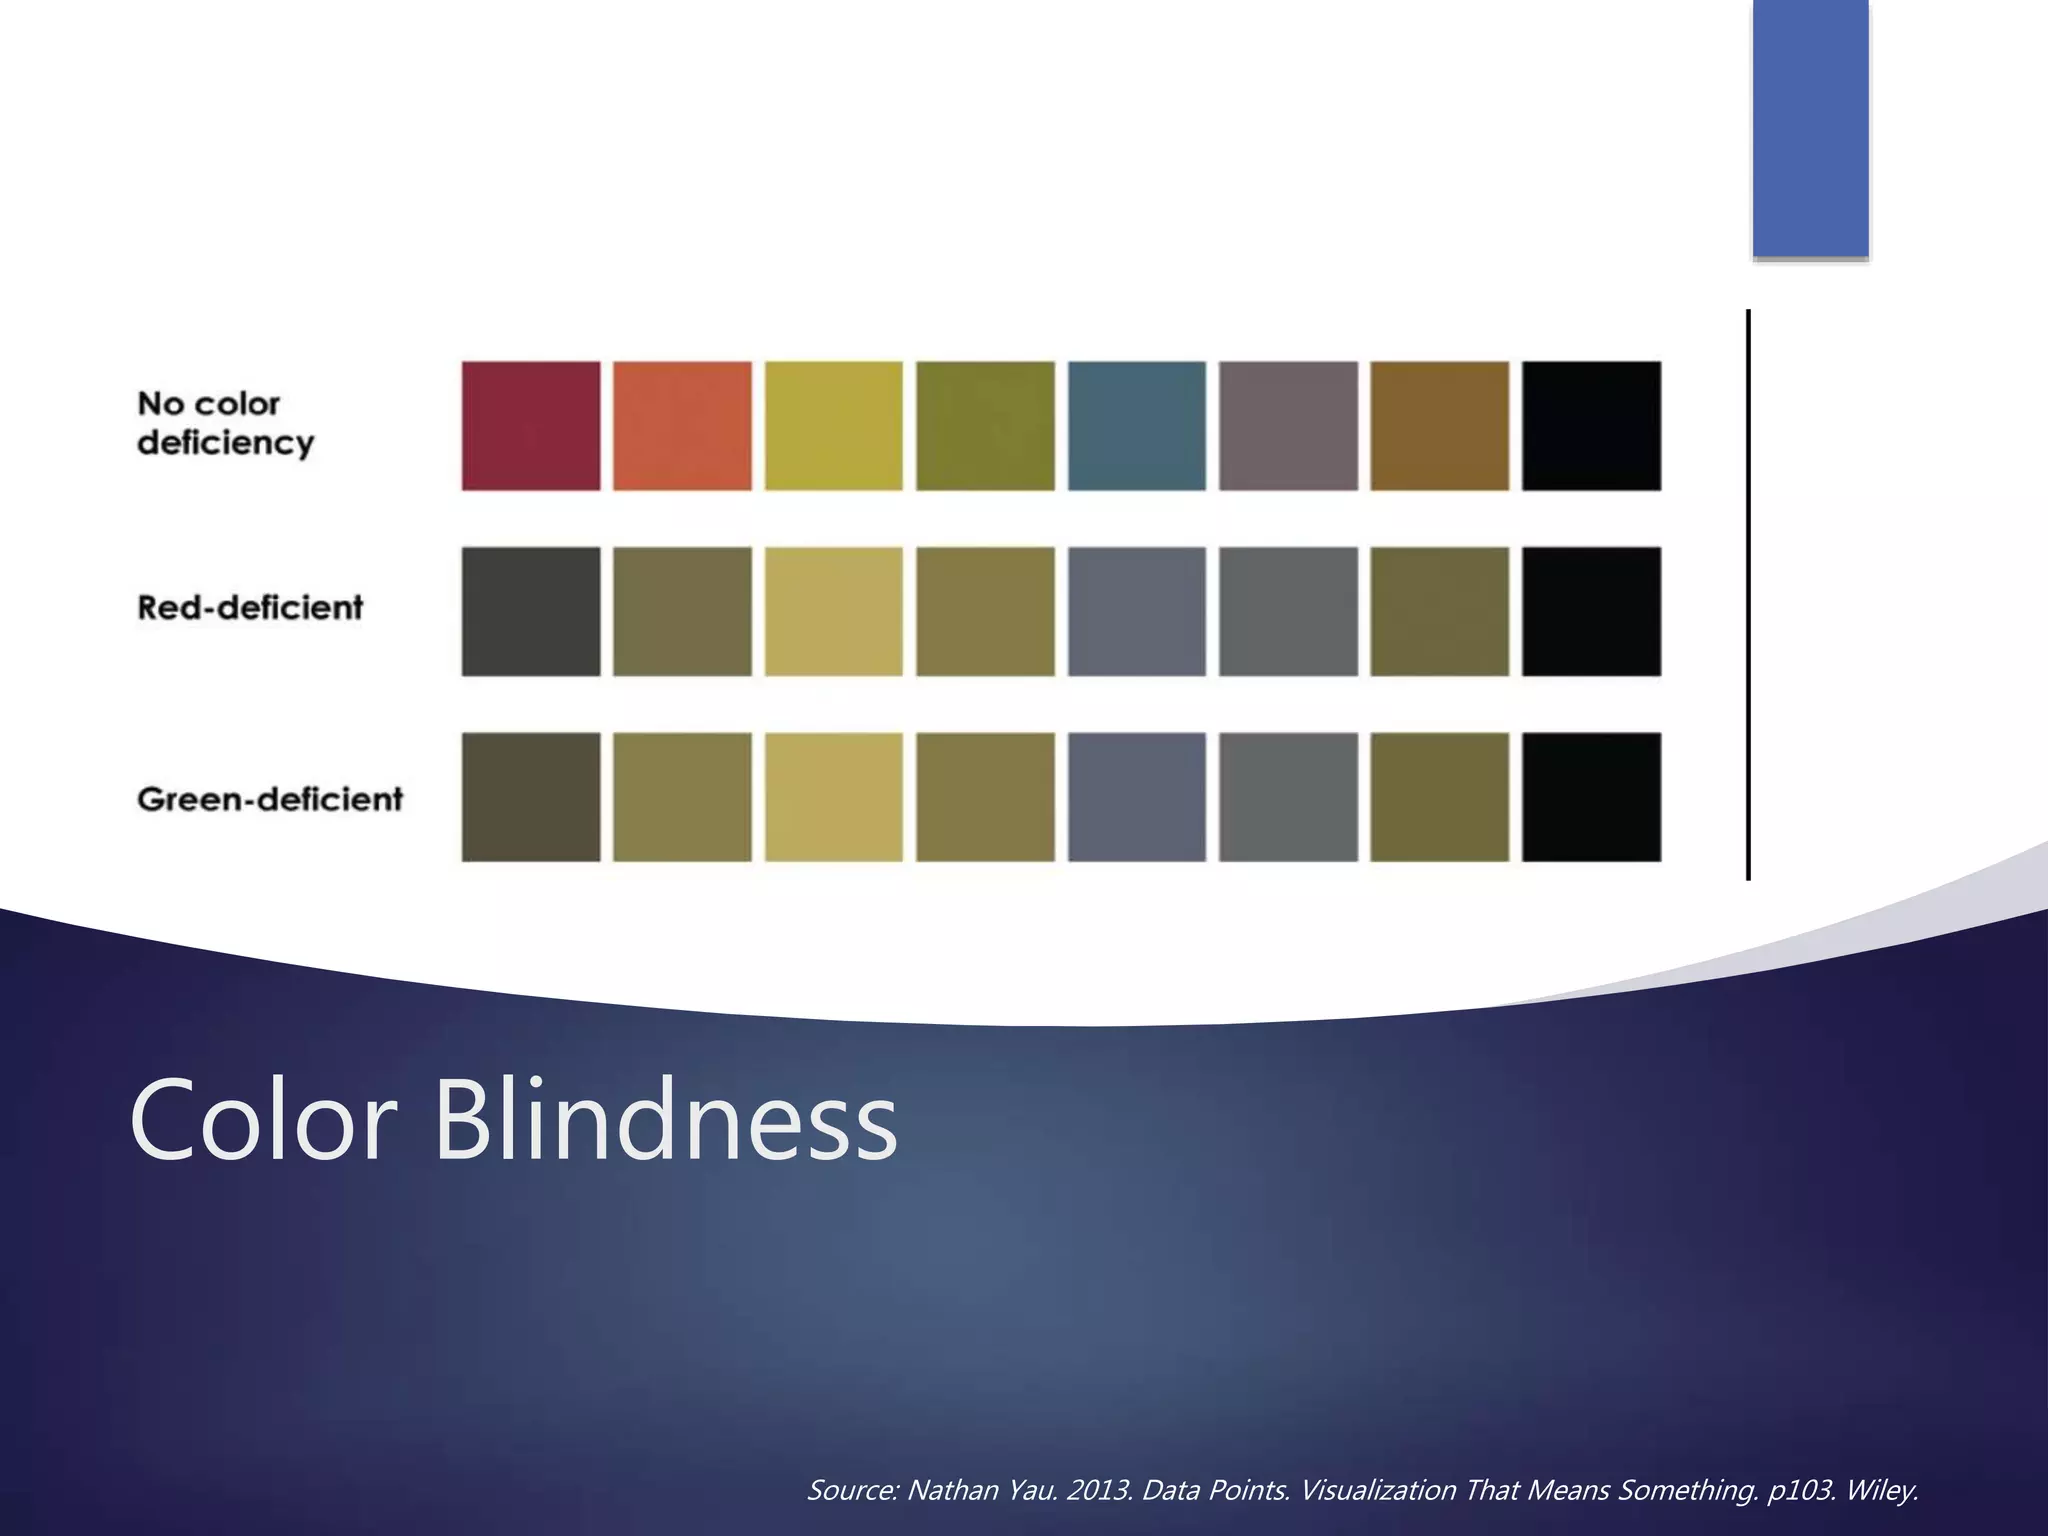
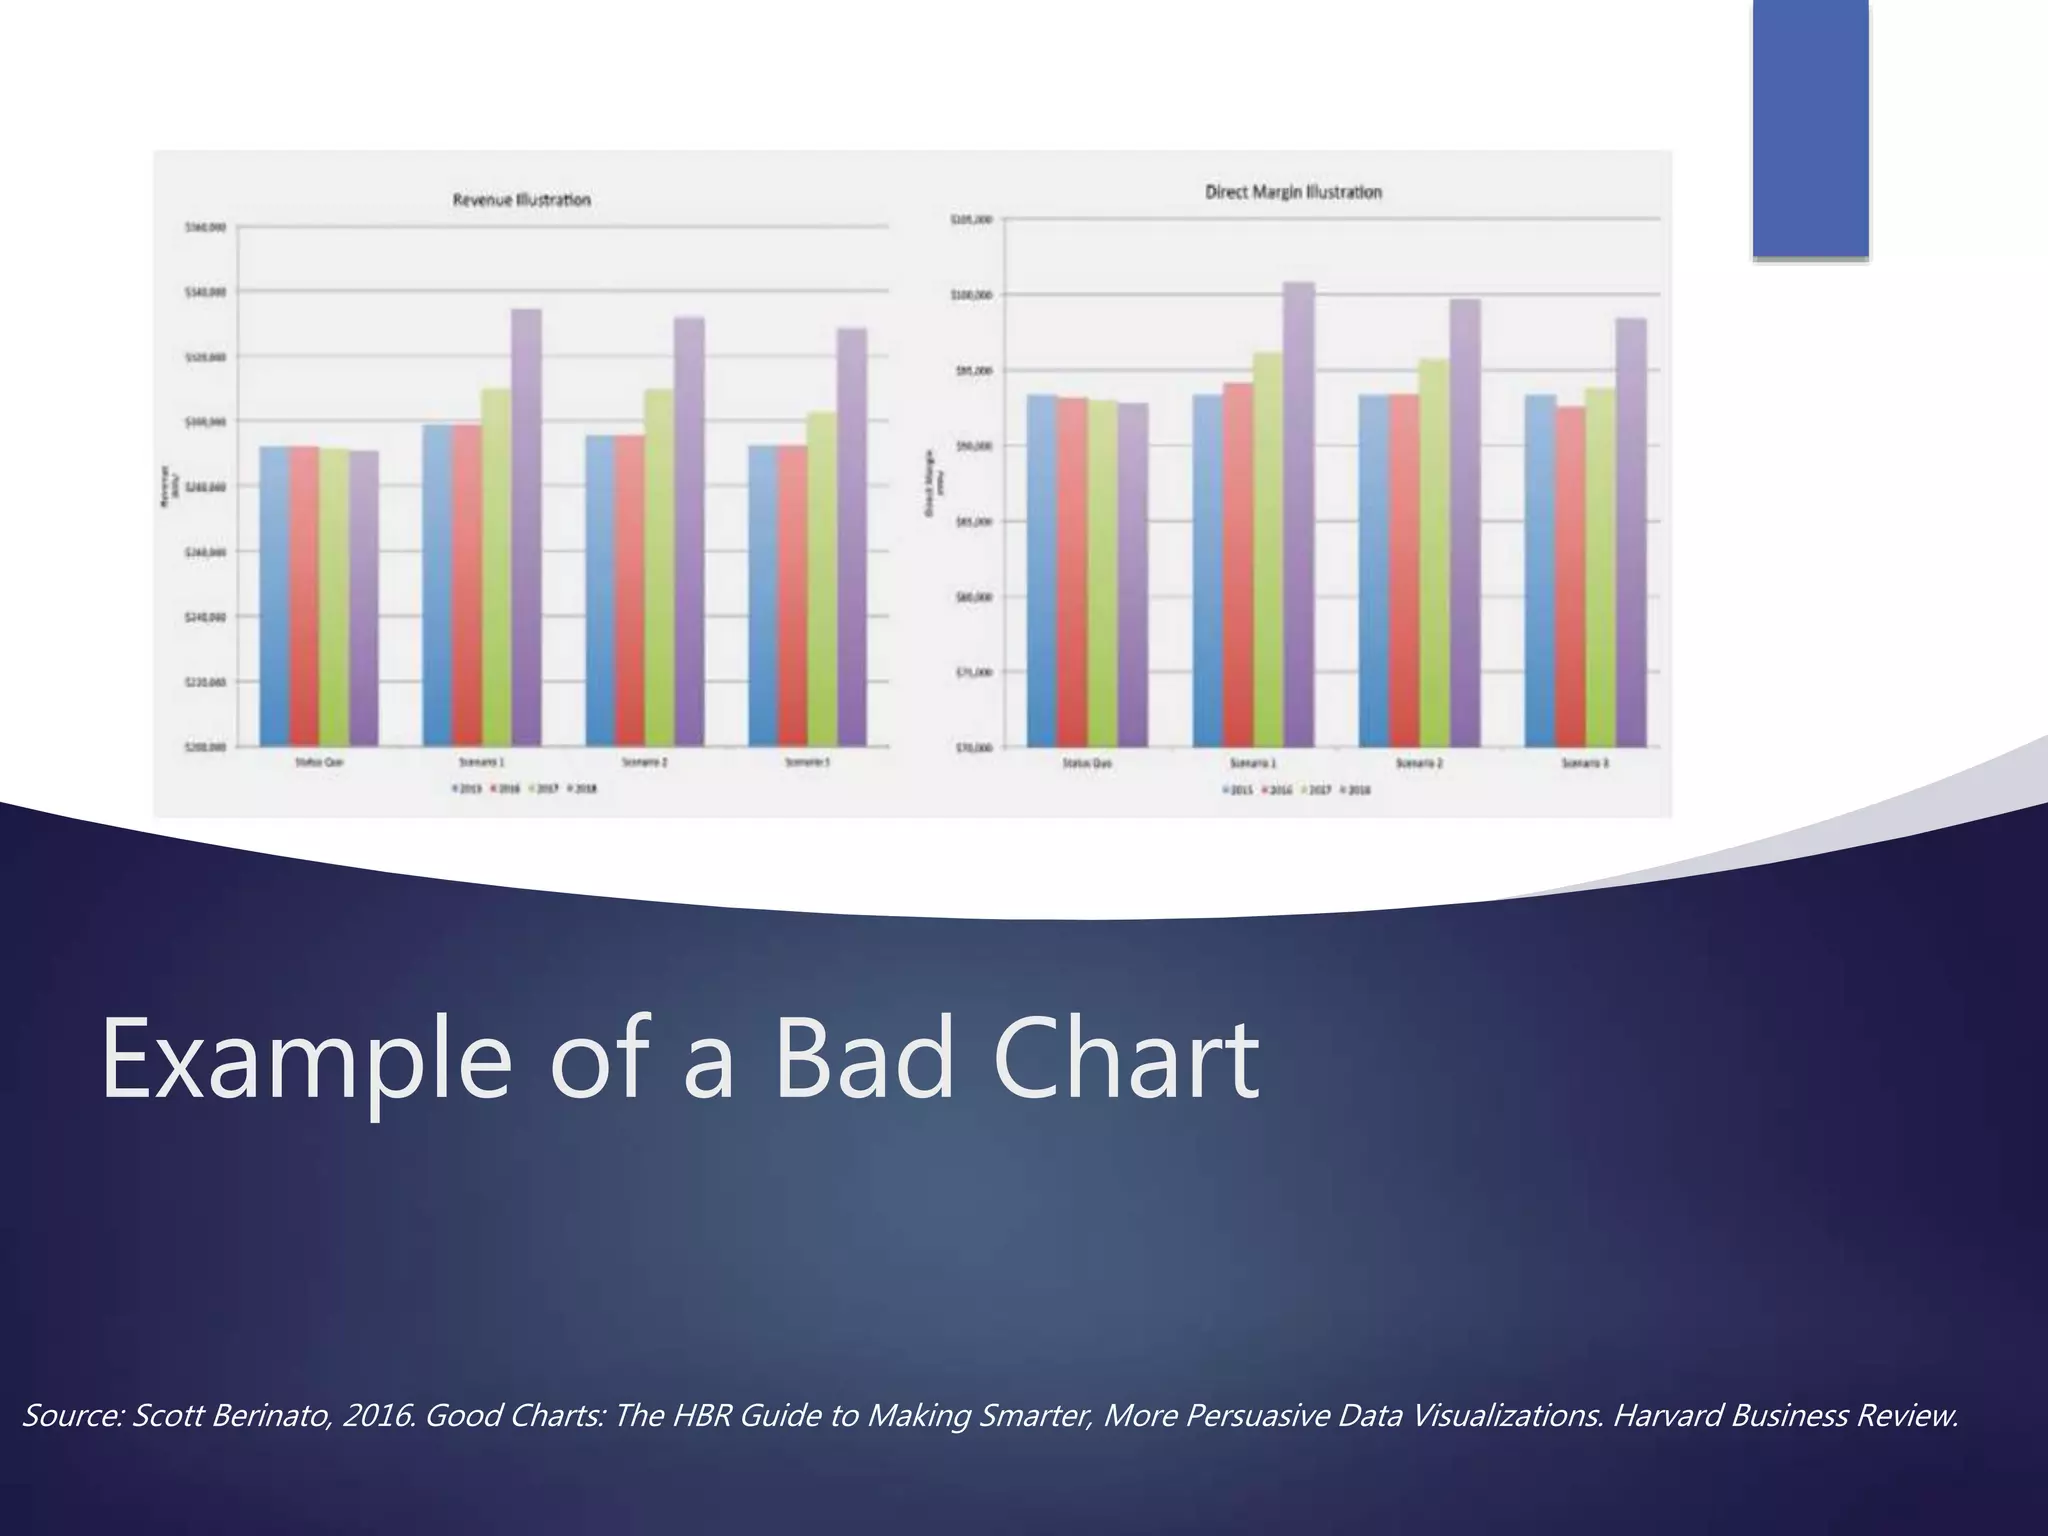
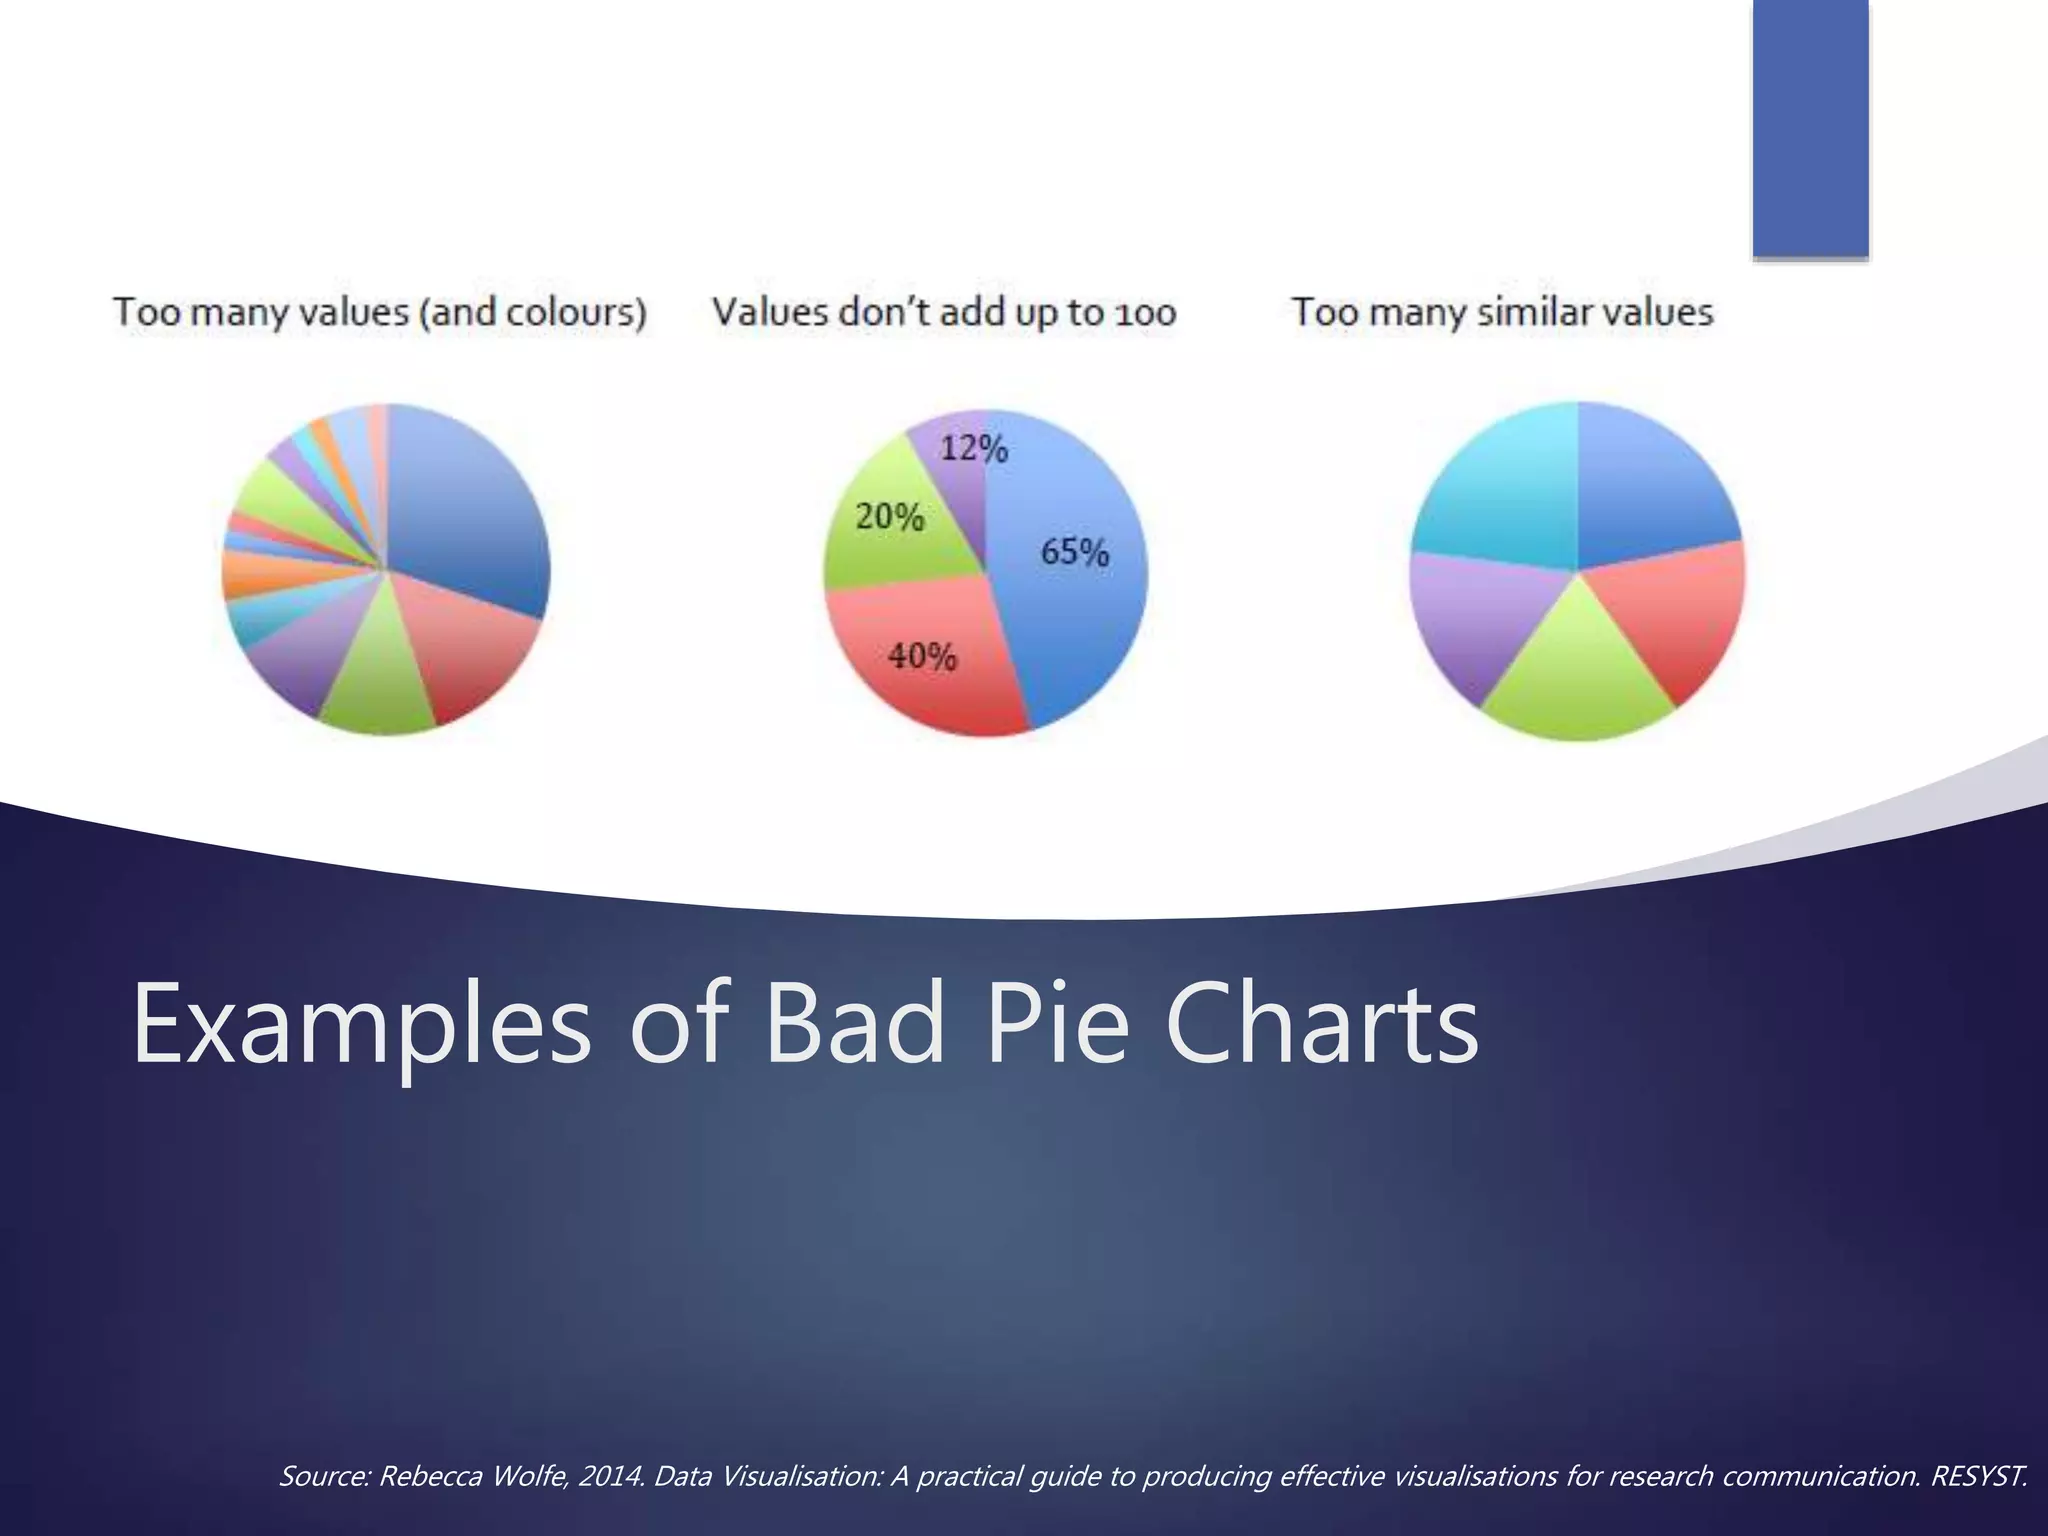
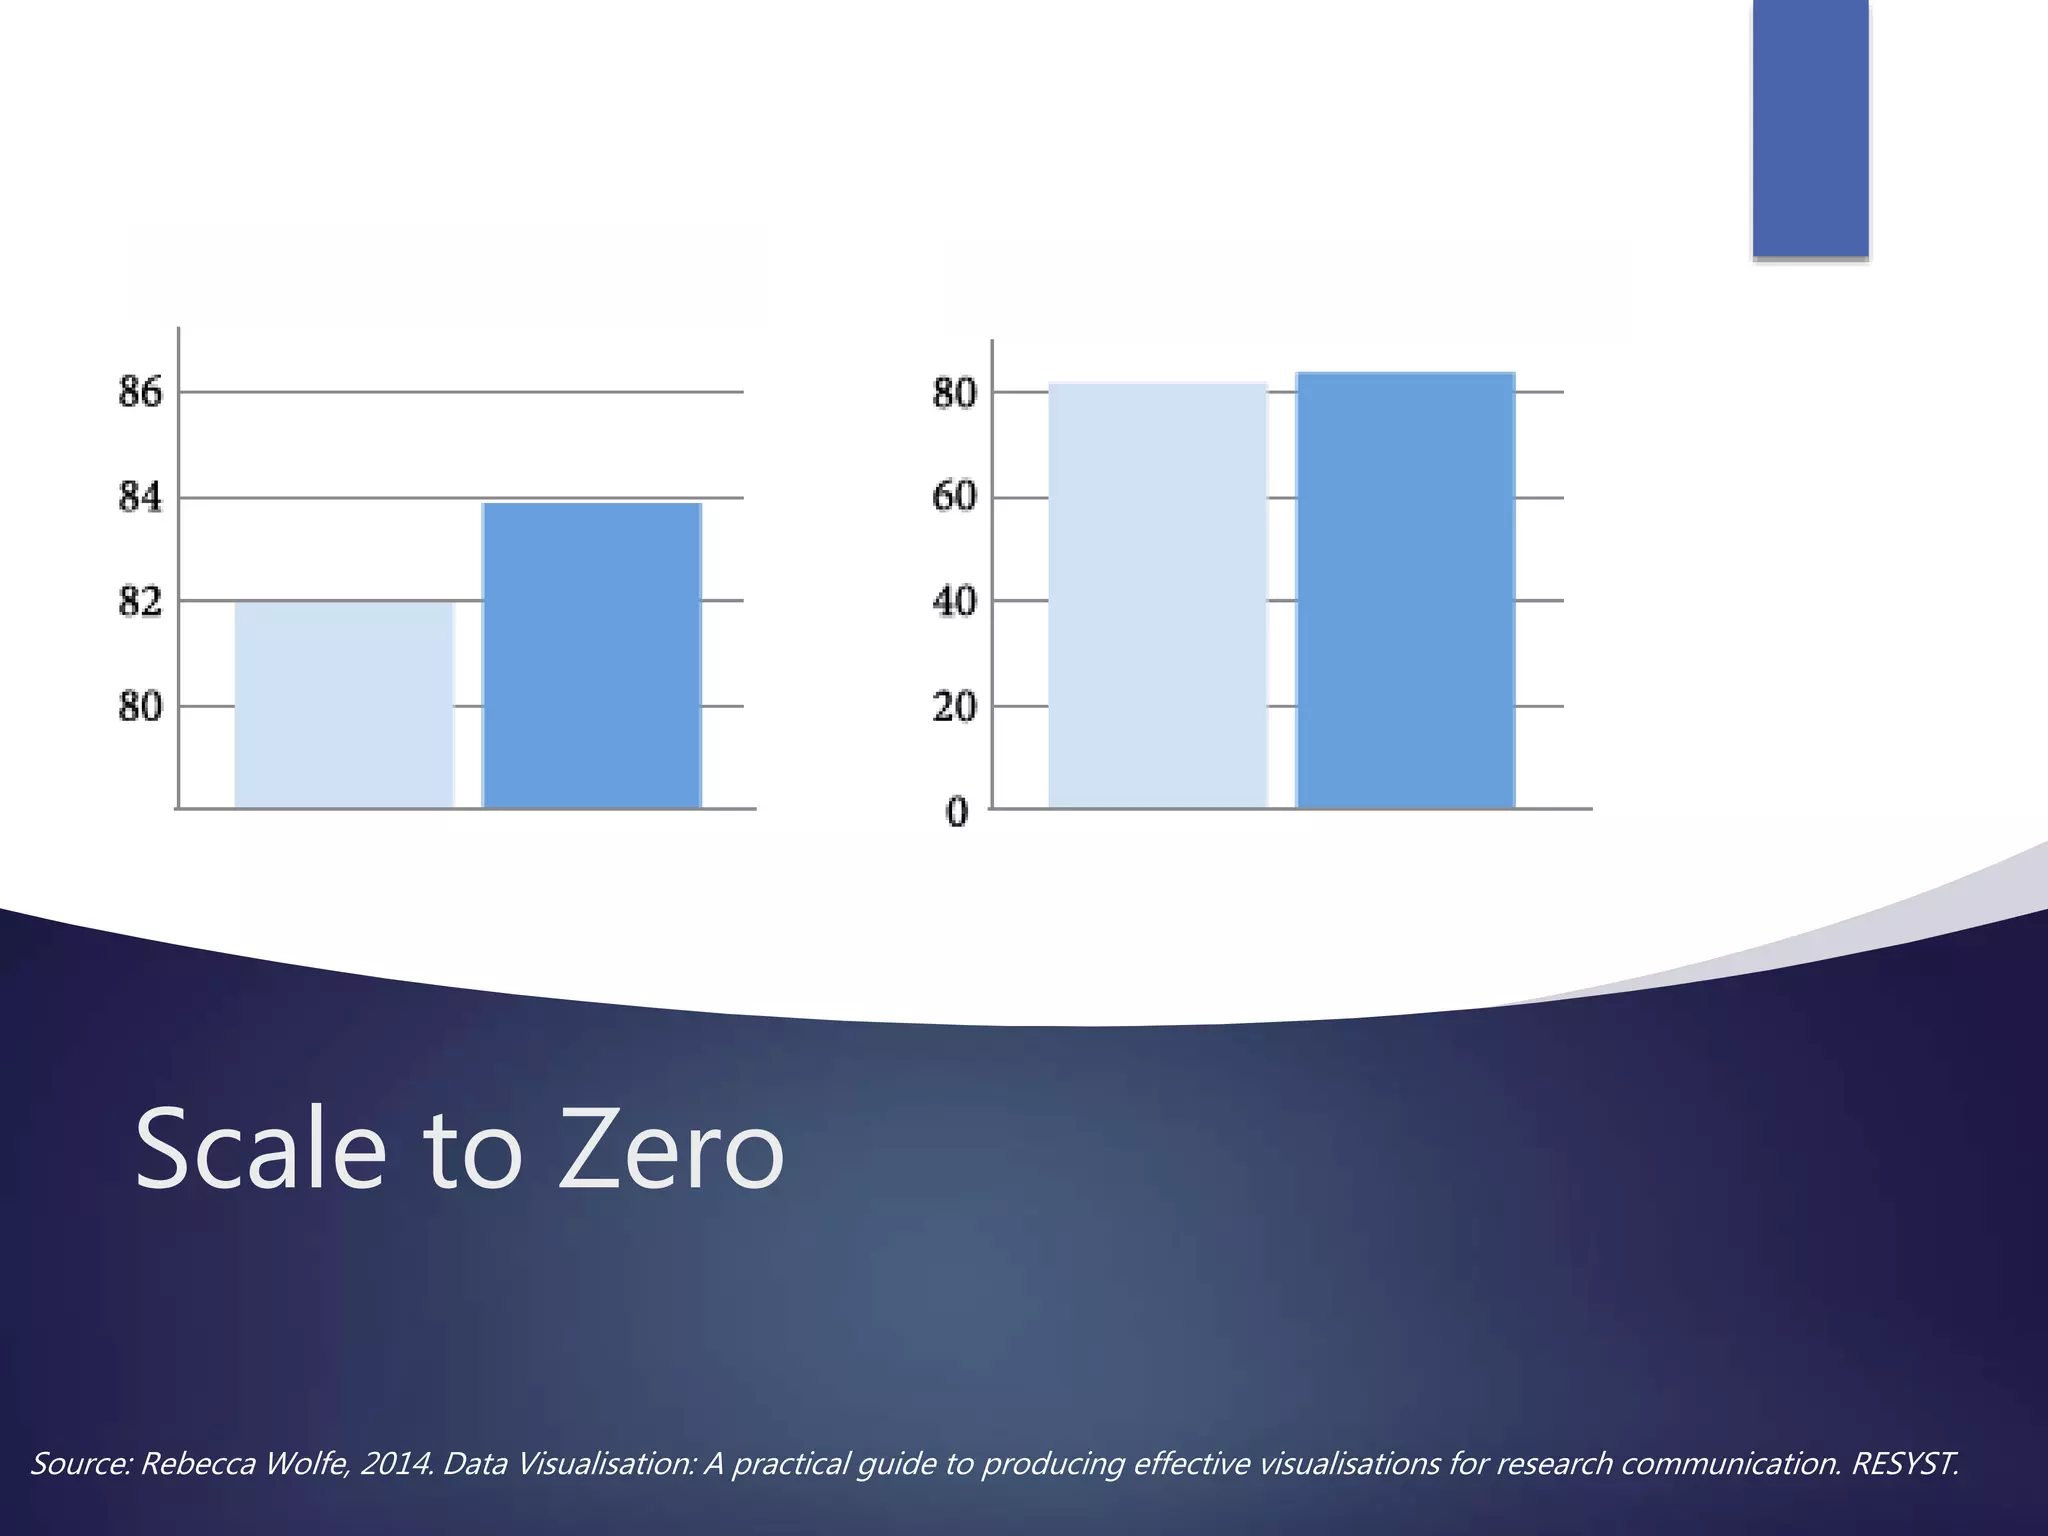
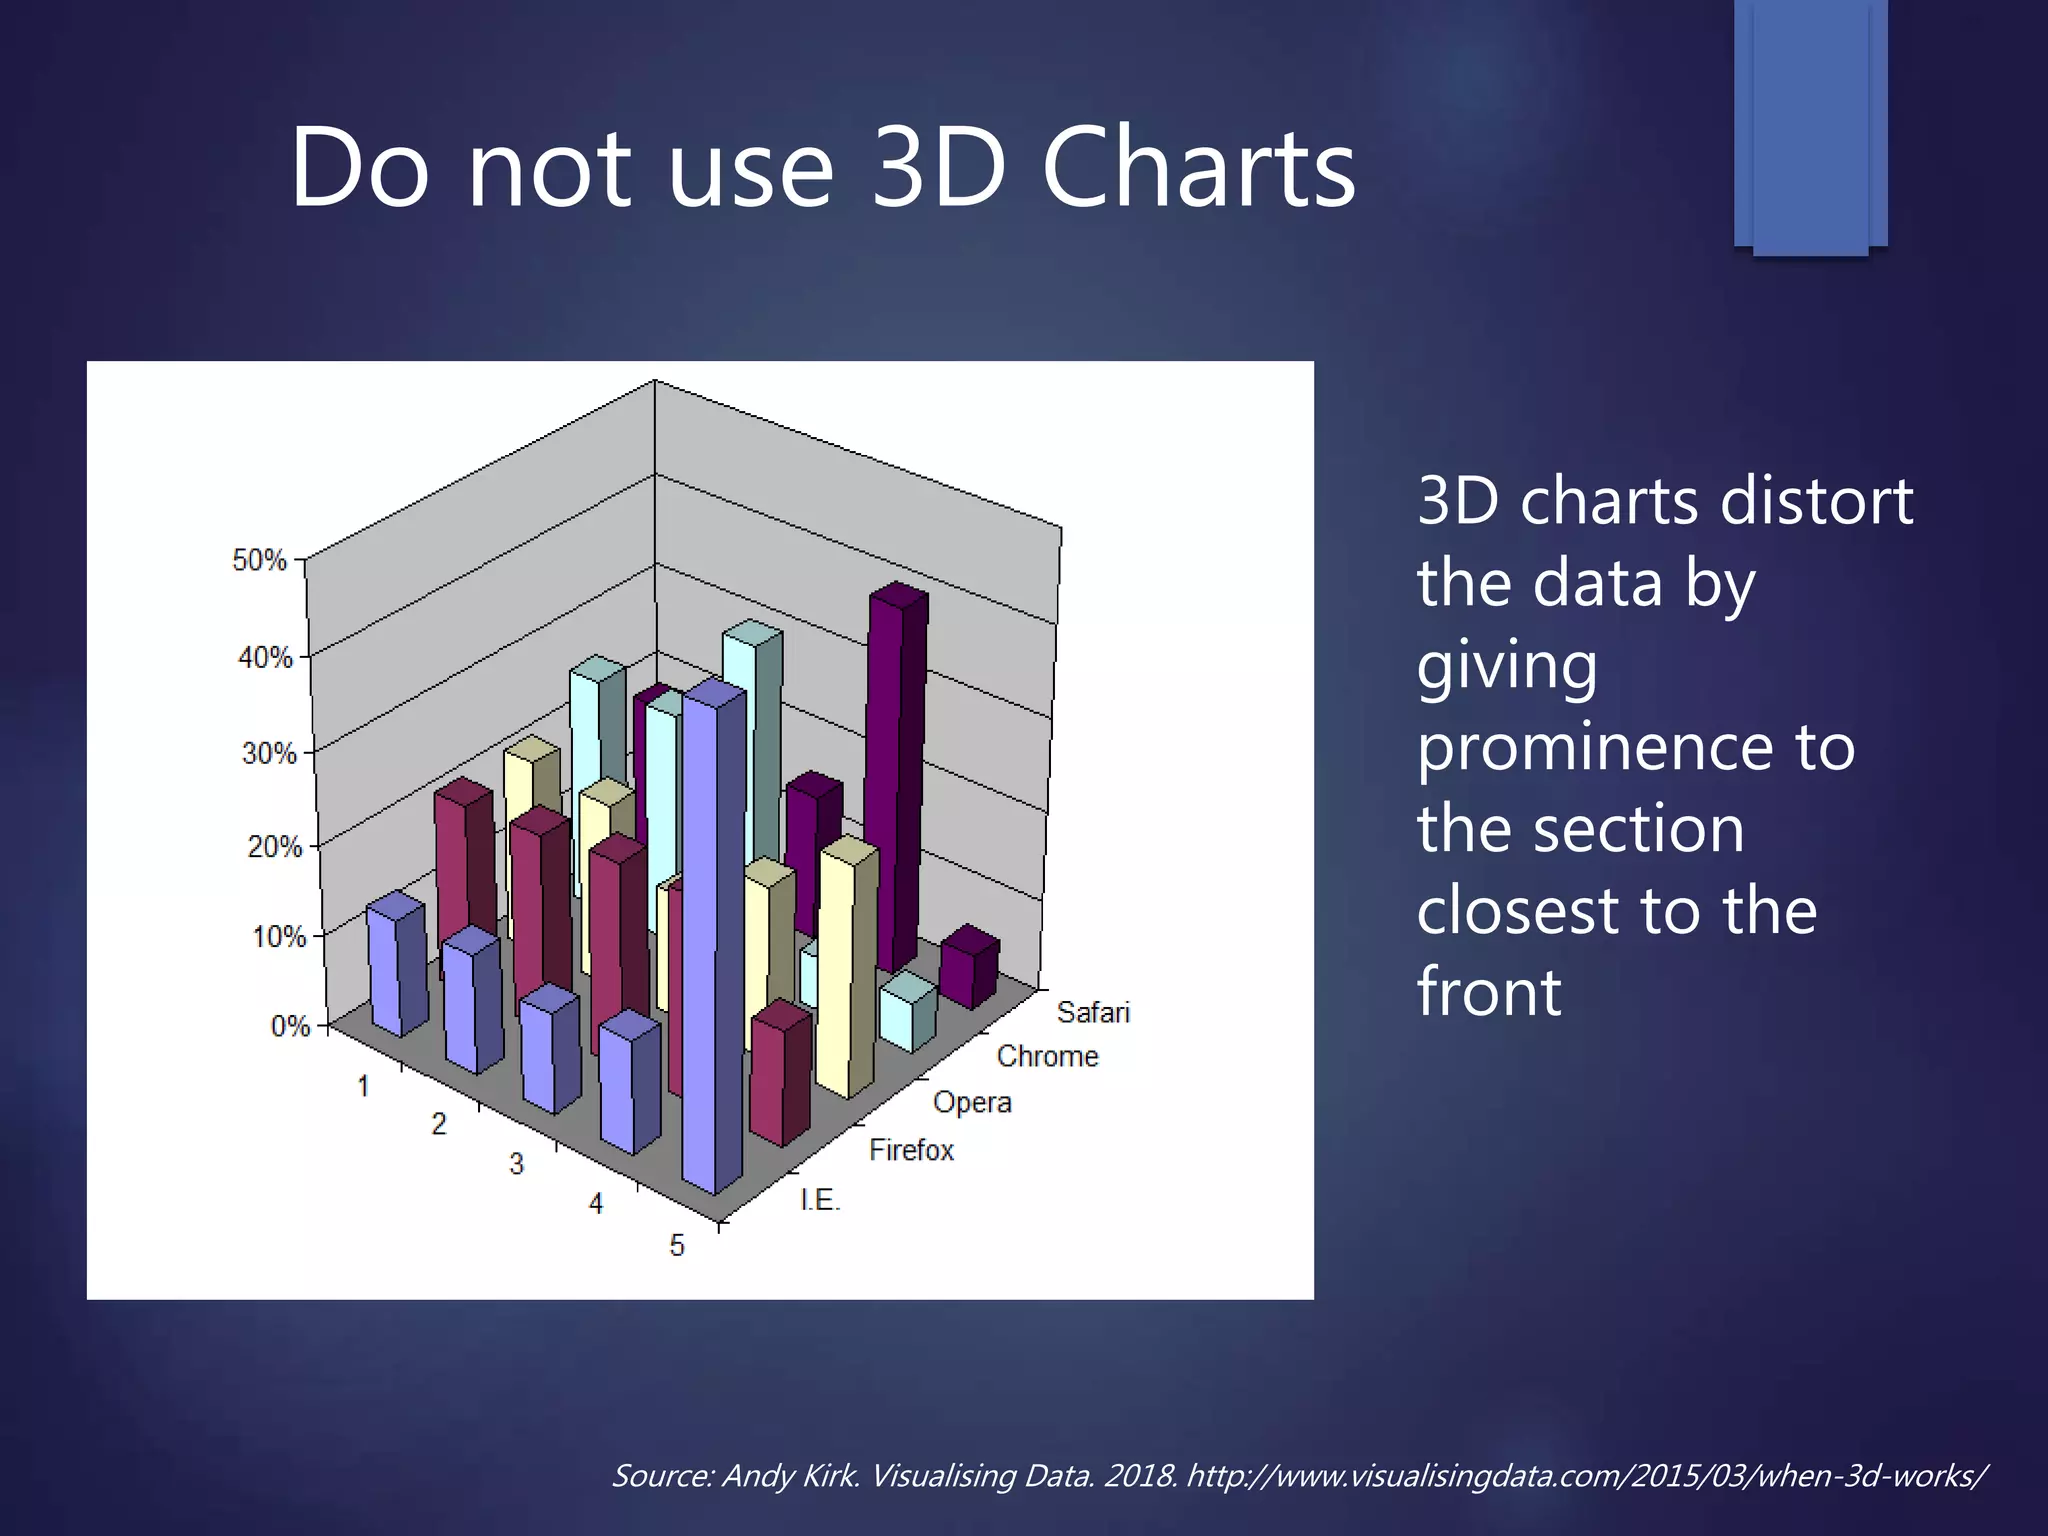
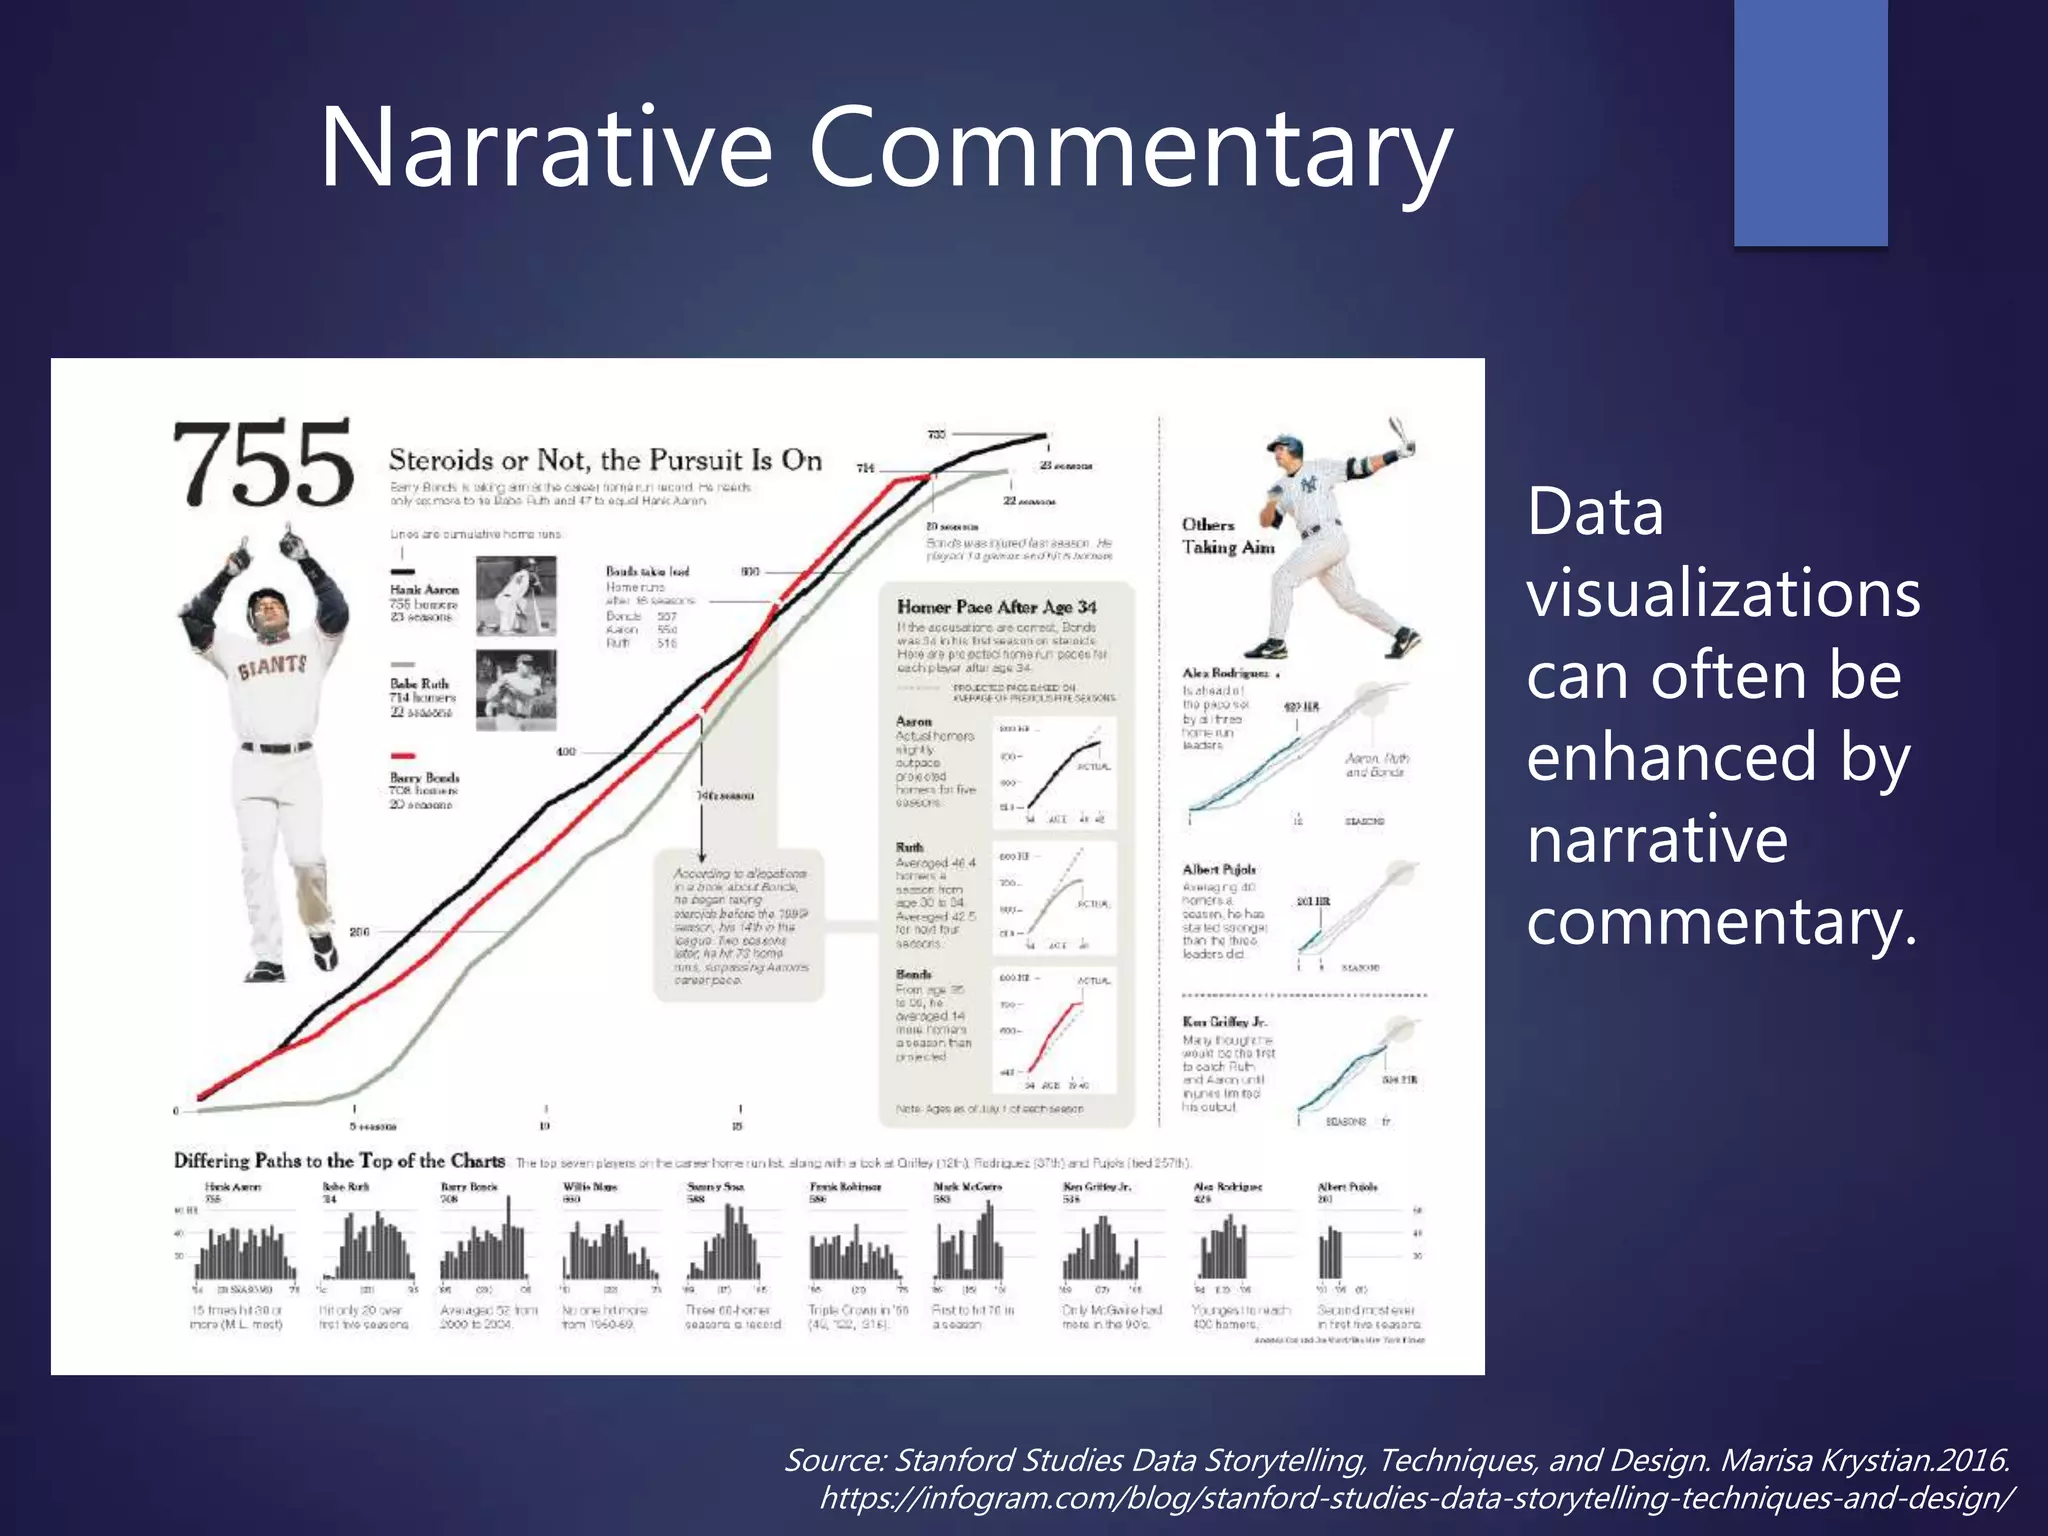
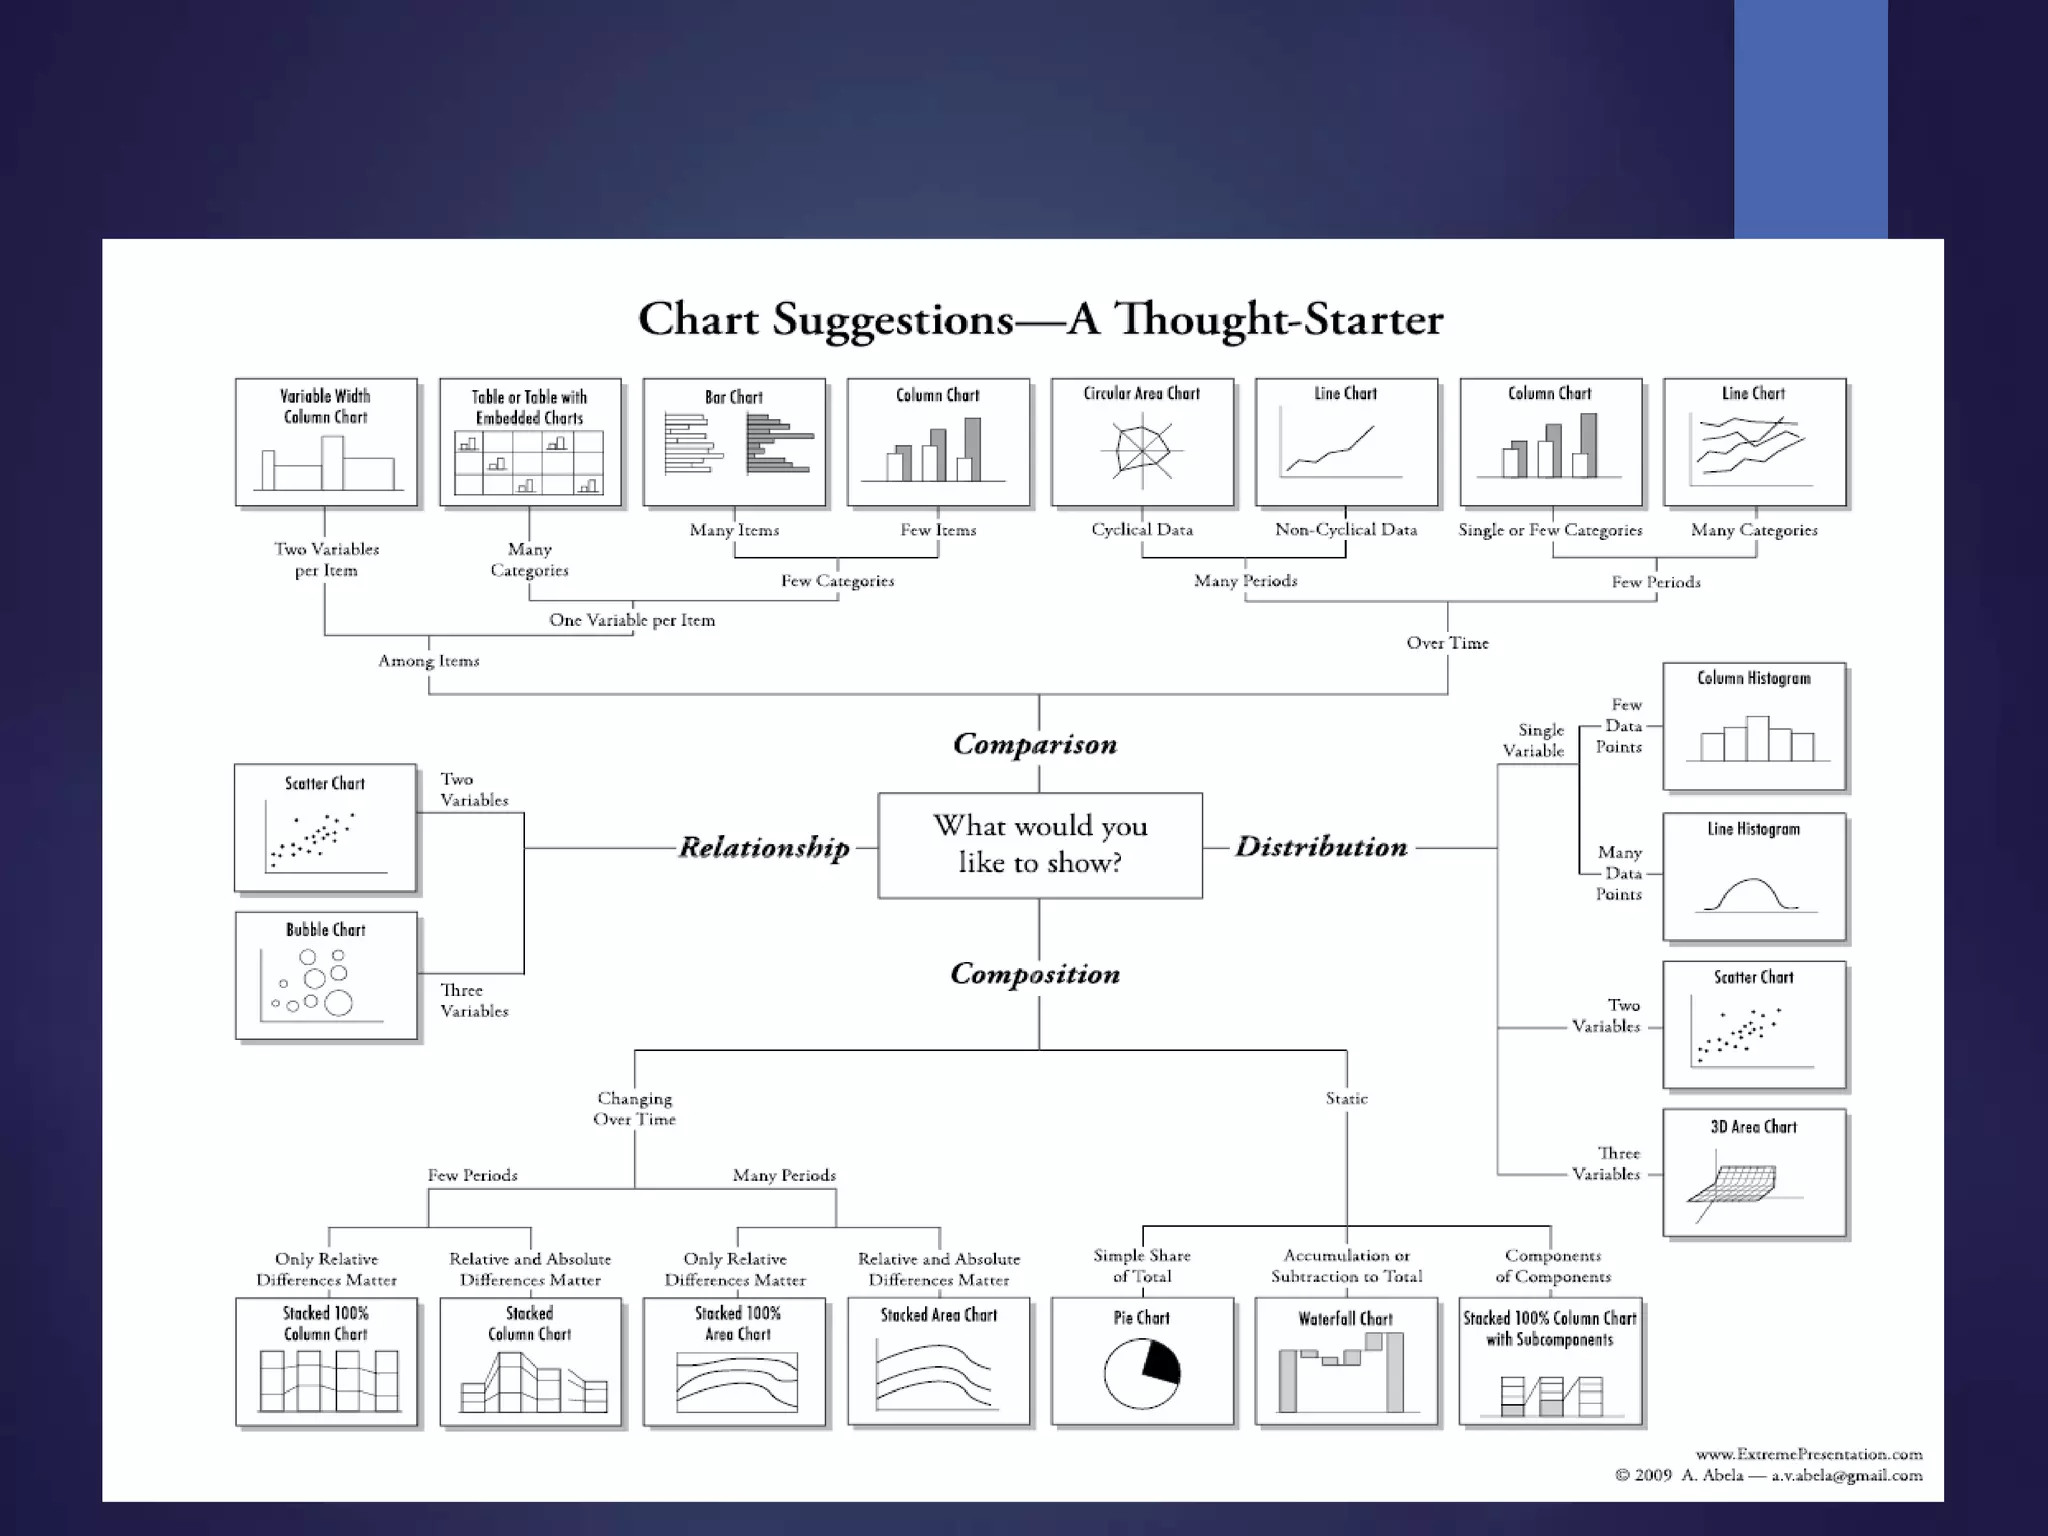
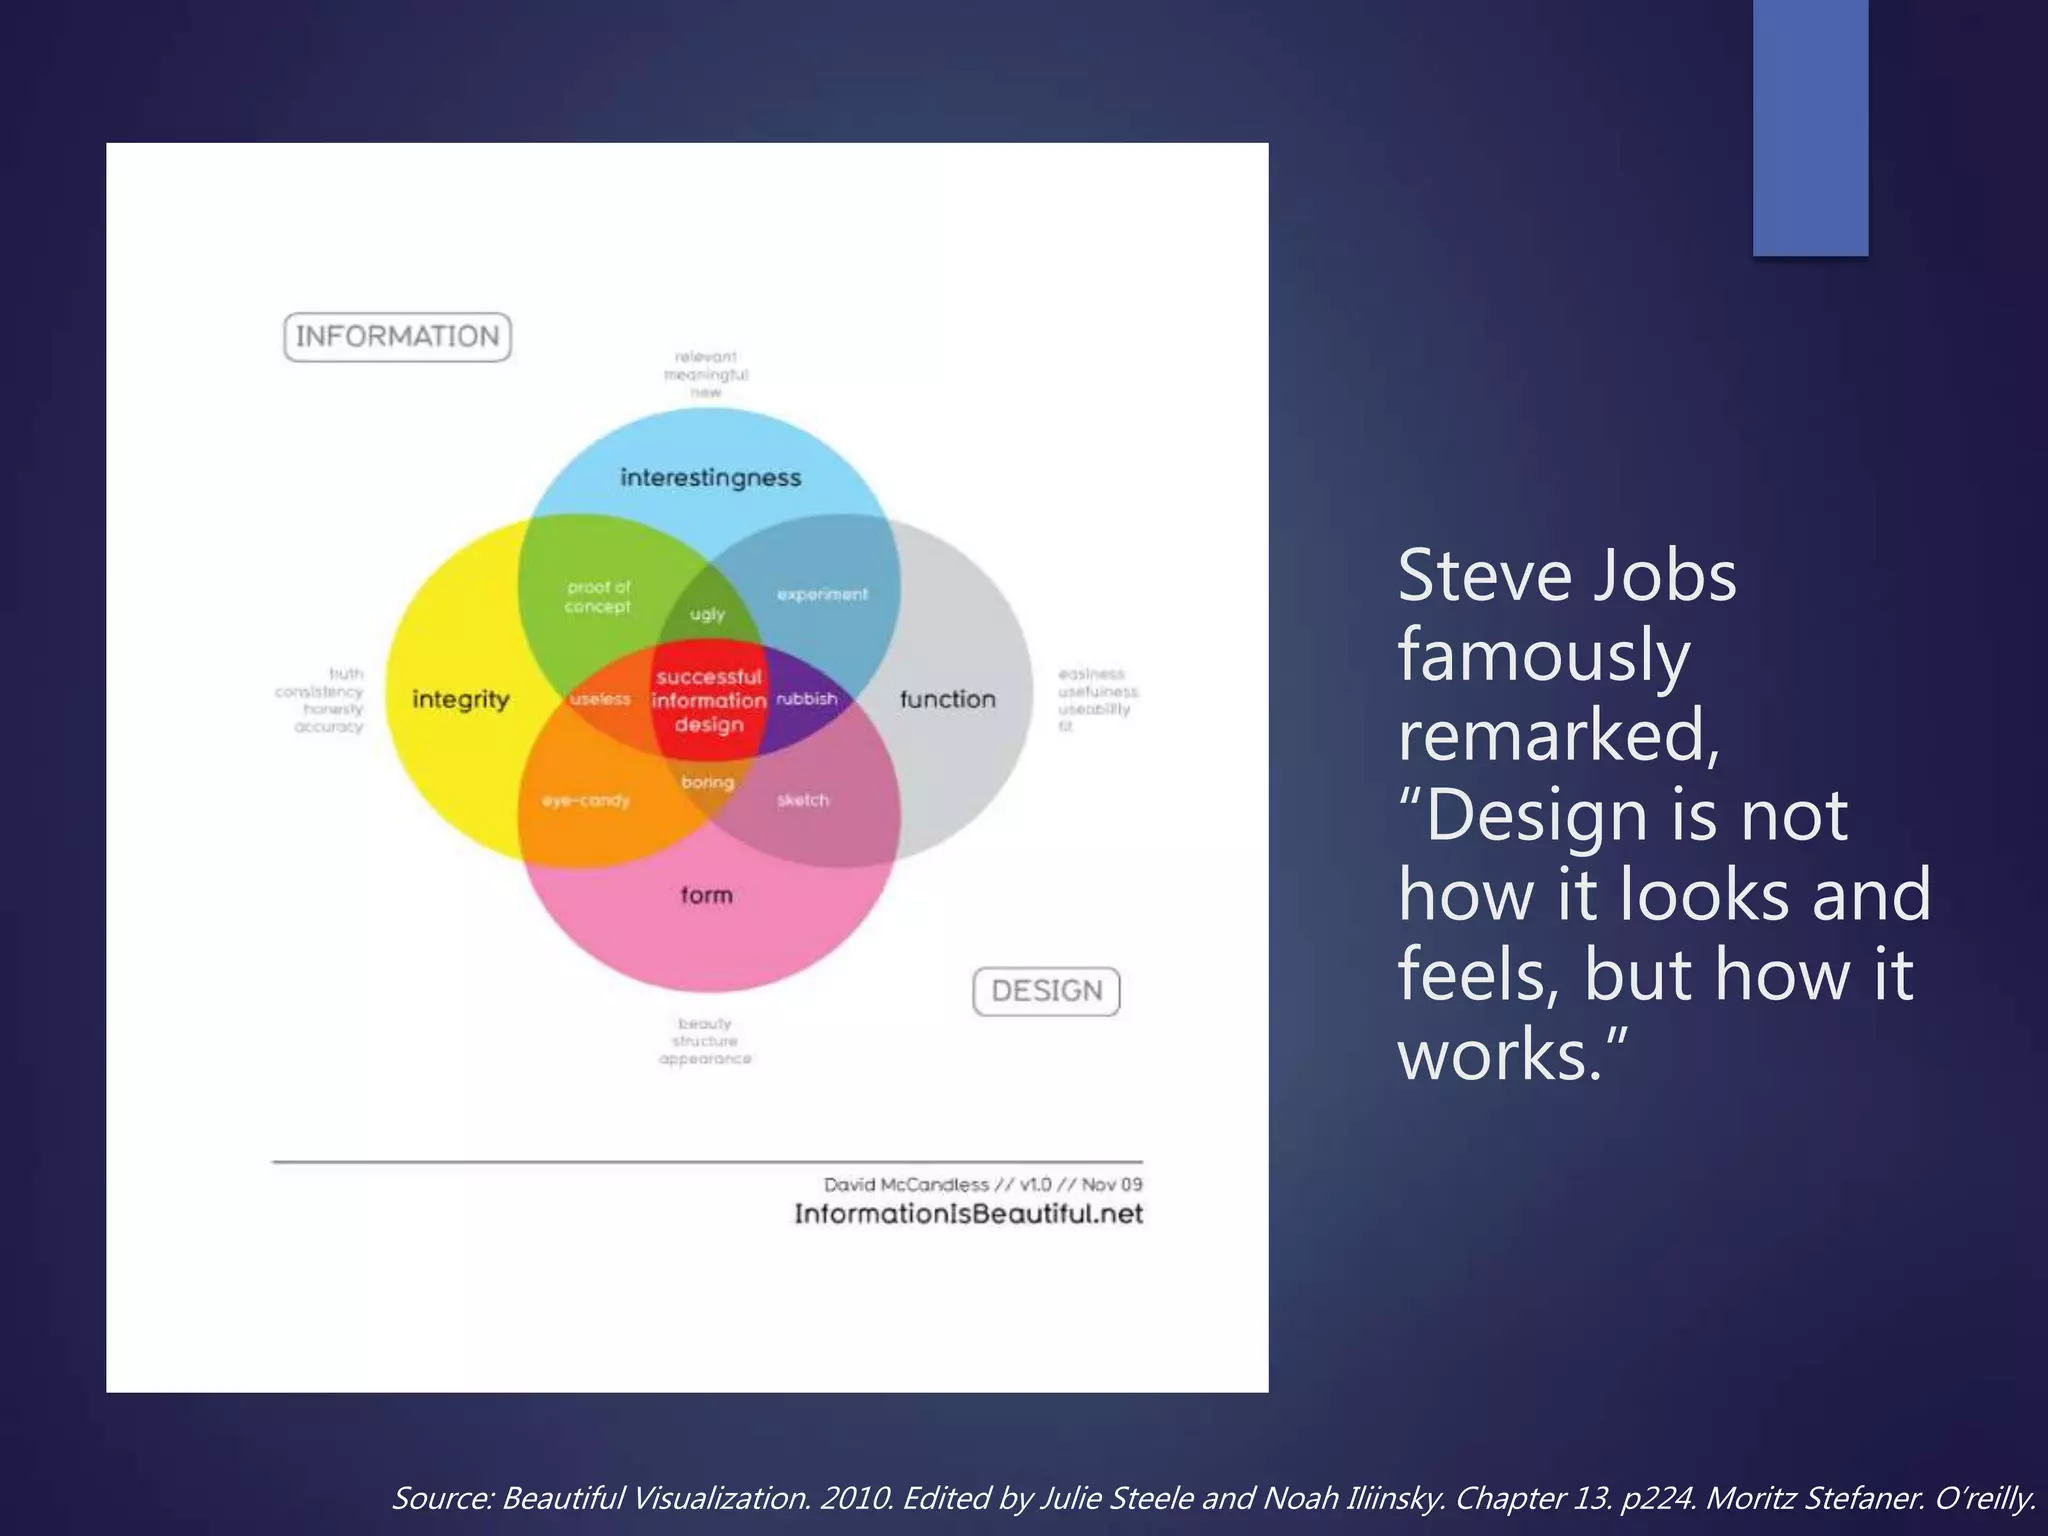
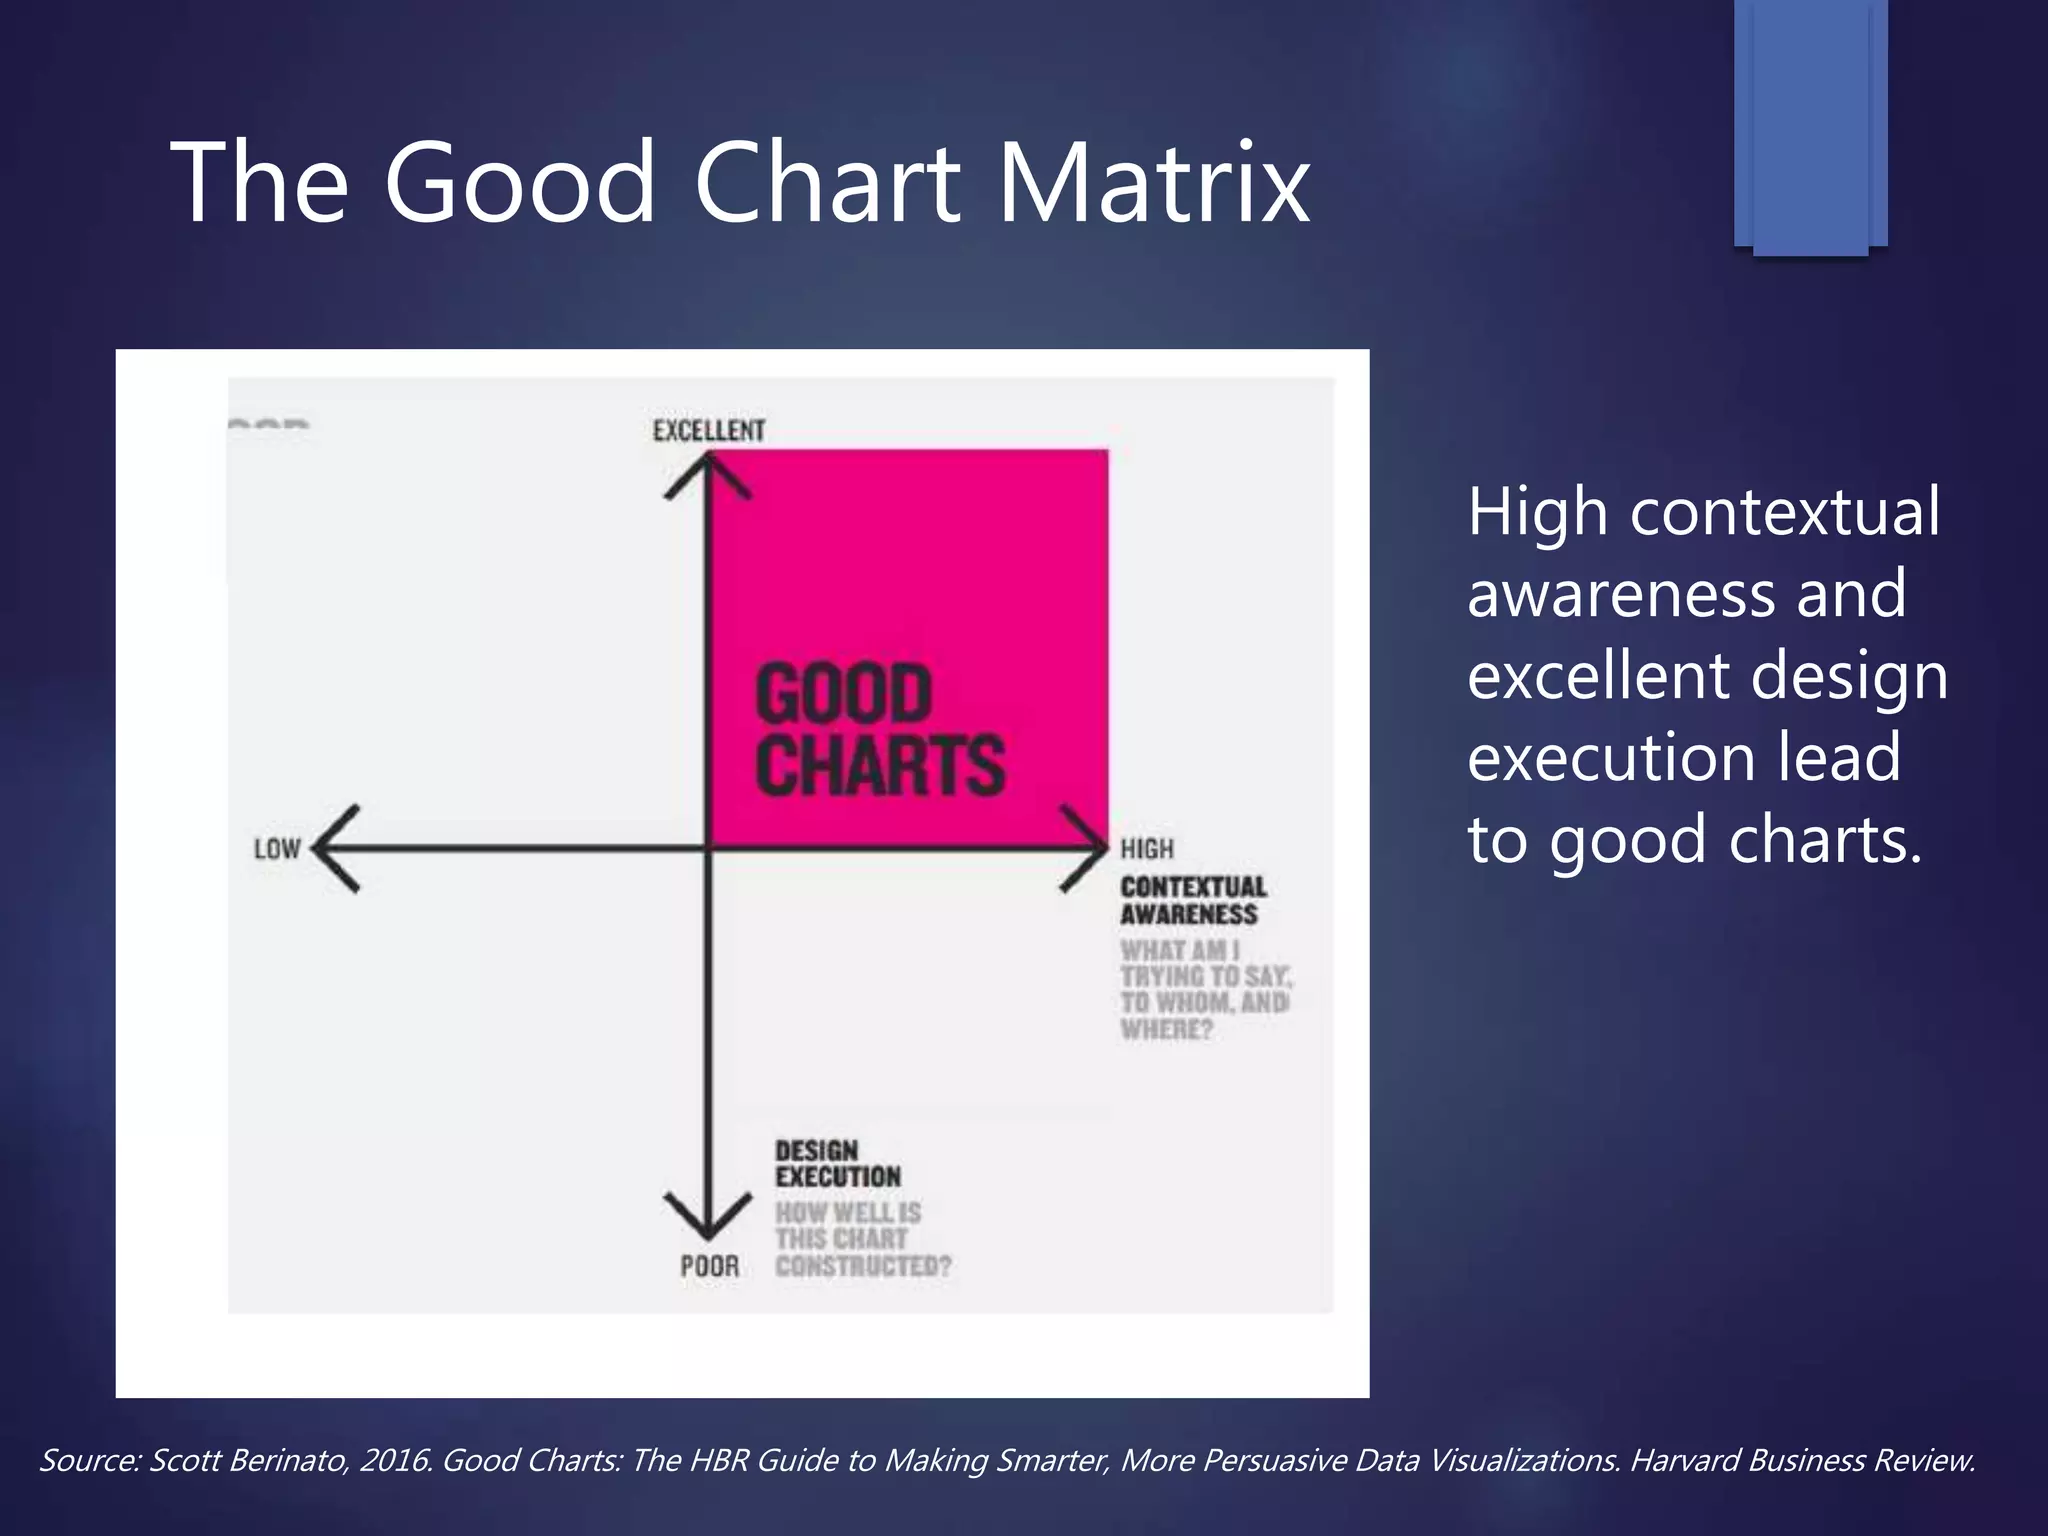
Data
Visualization Best
Practices
DR. SHILPA BALAN
CALIFORNIA STATE UNIVERSITY, LOS ANGELES
BIG DATA DAY LA 2018
Figure Source: https://www.slideshare.net/PeterCochrane/big-data-v-data-mining
What is Visualization?
• Really powerful
visualization
touches both the
mind and the
heart.
Source: Beautiful Visualization. 2010. Edited by Julie Steele and Noah Iliinsky. Chapter 20. Jessica Hagy. O’reilly.
Original Figure Source: http://nobudgettravel.files.wordpress.com/2008/11/elephant-whole1.jpg
• 3 blind men touch
a part of an
elephant to
describe what an
elephant looks
like.
Data Point
Figure Source: https://en.wikipedia.org/wiki/Alpha_Centauri
DATA
VISUALIZATION..POTENTIAL
OF STORYTELLING
Figure Source: https://moz.com/blog/heres-how-to-combine-storytelling-and-data-to-produce-persuasive-content
Storytelling and
visual expression
are integral parts
of human culture
Make sense of data
Figure Source: https://www.huffingtonpost.com/paul-fp-pogue/guide-to-light-bulb-types_b_13675360.html
Let the
Data
Speak
Question +
Visual Data +
Context = Story
Shapes and
symbols are
commonly
used with
maps
Source: Stephen Thomas, 2015. Data Visualization with Javascript. No Starch Press.
DATA
UNCERTAINTY
Pre-attentive
Processing
Focus on certain parts of the data
Source: Evgeniy Yur’evich Gorodov and Vasiliy Vasil’evich Gubarev. Analytical Review of Data Visualization Methods in Application to Big
Data. Journal of Electrical and Computer Engineering. Vol. 2013. 7 pages.
Data
Connections
Source: Shilpa Balan and Joseph Otto. 2017. Business Intelligence in Healthcare with IBM Watson Analytics. CreateSpace.
Visual Focus
Source: Shilpa Balan and Joseph Otto. 2017. Business Intelligence in Healthcare with IBM Watson Analytics. CreateSpace.
Use a
Limited
Color
Palette
Figure Source: https://www.tableau.com/about/blog/2016/7/colors-upgrade-tableau-10-56782
Color Scale Options
Source: Nathan Yau. 2013. Data Points: Visualization That Means Something. p212. Wiley.
Color Blindness
Source: Nathan Yau. 2013. Data Points. Visualization That Means Something. p103. Wiley.
Example of a Bad Chart
Source: Scott Berinato, 2016. Good Charts: The HBR Guide to Making Smarter, More Persuasive Data Visualizations. Harvard Business Review.
Examples of Bad Pie Charts
Source: Rebecca Wolfe, 2014. Data Visualisation: A practical guide to producing effective visualisations for research communication. RESYST.
Scale to Zero
Source: Rebecca Wolfe, 2014. Data Visualisation: A practical guide to producing effective visualisations for research communication. RESYST.
Do not use 3D Charts
Source: Andy Kirk. Visualising Data. 2018. http://www.visualisingdata.com/2015/03/when-3d-works/
3D charts distort
the data by
giving
prominence to
the section
closest to the
front
2018 Major
League
Baseball
Figure Source: https://trends.google.com/trends/story/US_cu_pnJPqmQBAACNWM_en
Narrative Commentary
Data
visualizations
can often be
enhanced by
narrative
commentary.
Source: Stanford Studies Data Storytelling, Techniques, and Design. Marisa Krystian.2016.
https://infogram.com/blog/stanford-studies-data-storytelling-techniques-and-design/
Steve Jobs
famously
remarked,
“Design is not
how it looks and
feels, but how it
works.”
Source: Beautiful Visualization. 2010. Edited by Julie Steele and Noah Iliinsky. Chapter 13. p224. Moritz Stefaner. O’reilly.
The Good Chart Matrix
Source: Scott Berinato, 2016. Good Charts: The HBR Guide to Making Smarter, More Persuasive Data Visualizations. Harvard Business Review.
High contextual
awareness and
excellent design
execution lead
to good charts.
THANK
YOU!

Data Con LA 2018 - Best Practices in Data Visualization by Shilpa Balan