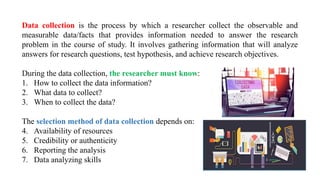
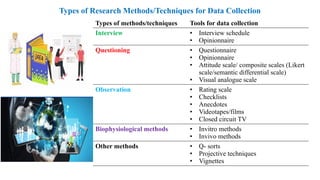
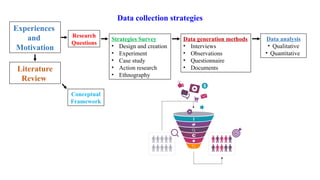
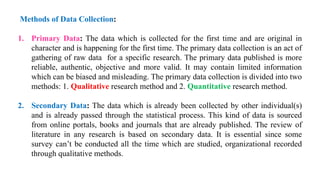
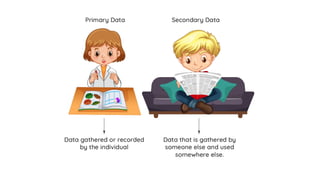
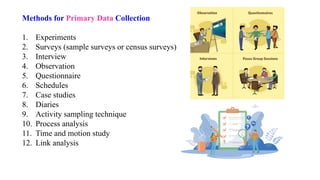
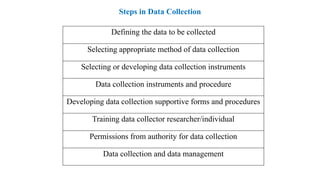
Data Collection In Research Methodology
Dr. Vinod Kumar Patil
Assistant Professor
Department of Food and Nutrition
Faculty of Science
Khaja Bandanawaz University
Kalaburagi, Karnataka
Data collection is the process by which a researcher collect the observable and
measurable data/facts that provides information needed to answer the research
problem in the course of study. It involves gathering information that will analyze
answers for research questions, test hypothesis, and achieve research objectives.
During the data collection, the researcher must know:
1. How to collect the data information?
2. What data to collect?
3. When to collect the data?
The selection method of data collection depends on:
4. Availability of resources
5. Credibility or authenticity
6. Reporting the analysis
7. Data analyzing skills
Advantages of data collection
• Focus on limited energy and
resources which can provide most
impact.
• Aids to understand the research
better.
• Analyse the trends, opinions,
behaviour over time, for effective
decisions based on data.
• Improve and/or resolve issues where
needed and make better strategies.
Factors involved in data collection
• Nature of study
• Type of research subjects
• Type of research study
• Purpose of research study
• Size of research samples
• Distribution of target population
• Time frame of research
• Literacy levels of study
• Research knowledge level and competence
• Availability of resources and manpower
Types of Research Methods/Techniques for Data Collection
Types of methods/techniques Tools for data collection
Interview • Interview schedule
• Opinionnaire
Questioning • Questionnaire
• Opinionnaire
• Attitude scale/ composite scales (Likert
scale/semantic differential scale)
• Visual analogue scale
Observation • Rating scale
• Checklists
• Anecdotes
• Videotapes/films
• Closed circuit TV
Biophysiological methods • Invitro methods
• Invivo methods
Other methods • Q- sorts
• Projective techniques
• Vignettes
Experiences
and
Motivation
Literature
Review
Research
Questions
Conceptual
Framework
Strategies Survey
• Design and creation
• Experiment
• Case study
• Action research
• Ethnography
Data generation methods
• Interviews
• Observations
• Questionnaire
• Documents
Data analysis
• Qualitative
• Quantitative
Data collection strategies
Methods of Data Collection:
1. Primary Data: The data which is collected for the first time and are original in
character and is happening for the first time. The primary data collection is an act of
gathering of raw data for a specific research. The primary data published is more
reliable, authentic, objective and more valid. It may contain limited information
which can be biased and misleading. The primary data collection is divided into two
methods: 1. Qualitative research method and 2. Quantitative research method.
2. Secondary Data: The data which is already been collected by other individual(s)
and is already passed through the statistical process. This kind of data is sourced
from online portals, books and journals that are already published. The review of
literature in any research is based on secondary data. It is essential since some
survey can’t be conducted all the time which are studied, organizational recorded
through qualitative methods.
Methods for Primary Data Collection
1. Experiments
2. Surveys (sample surveys or census surveys)
3. Interview
4. Observation
5. Questionnaire
6. Schedules
7. Case studies
8. Diaries
9. Activity sampling technique
10. Process analysis
11. Time and motion study
12. Link analysis
Primary data (Observation method)
Method Classification Narrative
observation
Sample
observation
Technology assisted
observation
Observation
• Structured observation
• Unstructured observation
• Field note
• Anecdotes
• Rating scales
• Checklists
• Event sampling
• Time sampling
• Photography
• CCTV
• Audiotapes
• videography
• Participant observation
• Non-participant observation
• Controlled observation
• Uncontrolled observation
Observation method of data collection which is directly noted by observation without
asking from the respondent. Usually this type of studies relating to behavioural sciences, and
is sort of observation is not scientific observation. The data from the field studies is collected
with the help of observation by the observer or personally visiting the field.
• The observation characterizing style of recording the information is under standardized
conditions of observation, the units, selection of pertinent data of observation then is
know as structured observation.
• The observation done without any conditions thought before observation is
unstructured observation.
• The observer is member of the group and is studying by observing the people is
participant observation. The participant researcher can record the natural behaviour of
group, verify the truth of statements in context of questionnaire, but is may loose
objectivity of research due to emotional feelings.
• The observer is observing people without any information to the participants is non-
participant observation.
• The observation is accordance to defined plans and experimental procedures is
controlled observation.
• The observation under natural condition without any plans or experimental procedures is
uncontrolled observation.
Primary data (Observation method)
• Field notes is a qualitative notes of an observation made by a researcher in a research
setting, which includes descriptive and reflective narrations of the observed behavior, event,
place or person. It may even included sketches, drawing and diagrams.
• Descriptive information is factual data that is being recorded, includes time and date,
physical setting, social environment, descriptions of the subjects being studied and their roles
in the setting, and the impact that the observer may have had on the environment.
• Anecdotes is a brief, non-judgemental written record of an observed incident. Anecdotes are
record of what, when, where, how event happened and what was said and done.
• An anecdotal record is a short, objective, descriptive summary of one event or incident
writing down after the event has taken place.
• Rating scale is the term used to express the opinion or judgement regarding some
performance of a person, objects, situations or character. Rating scale is a tool in which the
one person simply checks of another person’s level of performance. Rating scale could be
three point, five point, seven points or more points.
• The graphic rating scale is the simplest and most popular method for
appraising performance. In this scale, the performance is printed
horizontally at various points from lowest to highest. It included the
numerical points on the scale.
• Likert Scale is a popular graphic rating scale.
• A checklist is a simple device consisting of a prepared list of items,
which are thought by the researcher to be relevant to the problem, which
is being studied. The checklist consists of a list of items with a place to
check or mark yes or no.
• A checklist is a list of all the things that you need to do, information that
you want to find out, or things that you need to take somewhere, which
you make in order to ensure that you do not forget anything.
Primary data (Observation method)
Requirements
• There are use of sociometric scales if
necessary.
• Detailed field notes.
• More impressions are noted by
photographs.
• In case of
sound/voice/hearing/observed, the
data can be recorded
• Thing/lives observed can be
categorized.
Features
• Selective in nature
• Purposive activity
• Physical and mental activity
• The data collection is eventual
Advantages
• Non-biased information
• Information obtained by researcher is
current observation
• Independent of respondent’s variable
• Large quantities of data is obtained
• All data is usable
• Relatively inexpensive
Disadvantages
• Limited information
• Factors unforeseen may interfere with
observation task
• Respondents opinion can’t be recorded
on certain subjects
• Expensive method
• Require more time
Primary data (Observation method)
Primary data (Interview method)
The collecting data involves presentation or verbal stimuli and reply in terms of oral-
verbal responses. The interviewer asks the questions from respondent which conduct
face to face or telephonic information.
Characteristics of interview
• Usually the interviewer and respondents are strangers.
• The researcher will record the investigator information.
• No limit for a single respondents.
• Non-standardized process, can be modified according to the situation.
Method Classification
Interview
a. Personal interview
• Structured interview (Directive)
• Unstructured interview (Non-Directive)
• Semi-structured interview
• Focused interview
• In-depth interview
• Clinical interview
• Group interview
• Qualitative and quantitative interview
• Individual interview
• Selection interview
b. Telephonic interview
Primary data (Interview method)
a. Personal interview
• The method of collecting information via personal interviews in a structured way and
involves the use of set of predetermined questions of highly standardised techniques of
recording is known by structured interview.
• The flexibility in approach to questions, and do not follow a predetermined questions and
standardised techniques. This method also allows the interviewer much greater freedom
to ask supplementary questions or time and may ask questions according to situations is
known as unstructured interview.
• Focussed interview is denoted when attention is focussed on a given experience of the
respondent and its effects. The interviewer has freedom to decide the sequence of
questions and manner and can explore reasons and motives.
• Clinical interview is studied with the course of an individuals experience with broad
underlying motivations or feelings.
• The interviewer function is simply to encourage the respondent to talk about the topic
provided with minimum direct questions is termed as non-directive interview.
Primary data (Interview method)
• The interview method where the interviewer is carefully selected, trained and briefed for
implementation. The interviewer should be honest, sincere, hardworking, impartial and
possess the technical competence with necessary experience. During this kind of
interviews, the respondents refuse to cooperate, not available to telephonic interviews.
Scientific principles, effort should be made to create friendly atmosphere of trust and
confidence. This type of interview is pre-requisite and basic tenets of interviewing.
• The interview consisting of a group of about 6-8 individuals is known group interview.
• The interview based on subject matter which can be qualitative or quantitative type of data
is qualitative and quantitative interviews.
• The interview is by selecting a single person in particular is individual interview. The
interview when based on collection of data from selection of individuals from selected
people is termed as selection interviews.
• The type of interview when deliberately based to elicit unconscious as well as material
relating to personality dynamics and motivation is in-depth interview.
Primary data (Interview method)
(b) Telephone interviews: The collection of information which consists of contacting
respondents over telephone, it is important part in industrial surveys in developed regions.
This method is quick way of obtaining information, inexpensive way of personal
interviewing method. It has high rate of response over mailing method.
Advantages
• Wider distribution of sample is possible
• Flexible compared to mailing method
• High response rate then mailing method.
• Faster than other methods.
Dis-advantages
• Little time is provided to respondents
• Survey is restricted to respondents
who have telephones
• Bias information may be more
• Intense survey where comprehensive
answers are required was not suitable.
Primary data (Interview method)
• Questionnaire consist of a number of questions printed or typed in a definite order on a
form or set of forms. The questionnaire is sent by email or post to the persons concerned
with a request to answer the questions and return the questionnaire after answering.
• The important points to prepare questions consists of formulate, choosing type of
questions, order instructions, copies, select the respondent, tabulate data collected analyse
and interpret data collected.
• Open ended questions gives the ability to respond in their own words, close ended or
fixed alternative questions allows respondents to choose one of the given alternatives.
• The good questionnaire should be short and simple, follow a sequence from easy to
difficult, technical terms are avoided, adequate space for answering.
Method Classification
Questionnaire
• Open ended questions
• Closed end questions/ fixed
alternative questions
• General form
• Question sequence
• Question wording and formulation
Primary data (Interview method)
Advantages
• Inexpensive method of data collection.
• Free from bias from interviewer.
• Adequate time is given to respondent
to answer.
• Large samples can be used for
research.
• Easy to analyse.
Disadvantages
• Time consuming
• Respondents should be educated and
cooperative for answering certain
questions.
• Slow method of data collection.
• Unclear replies can be seen in some
questions.
• Chances of mis-interpretations.
Primary data (Interview method)
• The questions which provide opportunity to the responded to express their opinions and
answer in their own way is open format questionnaire.
• The questions with alternative replies for respondents from which the subject must choose
the most likely answer is closed format questionnaire.
• Dichotomous questions require the respondent to make choice between two responses as
yes/no or male/female. Multiple choice questions require respondents to make a choice
between more than two responses alternatives.
• Rank order questions refers to the order of responses to be ranked from most favourable to
least favourable questions.
• Contingency questions are asked only if the respondent give a particular responses to
previous questions which are based on personal opinions.
• The respondents judge something along an order dimensions and rate a particular issue on a
scale that ranges from poor to good, these questions are rating questions.
Primary data (Questionnaire method)
• Likert questions help to know the respondents confidence on a particular statement.
These type of questions help to assess how respondents feel towards a certain
issues/services.
• Bipolar questions have two extreme answers to mark his or her response between
opposite ends of the scale.
• Matrix questions include multiple questions and identical response categories are
assigned. The questions are placed one under another forming a matrix. The response
categories are placed under a lop of list of questions down the side.
• Socio-psychological measurements which directs towards quantifying the qualitative
attributes like feelings, attitude, self concepts, perceptions and beliefs.
• Attitude scale is a special type of questionnaire designed to produce score indicating the
intensity and direction of a person feeling about an object or event.
• Semantic differential scale is a rating scale used to derive the respondents attitude
towards the given object or events by asking to select appropriate position on a scale
between two bipolar adjectives.
Primary data (Questionnaire method)
• Visual analogue scale is a psychometric response scale that use to measure the intensity of
certain sensations and feelings, severity of clinical symptoms, functional ability and
attitude towards environmental conditions. It is a bipolar scale to determine the degree of
stimuli a patient experiences.
Primary data (Questionnaire method)
• This method involves the collection of biophysiological data from subjects by using the
specialized equipment's to determine biological and physical status of subjects.
• The purpose is to study basic physiologic process, outcome to nursing care, evaluation
nursing intervention and to correlation of physiologic functioning with patients problems.
• In-vivo biophysiologic method measurements of BP by using sphygmomanometer. •
Cardiac conduction using ECG machine • Temperature using thermometer • Oxygen
saturation using pulse oximeter.
• In-vivo measuring instrument system involves the following 6 components
1. Stimulus
2. Subject
3. Sensory equipment (Transducers & electrodes)
4. Signal conditioning (amplifiers and signals processors)
5. Display equipment
6. Recording equipment (Physiologic measurement are good examples of in-vivo bio- physiologic
measurement TPR, BP).
Primary data (Biophysiological method)
• Invitro Biophysiologic Method is the measurement of the bio-physiologic attributes of the
subjects, which is carried out through collection of sample of data related to physical, bio-
chemical, microbiologic, pathologic and anatomic status by using some technical
instruments and by sending them to laboratory for their analysis and interpretation.
• In-vitro biophysiologic methods, measurements are carried out outside the organism by
using specialized equipment’s.
Advantages
• Measurements are more accurate and
errorless.
• Provide valid measures for targeted
variables.
• Easy access to most instruments.
Disadvantages
• Instrument’s are expensive
• Requires training, knowledge and experiences.
• Results produced by instruments are affected by the
environments.
• Fear and anxiety among participants.
• Some bio-physiologic methods may have harmful
effect on participants.
Primary data (Biophysiological method)
Primary data (Other method)
• Projective technique methods for measuring psychologic attributes (value, attitudes and
personality) by providing respondents with unstructured stimuli to which they respond.
• Projective test is a type of psychological test that assesses a person’s thinking pattern,
observational ability, feelings and attitudes on the basis of responses to ambiguous test
materials. Rorschach test, Haltzman inkblot test, Tomkins Horn picture arrangement test.
• Q-sorts is a powerful tools in which the participants are presented with card arrangement.
In this techniques, participants are provided pre-written cards with words, phrases or
statements and are asked to arrange theses cards in an order along with specific bipolar
dimension. There are approximately 60-100 such cards that can be sorted out in 9-11 piles
with few numbers of cards placed in each piles.
• Vignettes explore people’s beliefs, perceptions and meaning about some particular
situations vignettes as a valuable techniques. The vignette techniques is a method that can
elicit perceptions, opinions, beliefs and attitudes from responses or comments to stories
depicting scenarios and situations. Vignettes are short scenarios in written or pictorial
form, intended to elicit responses to typical scenarios.
• Schedule method one of the important methods for studying social problems. Enumerators
are specially appointed for filling questionnaire aims to respondent and fill the answers in
provided space.
• Enumerators are specially appointed for filling questionnaire Enumerators explain the aim
and objective to respondent and fill the answers in provided space. Thomas Carson
Macormic states “The schedule is nothing more than a list of questions which it seems
necessary to test the hypothesis”.
• Warranty cards are post card size cards sent to customers and feedback collected through
asking questions on that card.
• Distributor or store audits are done by distributors or manufacturer’s salesperson. The
information about inventory in retail shops. It is useful method for knowing market share,
market size, effect of in-store promotion.
• The pantry audits are the observations of pantry of customer to know purchase habit of
people (product quality or brand, etc).
• Consumer panels is the record of consumption of certain customers or repeatedly
interviewed at the specific periods to know their consumption at regular basis.
Primary data (Other method)
• The transitory consumer panel is the study of customers consumptions for limited time
and continuing consumer panel for indefinite period.
• Content analysis is the study on documentary materials such as news paper, books,
magazines about certain characteristics to identify and count.
• Case study is an essentially intensive investigation of particular unit under consideration
such as researcher can take one single unit or more units for study purpose, the study is
intensified on minute details.
• Survey method is one of the common methods of diagnosing and solving social problems.
This method is followed by many research problems which require systematic collection of
data from population through use of personal interviews or data gathering devices.
• Panel method of data collection id data collected from same sample respondents at the
same interval either by email or by personal interview. The use of studies are focused on
expenditure pattern, consumer behaviour, effectiveness of advertising, voting behaviour
and so on.
Primary data (Other method)
Secondary data
Secondary data refers to information that has been collected, processed, and published by
someone else, other than the researcher gathering the data first-hand. This can include data
from sources such as government publications, academic journals, market research reports,
and other existing datasets.
Key purposes of secondary data:
• To gain a better understanding of the research topic: Secondary data can be used to
provide context and background information on a research topic. This can help researchers
understand the historical and social context of their research and gain insights into relevant
variables and relationships.
• To save time and resources: Collecting new primary data can be time-consuming and
expensive. Using existing secondary data sources can save researchers time and resources by
providing access to pre-existing data that has already been collected and organized.
• To provide comparative data: Secondary data can be used to compare and contrast findings
across different studies or datasets. This can help researchers identify trends, patterns, and
relationships that may not have been apparent from individual studies.
Secondary data
Key purposes of secondary data:
• To support triangulation: Triangulation is the process of using multiple sources of data to
confirm or refute research findings. Secondary data can be used to support triangulation by
providing additional sources of data to support or refute primary research findings.
• To supplement primary data: Secondary data can be used to supplement primary data by
providing additional information or insights that were not captured by the primary research.
This can help researchers gain a more complete understanding of the research topic and draw
more robust conclusions.
Secondary data
Secondary data may be used
• When primary data collection is not feasible: Collecting primary data can be time-consuming
and expensive, and in some cases, it may not be feasible to collect primary data. In these
situations, secondary data can provide valuable insights and information.
• When exploring a new research area: Secondary data can be a useful starting point for
researchers who are exploring a new research area. Secondary data can provide context and
background information on a research topic, and can help researchers identify key variables and
relationships to explore further.
• When comparing and contrasting research findings: Secondary data can be used to compare
and contrast findings across different studies or datasets. This can help researchers identify
trends, patterns, and relationships that may not have been apparent from individual studies.
• When triangulating research findings: Triangulation is the process of using multiple sources
of data to confirm or refute research findings. Secondary data can be used to support
triangulation by providing additional sources of data to support or refute primary research
findings.
• When validating research findings: Secondary data can be used to validate primary research
findings by providing additional sources of data that support or refute the primary findings.
Secondary data
Characteristics of secondary data
• Non-reactive: Secondary data are non-reactive, meaning that they are not collected for the specific purpose
of the research study. This means that the researcher has no control over the data collection process, and
cannot influence how the data were collected.
• Time-saving: Secondary data are pre-existing, meaning that they have already been collected and organized
by someone else. This can save the researcher time and resources, as they do not need to collect the data
themselves.
• Wide-ranging: Secondary data sources can provide a wide range of information on a variety of topics. This
can be useful for researchers who are exploring a new research area or seeking to compare and contrast
research findings.
• Less expensive: Secondary data are generally less expensive than primary data, as they do not require the
researcher to incur the costs associated with data collection.
• Potential for bias: Secondary data may be subject to biases that were present in the original data collection
process. For example, data may have been collected using a biased sampling method or the data may be
incomplete or inaccurate.
• Lack of control: The researcher has no control over the data collection process and cannot ensure that the
data were collected using appropriate methods or measures.
• Requires careful evaluation: Secondary data sources must be evaluated carefully to ensure that they are
appropriate for the research question and analysis. This includes assessing the quality, reliability, and validity
of the data sources.
Secondary data
Types of secondary data:
• Published data: The data that has been published in books, magazines, newspapers, and
other print media. Examples include statistical reports, market research reports, and
scholarly articles.
• Government data: The data collected by government agencies and departments. This can
include data on demographics, economic trends, crime rates, and health statistics.
• Commercial data: The data collected by businesses for their own purposes. This can
include sales data, customer feedback, and market research data.
• Academic data: The data collected by researchers for academic purposes. This can include
data from experiments, surveys, and observational studies.
• Online data: The data that is available on the internet which include social media posts,
website analytics, and online customer reviews.
• Organizational data: The data collected by businesses or organizations for their own
purposes, this include data on employee performance, financial records, and customer
satisfaction.
Secondary data
Types of secondary data:
• Historical data: The data that was collected in the past and is still available for research
purposes. This can include census data, historical documents, and archival records.
• International data: The data collected from other countries for research purposes. This
can include data on international trade, health statistics, and demographic trends.
• Public data: The data that is available to the general public. This can include data from
government agencies, non-profit organizations, and other sources.
• Private data: The data that is not available to the general public. This can include
confidential business data, personal medical records, and financial data.
• Big data: The data which are large, complex datasets that are difficult to manage and
analyze using traditional data processing methods. This can include social media data,
sensor data, and other types of data generated by digital devices.
Secondary data
Steps in Data Collection
Defining the data to be collected
Selecting appropriate method of data collection
Selecting or developing data collection instruments
Data collection instruments and procedure
Developing data collection supportive forms and procedures
Training data collector researcher/individual
Permissions from authority for data collection
Data collection and data management
Data quality for collection of secondary data
Validity
• Validity of instruments refers to the degree to which an instrument
measures its supposed to measuring.
• It is the appropriateness, completeness and usefulness of an attribute
measuring instruments.
Reliability
• It is the degree of consistency which attributes or variables are
measured by an instrument.
• It pertains to the consistency of a measure, thought to be reliable if
we get the same result in a repeated manner.
• It defines the ability of an instrument to create reproducible results.
Stability, internal consistency and equivalence are the measures of
reliability.
• Stability of reliability means the instrument provide same results
when used consecutively for two or more times.
• The statistical calculation (Test-retest method) use questionnaire, observation, check list,
rating scales, and physiological measurements tools.
• Interpretation of results indicate perfect reliability (-1.00 through 0.0 and +1.00) and 0.700
indicate acceptable level of reliability.
• Internal consistency/homogeneity ensures all the sub-parts of a research instruments
measure all the same characteristics. A research tool can only be considered internally
consistent if all subparts of the tool are measuring the same characteristics of the
phenomena. Statistical calculation (Split-Half method).
• Equivalence/inter rater/inter observer reliability is estimated by administration of tool to
observe a single event simultaneously and independently by two or more trained observers.
Gathering secondary data:
•Define your research question: Start by defining your research question and identifying the
specific information you need to answer it. This will help you identify the type of secondary
data you need and where to find it.
•Identify relevant sources: Identify potential sources of secondary data, including published
sources, online databases, government sources, and commercial data providers. Consider the
reliability and validity of each source.
•Evaluate the quality of the data: Evaluate the quality and reliability of the data you plan to
use. Consider the data collection methods, sample size, and potential biases. Make sure the
data is relevant to your research question and is suitable for the type of analysis you plan to
conduct.
•Collect the data: Collect the relevant data from the identified sources. Use a consistent
method to record and organize the data to make analysis easier.
Secondary data
Gathering secondary data:
• Validate the data: Validate the data to ensure that it is
accurate and reliable. Check for inconsistencies, missing
data, and errors. Address any issues before analyzing the
data.
• Analyze the data: Analyze the data using appropriate
statistical and analytical methods. Use descriptive and
inferential statistics to summarize and draw conclusions from
the data.
• Interpret the results: Interpret the results of your analysis
and draw conclusions based on the data. Make sure your
conclusions are supported by the data and are relevant to
your research question.
• Communicate the findings: Communicate your findings
clearly and concisely. Use appropriate visual aids such as
graphs and charts to help explain your results.
Secondary data
Formats of secondary data:
• Numeric Data: The data in the form of statistics and
numerical figures that have been compiled and reported
by organizations such as government agencies, research
institutions, and commercial enterprises. This can include
data such as population figures, GDP, sales figures, and
market share.
• Textual Data: The data in the form of written documents,
such as reports, articles, and books. This can include
qualitative data such as descriptions, opinions, and
narratives.
• Audiovisual Data: The data in the form of recordings,
videos, and photographs. This can include data such as
interviews, focus group discussions, and other types of
qualitative data.
Secondary data
Formats of secondary data:
• Geospatial Data: The data in the form of maps,
satellite images, and geographic information systems
(GIS) data. This can include data such as demographic
information, land use patterns, and transportation
networks.
• Transactional Data: The data in the form of digital
records of financial and business transactions. This can
include data such as purchase histories, customer
behavior, and financial transactions.
• Social Media Data: The data in the form of user-
generated content from social media platforms such as
Facebook, Twitter, and Instagram. This can include data
such as user demographics, content trends, and
sentiment analysis.
Secondary data
Secondary Data Collection Methods:
• Published sources: Researchers can gather secondary data from published sources such as
books, journals, reports, and newspapers. These sources often provide comprehensive
information on a variety of topics.
• Online sources: With the growth of the internet, researchers can now access a vast amount
of secondary data online. This includes websites, databases, and online archives.
• Government sources: The data often collect and publish a wide range of secondary data
on topics such as demographics, crime rates, and health statistics. Researchers can obtain
this data through government websites, publications, or data portals.
Secondary data
Secondary Data Collection Methods:
• Commercial sources: Businesses often collect and
analyze data for marketing research or customer
profiling. Researchers can obtain this data through
commercial data providers or by purchasing market
research reports.
• Academic sources: Researchers can also obtain
secondary data from academic sources such as
published research studies, academic journals, and
dissertations.
• Personal contacts: Researchers can also obtain
secondary data from personal contacts, such as experts
in a particular field or individuals with specialized
knowledge.
Secondary data
Secondary data from different fields:
• Healthcare: Hospital records, medical journals, clinical trial data, and disease registries are
examples of secondary data sources in healthcare. These sources can provide researchers
with information on patient demographics, disease prevalence, and treatment outcomes.
• Marketing: Market research reports, customer surveys, and sales data are examples of
secondary data sources in marketing. These sources can provide marketers with
information on consumer preferences, market trends, and competitor activity.
• Education: Student test scores, graduation rates, and enrollment statistics are examples of
secondary data sources in education. These sources can provide researchers with
information on student achievement, teacher effectiveness, and educational disparities.
Secondary data
Secondary data from different fields:
• Finance: Stock market data, financial statements, and credit reports are examples of
secondary data sources in finance. These sources can provide investors with information on
market trends, company performance, and creditworthiness.
• Social Science: Government statistics, census data, and survey data are examples of
secondary data sources in social science. These sources can provide researchers with
information on population demographics, social trends, and political attitudes.
• Environmental Science: Climate data, remote sensing data, and ecological monitoring data
are examples of secondary data sources in environmental science. These sources can
provide researchers with information on weather patterns, land use, and biodiversity.
Secondary data
Data analysis methods of secondary data:
• Descriptive Analysis: This method involves describing the
characteristics of a dataset, such as the mean, standard deviation, and
range of the data. Descriptive analysis can be used to summarize data
and provide an overview of trends.
• Inferential Analysis: This method involves making inferences and
drawing conclusions about a population based on a sample of data.
Inferential analysis can be used to test hypotheses and determine the
statistical significance of relationships between variables.
• Content Analysis: This method involves analyzing textual or visual data
to identify patterns and themes. Content analysis can be used to study
the content of documents, media coverage, and social media posts.
• Time-Series Analysis: This method involves analyzing data over time to
identify trends and patterns. Time-series analysis can be used to study
economic trends, climate change, and other phenomena that change over
time.
Secondary data
Data analysis methods of secondary data:
• Spatial Analysis: This method involves analyzing data in relation to geographic location.
Spatial analysis can be used to study patterns of disease spread, land use patterns, and the
effects of environmental factors on health outcomes.
• Meta-Analysis: This method involves combining data from multiple studies to draw
conclusions about a particular phenomenon. Meta-analysis can be used to synthesize the
results of previous research and provide a more comprehensive understanding of a
particular topic.
Secondary data
Advantages of using secondary data in research
• Time-saving: Collecting primary data can be time-consuming and expensive. Secondary
data can be accessed quickly and easily, which can save researchers time and resources.
• Cost-effective: Secondary data are generally less expensive than primary data, as they do
not require the researcher to incur the costs associated with data collection.
• Wide-ranging: Secondary data sources can provide a wide range of information on a
variety of topics. This can be useful for researchers who are exploring a new research area
or seeking to compare and contrast research findings.
• Large sample size: Secondary data sources often have larger sample sizes than primary
data sources, which can increase the statistical power of the research.
• Access to historical data: Secondary data sources can provide access to historical data,
which can be useful for researchers who are studying trends over time.
• No ethical concerns: Secondary data are already in existence, so there are no ethical
concerns related to collecting data from human subjects.
• May be more objective: Secondary data may be more objective than primary data, as the
data were not collected for the specific purpose of the research study.
Secondary data
Limitations of secondary data
• Lack of control over data quality: Researchers do not have control over the data collection
process, which means they cannot ensure the accuracy or completeness of the data.
• Limited availability: Secondary data may not be available for the specific research question or
study design.
• Lack of information on sampling and data collection methods: Researchers may not have access
to information on the sampling and data collection methods used to gather the secondary data. This
can make it difficult to evaluate the quality of the data.
• Data may not be up-to-date: Secondary data may not be up-to-date or relevant to the current
research question.
• Data may be incomplete or inaccurate: Secondary data may be incomplete or inaccurate due to
missing or incorrect data points, data entry errors, or other factors.
• Biases in data collection: The data may have been collected using biased sampling or data
collection methods, which can limit the validity of the data.
• Lack of control over variables: Researchers have limited control over the variables that were
measured in the original data collection process, which can limit the ability to draw conclusions
about causality.
Secondary data
References:
1. Miles B, Huberman AM. Qualitative data analysis. Thousand Oaks (CA): Sage
Publications; 2009.
2. Guest G, Namey EE, Mitchel ML. Collecting qualitative data: a field manual for
applied research. Thousand Oaks (CA): Sage Publications; 2013.
3. Ferber, R., and Verdoorn, P.J., Research Methods in Economics and Business, New York: The Macmillan
Company, 1962
4. Hillway, T., Introduction to Research, 2nd ed., Boston: Houghton Mifflin, 1964
5. Sharma, H.D., and Mukherji, S.P., Research in Economics and Commerce, Methodology and Surveys,
Varanasi: Indian Biographic Centre, 1976.
6. Jane Sutton and Zubin Austin., Qualitative research: data collection, analysis and management, Research Primer,
Canadian Journal of Hospital Pharmacy, 68, 3, 2015.
7. C. R. Kothari. Research Methodology methods and techniques. New Age International Publishers, New Delhi,
2004.

Data Collection Methods in Research- Dr. Vinod Patil.pptx

  • 1.
    Data Collection InResearch Methodology Dr. Vinod Kumar Patil Assistant Professor Department of Food and Nutrition Faculty of Science Khaja Bandanawaz University Kalaburagi, Karnataka
  • 2.
    Data collection isthe process by which a researcher collect the observable and measurable data/facts that provides information needed to answer the research problem in the course of study. It involves gathering information that will analyze answers for research questions, test hypothesis, and achieve research objectives. During the data collection, the researcher must know: 1. How to collect the data information? 2. What data to collect? 3. When to collect the data? The selection method of data collection depends on: 4. Availability of resources 5. Credibility or authenticity 6. Reporting the analysis 7. Data analyzing skills
  • 3.
    Advantages of datacollection • Focus on limited energy and resources which can provide most impact. • Aids to understand the research better. • Analyse the trends, opinions, behaviour over time, for effective decisions based on data. • Improve and/or resolve issues where needed and make better strategies. Factors involved in data collection • Nature of study • Type of research subjects • Type of research study • Purpose of research study • Size of research samples • Distribution of target population • Time frame of research • Literacy levels of study • Research knowledge level and competence • Availability of resources and manpower
  • 4.
    Types of ResearchMethods/Techniques for Data Collection Types of methods/techniques Tools for data collection Interview • Interview schedule • Opinionnaire Questioning • Questionnaire • Opinionnaire • Attitude scale/ composite scales (Likert scale/semantic differential scale) • Visual analogue scale Observation • Rating scale • Checklists • Anecdotes • Videotapes/films • Closed circuit TV Biophysiological methods • Invitro methods • Invivo methods Other methods • Q- sorts • Projective techniques • Vignettes
  • 5.
    Experiences and Motivation Literature Review Research Questions Conceptual Framework Strategies Survey • Designand creation • Experiment • Case study • Action research • Ethnography Data generation methods • Interviews • Observations • Questionnaire • Documents Data analysis • Qualitative • Quantitative Data collection strategies
  • 6.
    Methods of DataCollection: 1. Primary Data: The data which is collected for the first time and are original in character and is happening for the first time. The primary data collection is an act of gathering of raw data for a specific research. The primary data published is more reliable, authentic, objective and more valid. It may contain limited information which can be biased and misleading. The primary data collection is divided into two methods: 1. Qualitative research method and 2. Quantitative research method. 2. Secondary Data: The data which is already been collected by other individual(s) and is already passed through the statistical process. This kind of data is sourced from online portals, books and journals that are already published. The review of literature in any research is based on secondary data. It is essential since some survey can’t be conducted all the time which are studied, organizational recorded through qualitative methods.
  • 8.
    Methods for PrimaryData Collection 1. Experiments 2. Surveys (sample surveys or census surveys) 3. Interview 4. Observation 5. Questionnaire 6. Schedules 7. Case studies 8. Diaries 9. Activity sampling technique 10. Process analysis 11. Time and motion study 12. Link analysis
  • 9.
    Primary data (Observationmethod) Method Classification Narrative observation Sample observation Technology assisted observation Observation • Structured observation • Unstructured observation • Field note • Anecdotes • Rating scales • Checklists • Event sampling • Time sampling • Photography • CCTV • Audiotapes • videography • Participant observation • Non-participant observation • Controlled observation • Uncontrolled observation Observation method of data collection which is directly noted by observation without asking from the respondent. Usually this type of studies relating to behavioural sciences, and is sort of observation is not scientific observation. The data from the field studies is collected with the help of observation by the observer or personally visiting the field.
  • 10.
    • The observationcharacterizing style of recording the information is under standardized conditions of observation, the units, selection of pertinent data of observation then is know as structured observation. • The observation done without any conditions thought before observation is unstructured observation. • The observer is member of the group and is studying by observing the people is participant observation. The participant researcher can record the natural behaviour of group, verify the truth of statements in context of questionnaire, but is may loose objectivity of research due to emotional feelings. • The observer is observing people without any information to the participants is non- participant observation. • The observation is accordance to defined plans and experimental procedures is controlled observation. • The observation under natural condition without any plans or experimental procedures is uncontrolled observation. Primary data (Observation method)
  • 11.
    Primary data (Observationmethod) • Field notes is a qualitative notes of an observation made by a researcher in a research setting, which includes descriptive and reflective narrations of the observed behavior, event, place or person. It may even included sketches, drawing and diagrams. • Descriptive information is factual data that is being recorded, includes time and date, physical setting, social environment, descriptions of the subjects being studied and their roles in the setting, and the impact that the observer may have had on the environment. • Anecdotes is a brief, non-judgemental written record of an observed incident. Anecdotes are record of what, when, where, how event happened and what was said and done. • An anecdotal record is a short, objective, descriptive summary of one event or incident writing down after the event has taken place. • Rating scale is the term used to express the opinion or judgement regarding some performance of a person, objects, situations or character. Rating scale is a tool in which the one person simply checks of another person’s level of performance. Rating scale could be three point, five point, seven points or more points.
  • 12.
    • The graphicrating scale is the simplest and most popular method for appraising performance. In this scale, the performance is printed horizontally at various points from lowest to highest. It included the numerical points on the scale. • Likert Scale is a popular graphic rating scale. • A checklist is a simple device consisting of a prepared list of items, which are thought by the researcher to be relevant to the problem, which is being studied. The checklist consists of a list of items with a place to check or mark yes or no. • A checklist is a list of all the things that you need to do, information that you want to find out, or things that you need to take somewhere, which you make in order to ensure that you do not forget anything. Primary data (Observation method)
  • 13.
    Primary data (Observationmethod) Requirements • There are use of sociometric scales if necessary. • Detailed field notes. • More impressions are noted by photographs. • In case of sound/voice/hearing/observed, the data can be recorded • Thing/lives observed can be categorized. Features • Selective in nature • Purposive activity • Physical and mental activity • The data collection is eventual
  • 14.
    Advantages • Non-biased information •Information obtained by researcher is current observation • Independent of respondent’s variable • Large quantities of data is obtained • All data is usable • Relatively inexpensive Disadvantages • Limited information • Factors unforeseen may interfere with observation task • Respondents opinion can’t be recorded on certain subjects • Expensive method • Require more time Primary data (Observation method)
  • 15.
    Primary data (Interviewmethod) The collecting data involves presentation or verbal stimuli and reply in terms of oral- verbal responses. The interviewer asks the questions from respondent which conduct face to face or telephonic information. Characteristics of interview • Usually the interviewer and respondents are strangers. • The researcher will record the investigator information. • No limit for a single respondents. • Non-standardized process, can be modified according to the situation.
  • 16.
    Method Classification Interview a. Personalinterview • Structured interview (Directive) • Unstructured interview (Non-Directive) • Semi-structured interview • Focused interview • In-depth interview • Clinical interview • Group interview • Qualitative and quantitative interview • Individual interview • Selection interview b. Telephonic interview Primary data (Interview method)
  • 17.
    a. Personal interview •The method of collecting information via personal interviews in a structured way and involves the use of set of predetermined questions of highly standardised techniques of recording is known by structured interview. • The flexibility in approach to questions, and do not follow a predetermined questions and standardised techniques. This method also allows the interviewer much greater freedom to ask supplementary questions or time and may ask questions according to situations is known as unstructured interview. • Focussed interview is denoted when attention is focussed on a given experience of the respondent and its effects. The interviewer has freedom to decide the sequence of questions and manner and can explore reasons and motives. • Clinical interview is studied with the course of an individuals experience with broad underlying motivations or feelings. • The interviewer function is simply to encourage the respondent to talk about the topic provided with minimum direct questions is termed as non-directive interview. Primary data (Interview method)
  • 18.
    • The interviewmethod where the interviewer is carefully selected, trained and briefed for implementation. The interviewer should be honest, sincere, hardworking, impartial and possess the technical competence with necessary experience. During this kind of interviews, the respondents refuse to cooperate, not available to telephonic interviews. Scientific principles, effort should be made to create friendly atmosphere of trust and confidence. This type of interview is pre-requisite and basic tenets of interviewing. • The interview consisting of a group of about 6-8 individuals is known group interview. • The interview based on subject matter which can be qualitative or quantitative type of data is qualitative and quantitative interviews. • The interview is by selecting a single person in particular is individual interview. The interview when based on collection of data from selection of individuals from selected people is termed as selection interviews. • The type of interview when deliberately based to elicit unconscious as well as material relating to personality dynamics and motivation is in-depth interview. Primary data (Interview method)
  • 19.
    (b) Telephone interviews:The collection of information which consists of contacting respondents over telephone, it is important part in industrial surveys in developed regions. This method is quick way of obtaining information, inexpensive way of personal interviewing method. It has high rate of response over mailing method. Advantages • Wider distribution of sample is possible • Flexible compared to mailing method • High response rate then mailing method. • Faster than other methods. Dis-advantages • Little time is provided to respondents • Survey is restricted to respondents who have telephones • Bias information may be more • Intense survey where comprehensive answers are required was not suitable. Primary data (Interview method)
  • 20.
    • Questionnaire consistof a number of questions printed or typed in a definite order on a form or set of forms. The questionnaire is sent by email or post to the persons concerned with a request to answer the questions and return the questionnaire after answering. • The important points to prepare questions consists of formulate, choosing type of questions, order instructions, copies, select the respondent, tabulate data collected analyse and interpret data collected. • Open ended questions gives the ability to respond in their own words, close ended or fixed alternative questions allows respondents to choose one of the given alternatives. • The good questionnaire should be short and simple, follow a sequence from easy to difficult, technical terms are avoided, adequate space for answering. Method Classification Questionnaire • Open ended questions • Closed end questions/ fixed alternative questions • General form • Question sequence • Question wording and formulation Primary data (Interview method)
  • 21.
    Advantages • Inexpensive methodof data collection. • Free from bias from interviewer. • Adequate time is given to respondent to answer. • Large samples can be used for research. • Easy to analyse. Disadvantages • Time consuming • Respondents should be educated and cooperative for answering certain questions. • Slow method of data collection. • Unclear replies can be seen in some questions. • Chances of mis-interpretations. Primary data (Interview method)
  • 22.
    • The questionswhich provide opportunity to the responded to express their opinions and answer in their own way is open format questionnaire. • The questions with alternative replies for respondents from which the subject must choose the most likely answer is closed format questionnaire. • Dichotomous questions require the respondent to make choice between two responses as yes/no or male/female. Multiple choice questions require respondents to make a choice between more than two responses alternatives. • Rank order questions refers to the order of responses to be ranked from most favourable to least favourable questions. • Contingency questions are asked only if the respondent give a particular responses to previous questions which are based on personal opinions. • The respondents judge something along an order dimensions and rate a particular issue on a scale that ranges from poor to good, these questions are rating questions. Primary data (Questionnaire method)
  • 23.
    • Likert questionshelp to know the respondents confidence on a particular statement. These type of questions help to assess how respondents feel towards a certain issues/services. • Bipolar questions have two extreme answers to mark his or her response between opposite ends of the scale. • Matrix questions include multiple questions and identical response categories are assigned. The questions are placed one under another forming a matrix. The response categories are placed under a lop of list of questions down the side. • Socio-psychological measurements which directs towards quantifying the qualitative attributes like feelings, attitude, self concepts, perceptions and beliefs. • Attitude scale is a special type of questionnaire designed to produce score indicating the intensity and direction of a person feeling about an object or event. • Semantic differential scale is a rating scale used to derive the respondents attitude towards the given object or events by asking to select appropriate position on a scale between two bipolar adjectives. Primary data (Questionnaire method)
  • 24.
    • Visual analoguescale is a psychometric response scale that use to measure the intensity of certain sensations and feelings, severity of clinical symptoms, functional ability and attitude towards environmental conditions. It is a bipolar scale to determine the degree of stimuli a patient experiences. Primary data (Questionnaire method)
  • 25.
    • This methodinvolves the collection of biophysiological data from subjects by using the specialized equipment's to determine biological and physical status of subjects. • The purpose is to study basic physiologic process, outcome to nursing care, evaluation nursing intervention and to correlation of physiologic functioning with patients problems. • In-vivo biophysiologic method measurements of BP by using sphygmomanometer. • Cardiac conduction using ECG machine • Temperature using thermometer • Oxygen saturation using pulse oximeter. • In-vivo measuring instrument system involves the following 6 components 1. Stimulus 2. Subject 3. Sensory equipment (Transducers & electrodes) 4. Signal conditioning (amplifiers and signals processors) 5. Display equipment 6. Recording equipment (Physiologic measurement are good examples of in-vivo bio- physiologic measurement TPR, BP). Primary data (Biophysiological method)
  • 26.
    • Invitro BiophysiologicMethod is the measurement of the bio-physiologic attributes of the subjects, which is carried out through collection of sample of data related to physical, bio- chemical, microbiologic, pathologic and anatomic status by using some technical instruments and by sending them to laboratory for their analysis and interpretation. • In-vitro biophysiologic methods, measurements are carried out outside the organism by using specialized equipment’s. Advantages • Measurements are more accurate and errorless. • Provide valid measures for targeted variables. • Easy access to most instruments. Disadvantages • Instrument’s are expensive • Requires training, knowledge and experiences. • Results produced by instruments are affected by the environments. • Fear and anxiety among participants. • Some bio-physiologic methods may have harmful effect on participants. Primary data (Biophysiological method)
  • 27.
    Primary data (Othermethod) • Projective technique methods for measuring psychologic attributes (value, attitudes and personality) by providing respondents with unstructured stimuli to which they respond. • Projective test is a type of psychological test that assesses a person’s thinking pattern, observational ability, feelings and attitudes on the basis of responses to ambiguous test materials. Rorschach test, Haltzman inkblot test, Tomkins Horn picture arrangement test. • Q-sorts is a powerful tools in which the participants are presented with card arrangement. In this techniques, participants are provided pre-written cards with words, phrases or statements and are asked to arrange theses cards in an order along with specific bipolar dimension. There are approximately 60-100 such cards that can be sorted out in 9-11 piles with few numbers of cards placed in each piles. • Vignettes explore people’s beliefs, perceptions and meaning about some particular situations vignettes as a valuable techniques. The vignette techniques is a method that can elicit perceptions, opinions, beliefs and attitudes from responses or comments to stories depicting scenarios and situations. Vignettes are short scenarios in written or pictorial form, intended to elicit responses to typical scenarios.
  • 28.
    • Schedule methodone of the important methods for studying social problems. Enumerators are specially appointed for filling questionnaire aims to respondent and fill the answers in provided space. • Enumerators are specially appointed for filling questionnaire Enumerators explain the aim and objective to respondent and fill the answers in provided space. Thomas Carson Macormic states “The schedule is nothing more than a list of questions which it seems necessary to test the hypothesis”. • Warranty cards are post card size cards sent to customers and feedback collected through asking questions on that card. • Distributor or store audits are done by distributors or manufacturer’s salesperson. The information about inventory in retail shops. It is useful method for knowing market share, market size, effect of in-store promotion. • The pantry audits are the observations of pantry of customer to know purchase habit of people (product quality or brand, etc). • Consumer panels is the record of consumption of certain customers or repeatedly interviewed at the specific periods to know their consumption at regular basis. Primary data (Other method)
  • 29.
    • The transitoryconsumer panel is the study of customers consumptions for limited time and continuing consumer panel for indefinite period. • Content analysis is the study on documentary materials such as news paper, books, magazines about certain characteristics to identify and count. • Case study is an essentially intensive investigation of particular unit under consideration such as researcher can take one single unit or more units for study purpose, the study is intensified on minute details. • Survey method is one of the common methods of diagnosing and solving social problems. This method is followed by many research problems which require systematic collection of data from population through use of personal interviews or data gathering devices. • Panel method of data collection id data collected from same sample respondents at the same interval either by email or by personal interview. The use of studies are focused on expenditure pattern, consumer behaviour, effectiveness of advertising, voting behaviour and so on. Primary data (Other method)
  • 30.
    Secondary data Secondary datarefers to information that has been collected, processed, and published by someone else, other than the researcher gathering the data first-hand. This can include data from sources such as government publications, academic journals, market research reports, and other existing datasets.
  • 31.
    Key purposes ofsecondary data: • To gain a better understanding of the research topic: Secondary data can be used to provide context and background information on a research topic. This can help researchers understand the historical and social context of their research and gain insights into relevant variables and relationships. • To save time and resources: Collecting new primary data can be time-consuming and expensive. Using existing secondary data sources can save researchers time and resources by providing access to pre-existing data that has already been collected and organized. • To provide comparative data: Secondary data can be used to compare and contrast findings across different studies or datasets. This can help researchers identify trends, patterns, and relationships that may not have been apparent from individual studies. Secondary data
  • 32.
    Key purposes ofsecondary data: • To support triangulation: Triangulation is the process of using multiple sources of data to confirm or refute research findings. Secondary data can be used to support triangulation by providing additional sources of data to support or refute primary research findings. • To supplement primary data: Secondary data can be used to supplement primary data by providing additional information or insights that were not captured by the primary research. This can help researchers gain a more complete understanding of the research topic and draw more robust conclusions. Secondary data
  • 33.
    Secondary data maybe used • When primary data collection is not feasible: Collecting primary data can be time-consuming and expensive, and in some cases, it may not be feasible to collect primary data. In these situations, secondary data can provide valuable insights and information. • When exploring a new research area: Secondary data can be a useful starting point for researchers who are exploring a new research area. Secondary data can provide context and background information on a research topic, and can help researchers identify key variables and relationships to explore further. • When comparing and contrasting research findings: Secondary data can be used to compare and contrast findings across different studies or datasets. This can help researchers identify trends, patterns, and relationships that may not have been apparent from individual studies. • When triangulating research findings: Triangulation is the process of using multiple sources of data to confirm or refute research findings. Secondary data can be used to support triangulation by providing additional sources of data to support or refute primary research findings. • When validating research findings: Secondary data can be used to validate primary research findings by providing additional sources of data that support or refute the primary findings. Secondary data
  • 34.
    Characteristics of secondarydata • Non-reactive: Secondary data are non-reactive, meaning that they are not collected for the specific purpose of the research study. This means that the researcher has no control over the data collection process, and cannot influence how the data were collected. • Time-saving: Secondary data are pre-existing, meaning that they have already been collected and organized by someone else. This can save the researcher time and resources, as they do not need to collect the data themselves. • Wide-ranging: Secondary data sources can provide a wide range of information on a variety of topics. This can be useful for researchers who are exploring a new research area or seeking to compare and contrast research findings. • Less expensive: Secondary data are generally less expensive than primary data, as they do not require the researcher to incur the costs associated with data collection. • Potential for bias: Secondary data may be subject to biases that were present in the original data collection process. For example, data may have been collected using a biased sampling method or the data may be incomplete or inaccurate. • Lack of control: The researcher has no control over the data collection process and cannot ensure that the data were collected using appropriate methods or measures. • Requires careful evaluation: Secondary data sources must be evaluated carefully to ensure that they are appropriate for the research question and analysis. This includes assessing the quality, reliability, and validity of the data sources. Secondary data
  • 35.
    Types of secondarydata: • Published data: The data that has been published in books, magazines, newspapers, and other print media. Examples include statistical reports, market research reports, and scholarly articles. • Government data: The data collected by government agencies and departments. This can include data on demographics, economic trends, crime rates, and health statistics. • Commercial data: The data collected by businesses for their own purposes. This can include sales data, customer feedback, and market research data. • Academic data: The data collected by researchers for academic purposes. This can include data from experiments, surveys, and observational studies. • Online data: The data that is available on the internet which include social media posts, website analytics, and online customer reviews. • Organizational data: The data collected by businesses or organizations for their own purposes, this include data on employee performance, financial records, and customer satisfaction. Secondary data
  • 36.
    Types of secondarydata: • Historical data: The data that was collected in the past and is still available for research purposes. This can include census data, historical documents, and archival records. • International data: The data collected from other countries for research purposes. This can include data on international trade, health statistics, and demographic trends. • Public data: The data that is available to the general public. This can include data from government agencies, non-profit organizations, and other sources. • Private data: The data that is not available to the general public. This can include confidential business data, personal medical records, and financial data. • Big data: The data which are large, complex datasets that are difficult to manage and analyze using traditional data processing methods. This can include social media data, sensor data, and other types of data generated by digital devices. Secondary data
  • 38.
    Steps in DataCollection Defining the data to be collected Selecting appropriate method of data collection Selecting or developing data collection instruments Data collection instruments and procedure Developing data collection supportive forms and procedures Training data collector researcher/individual Permissions from authority for data collection Data collection and data management
  • 39.
    Data quality forcollection of secondary data Validity • Validity of instruments refers to the degree to which an instrument measures its supposed to measuring. • It is the appropriateness, completeness and usefulness of an attribute measuring instruments. Reliability • It is the degree of consistency which attributes or variables are measured by an instrument. • It pertains to the consistency of a measure, thought to be reliable if we get the same result in a repeated manner. • It defines the ability of an instrument to create reproducible results. Stability, internal consistency and equivalence are the measures of reliability. • Stability of reliability means the instrument provide same results when used consecutively for two or more times.
  • 40.
    • The statisticalcalculation (Test-retest method) use questionnaire, observation, check list, rating scales, and physiological measurements tools. • Interpretation of results indicate perfect reliability (-1.00 through 0.0 and +1.00) and 0.700 indicate acceptable level of reliability. • Internal consistency/homogeneity ensures all the sub-parts of a research instruments measure all the same characteristics. A research tool can only be considered internally consistent if all subparts of the tool are measuring the same characteristics of the phenomena. Statistical calculation (Split-Half method). • Equivalence/inter rater/inter observer reliability is estimated by administration of tool to observe a single event simultaneously and independently by two or more trained observers.
  • 41.
    Gathering secondary data: •Defineyour research question: Start by defining your research question and identifying the specific information you need to answer it. This will help you identify the type of secondary data you need and where to find it. •Identify relevant sources: Identify potential sources of secondary data, including published sources, online databases, government sources, and commercial data providers. Consider the reliability and validity of each source. •Evaluate the quality of the data: Evaluate the quality and reliability of the data you plan to use. Consider the data collection methods, sample size, and potential biases. Make sure the data is relevant to your research question and is suitable for the type of analysis you plan to conduct. •Collect the data: Collect the relevant data from the identified sources. Use a consistent method to record and organize the data to make analysis easier. Secondary data
  • 42.
    Gathering secondary data: •Validate the data: Validate the data to ensure that it is accurate and reliable. Check for inconsistencies, missing data, and errors. Address any issues before analyzing the data. • Analyze the data: Analyze the data using appropriate statistical and analytical methods. Use descriptive and inferential statistics to summarize and draw conclusions from the data. • Interpret the results: Interpret the results of your analysis and draw conclusions based on the data. Make sure your conclusions are supported by the data and are relevant to your research question. • Communicate the findings: Communicate your findings clearly and concisely. Use appropriate visual aids such as graphs and charts to help explain your results. Secondary data
  • 43.
    Formats of secondarydata: • Numeric Data: The data in the form of statistics and numerical figures that have been compiled and reported by organizations such as government agencies, research institutions, and commercial enterprises. This can include data such as population figures, GDP, sales figures, and market share. • Textual Data: The data in the form of written documents, such as reports, articles, and books. This can include qualitative data such as descriptions, opinions, and narratives. • Audiovisual Data: The data in the form of recordings, videos, and photographs. This can include data such as interviews, focus group discussions, and other types of qualitative data. Secondary data
  • 44.
    Formats of secondarydata: • Geospatial Data: The data in the form of maps, satellite images, and geographic information systems (GIS) data. This can include data such as demographic information, land use patterns, and transportation networks. • Transactional Data: The data in the form of digital records of financial and business transactions. This can include data such as purchase histories, customer behavior, and financial transactions. • Social Media Data: The data in the form of user- generated content from social media platforms such as Facebook, Twitter, and Instagram. This can include data such as user demographics, content trends, and sentiment analysis. Secondary data
  • 45.
    Secondary Data CollectionMethods: • Published sources: Researchers can gather secondary data from published sources such as books, journals, reports, and newspapers. These sources often provide comprehensive information on a variety of topics. • Online sources: With the growth of the internet, researchers can now access a vast amount of secondary data online. This includes websites, databases, and online archives. • Government sources: The data often collect and publish a wide range of secondary data on topics such as demographics, crime rates, and health statistics. Researchers can obtain this data through government websites, publications, or data portals. Secondary data
  • 46.
    Secondary Data CollectionMethods: • Commercial sources: Businesses often collect and analyze data for marketing research or customer profiling. Researchers can obtain this data through commercial data providers or by purchasing market research reports. • Academic sources: Researchers can also obtain secondary data from academic sources such as published research studies, academic journals, and dissertations. • Personal contacts: Researchers can also obtain secondary data from personal contacts, such as experts in a particular field or individuals with specialized knowledge. Secondary data
  • 47.
    Secondary data fromdifferent fields: • Healthcare: Hospital records, medical journals, clinical trial data, and disease registries are examples of secondary data sources in healthcare. These sources can provide researchers with information on patient demographics, disease prevalence, and treatment outcomes. • Marketing: Market research reports, customer surveys, and sales data are examples of secondary data sources in marketing. These sources can provide marketers with information on consumer preferences, market trends, and competitor activity. • Education: Student test scores, graduation rates, and enrollment statistics are examples of secondary data sources in education. These sources can provide researchers with information on student achievement, teacher effectiveness, and educational disparities. Secondary data
  • 48.
    Secondary data fromdifferent fields: • Finance: Stock market data, financial statements, and credit reports are examples of secondary data sources in finance. These sources can provide investors with information on market trends, company performance, and creditworthiness. • Social Science: Government statistics, census data, and survey data are examples of secondary data sources in social science. These sources can provide researchers with information on population demographics, social trends, and political attitudes. • Environmental Science: Climate data, remote sensing data, and ecological monitoring data are examples of secondary data sources in environmental science. These sources can provide researchers with information on weather patterns, land use, and biodiversity. Secondary data
  • 49.
    Data analysis methodsof secondary data: • Descriptive Analysis: This method involves describing the characteristics of a dataset, such as the mean, standard deviation, and range of the data. Descriptive analysis can be used to summarize data and provide an overview of trends. • Inferential Analysis: This method involves making inferences and drawing conclusions about a population based on a sample of data. Inferential analysis can be used to test hypotheses and determine the statistical significance of relationships between variables. • Content Analysis: This method involves analyzing textual or visual data to identify patterns and themes. Content analysis can be used to study the content of documents, media coverage, and social media posts. • Time-Series Analysis: This method involves analyzing data over time to identify trends and patterns. Time-series analysis can be used to study economic trends, climate change, and other phenomena that change over time. Secondary data
  • 50.
    Data analysis methodsof secondary data: • Spatial Analysis: This method involves analyzing data in relation to geographic location. Spatial analysis can be used to study patterns of disease spread, land use patterns, and the effects of environmental factors on health outcomes. • Meta-Analysis: This method involves combining data from multiple studies to draw conclusions about a particular phenomenon. Meta-analysis can be used to synthesize the results of previous research and provide a more comprehensive understanding of a particular topic. Secondary data
  • 51.
    Advantages of usingsecondary data in research • Time-saving: Collecting primary data can be time-consuming and expensive. Secondary data can be accessed quickly and easily, which can save researchers time and resources. • Cost-effective: Secondary data are generally less expensive than primary data, as they do not require the researcher to incur the costs associated with data collection. • Wide-ranging: Secondary data sources can provide a wide range of information on a variety of topics. This can be useful for researchers who are exploring a new research area or seeking to compare and contrast research findings. • Large sample size: Secondary data sources often have larger sample sizes than primary data sources, which can increase the statistical power of the research. • Access to historical data: Secondary data sources can provide access to historical data, which can be useful for researchers who are studying trends over time. • No ethical concerns: Secondary data are already in existence, so there are no ethical concerns related to collecting data from human subjects. • May be more objective: Secondary data may be more objective than primary data, as the data were not collected for the specific purpose of the research study. Secondary data
  • 52.
    Limitations of secondarydata • Lack of control over data quality: Researchers do not have control over the data collection process, which means they cannot ensure the accuracy or completeness of the data. • Limited availability: Secondary data may not be available for the specific research question or study design. • Lack of information on sampling and data collection methods: Researchers may not have access to information on the sampling and data collection methods used to gather the secondary data. This can make it difficult to evaluate the quality of the data. • Data may not be up-to-date: Secondary data may not be up-to-date or relevant to the current research question. • Data may be incomplete or inaccurate: Secondary data may be incomplete or inaccurate due to missing or incorrect data points, data entry errors, or other factors. • Biases in data collection: The data may have been collected using biased sampling or data collection methods, which can limit the validity of the data. • Lack of control over variables: Researchers have limited control over the variables that were measured in the original data collection process, which can limit the ability to draw conclusions about causality. Secondary data
  • 53.
    References: 1. Miles B,Huberman AM. Qualitative data analysis. Thousand Oaks (CA): Sage Publications; 2009. 2. Guest G, Namey EE, Mitchel ML. Collecting qualitative data: a field manual for applied research. Thousand Oaks (CA): Sage Publications; 2013. 3. Ferber, R., and Verdoorn, P.J., Research Methods in Economics and Business, New York: The Macmillan Company, 1962 4. Hillway, T., Introduction to Research, 2nd ed., Boston: Houghton Mifflin, 1964 5. Sharma, H.D., and Mukherji, S.P., Research in Economics and Commerce, Methodology and Surveys, Varanasi: Indian Biographic Centre, 1976. 6. Jane Sutton and Zubin Austin., Qualitative research: data collection, analysis and management, Research Primer, Canadian Journal of Hospital Pharmacy, 68, 3, 2015. 7. C. R. Kothari. Research Methodology methods and techniques. New Age International Publishers, New Delhi, 2004.