Why a ManagerNeeds to Know About Statistics
To Know How to Properly Present Information
To Know How to Draw Conclusions about Populations
Based on Sample Information
To Know How to Improve Processes
To Know How to Obtain Reliable Forecasts
3.
Why We NeedData
To Provide Input to Survey
To Provide Input to Study
To Measure Performance of Ongoing Service or
Production Process
To Evaluate Conformance to Standards
To Assist in Formulating Alternative Courses of
Action
To Satisfy Curiosity
4.
Exploring the Data
The task of data collection begins after a research problem has been defined and research
design/plan chalked out.
The collection of data is the important task in the research methodology. Before explaining the
methods of data collection, researcher should understand the need of the study and decide the type
of the data required
Source of Data:
The Researcher should keep in mind two types of data:
1. Primary
2. Secondary
The Primary Data : Those which are collected afresh and for the first time, and thus
happen to be original in character.
The secondary data : Those which have already been collected by someone else and
which have already been passed through the statistical process.
The distinction between Primary and Secondary data can be made more clear on the
basis of documents:
1. Primary data : Documented as record
2. Secondary data : Documented as report
5.
Exploring the DataContd….
The researcher has to decide which type of data he would like
to use for this study and accordingly he will have to select
particular type of data base.
The data collection methods differ in each type of data to be
collected by the researcher personally, where as in secondary
data it is only compilation of the data already collected.
We describe the different methods of data collection, with the
pros and cons of each method.
6.
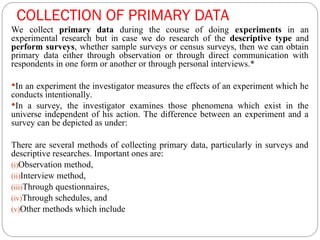
COLLECTION OF PRIMARYDATA
We collect primary data during the course of doing experiments in an
experimental research but in case we do research of the descriptive type and
perform surveys, whether sample surveys or census surveys, then we can obtain
primary data either through observation or through direct communication with
respondents in one form or another or through personal interviews.*
In an experiment the investigator measures the effects of an experiment which he
conducts intentionally.
In a survey, the investigator examines those phenomena which exist in the
universe independent of his action. The difference between an experiment and a
survey can be depicted as under:
There are several methods of collecting primary data, particularly in surveys and
descriptive researches. Important ones are:
(i)Observation method,
(ii)Interview method,
(iii)Through questionnaires,
(iv)Through schedules, and
(v)Other methods which include
7.
Collection of PrimaryData
Other Methods:
(a) Warranty cards;
(b) Distributor audits;
(c) Pantry audits;
(d) Consumer panels;
(e) Using mechanical devices;
(f) Through projective techniques;
(g) Depth interviews, and
(h) Content analysis.
We briefly take up each method separately.
8.
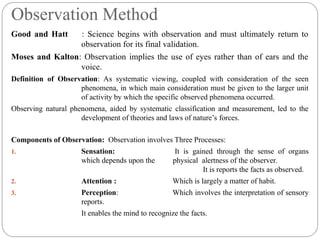
Observation Method
Good andHatt : Science begins with observation and must ultimately return to
observation for its final validation.
Moses and Kalton: Observation implies the use of eyes rather than of ears and the
voice.
Definition of Observation: As systematic viewing, coupled with consideration of the seen
phenomena, in which main consideration must be given to the larger unit
of activity by which the specific observed phenomena occurred.
Observing natural phenomena, aided by systematic classification and measurement, led to the
development of theories and laws of nature’s forces.
Components of Observation: Observation involves Three Processes:
1. Sensation: It is gained through the sense of organs
which depends upon the physical alertness of the observer.
It is reports the facts as observed.
2. Attention : Which is largely a matter of habit.
3. Perception: Which involves the interpretation of sensory
reports.
It enables the mind to recognize the facts.
9.
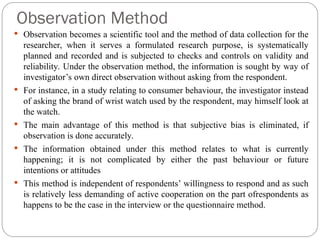
Observation Method
Observationbecomes a scientific tool and the method of data collection for the
researcher, when it serves a formulated research purpose, is systematically
planned and recorded and is subjected to checks and controls on validity and
reliability. Under the observation method, the information is sought by way of
investigator’s own direct observation without asking from the respondent.
For instance, in a study relating to consumer behaviour, the investigator instead
of asking the brand of wrist watch used by the respondent, may himself look at
the watch.
The main advantage of this method is that subjective bias is eliminated, if
observation is done accurately.
The information obtained under this method relates to what is currently
happening; it is not complicated by either the past behaviour or future
intentions or attitudes
This method is independent of respondents’ willingness to respond and as such
is relatively less demanding of active cooperation on the part ofrespondents as
happens to be the case in the interview or the questionnaire method.
10.
Characteristics of Observation
1.Observation is at once a physical as well as mental activity. The use of sense organs
is involved as in observation one has to see or hear something.
2. Observation is selective because one has to observe the range of those things which
fall within the observation
3. Observation is purposive. Observation is limited to those facts and details which
help in achieving the specified objectives of research.
4. Observation has to be efficient. Mere one is not enough. There should be scientific
thinking. Further, these observations should be based on tools of research which
have been properly standardized.
5. In observation the researcher makes direct study. It is a classical scientific method
for the collection primary and dependable data.
6. Through observation, it is possible to establish cause – effect relationship in social
phenomena. The investigator first of all observes things and then collect data.
Aids of Observation: Diaries, note-books, schedules, photographs and maps are the
commonly used devices for observation.
11.
Observation method hasvarious limitations
It is an expensive method.
The information provided by this method is very limited.
Sometimes unforeseen factors may interfere with the observational task.
At times, the fact that some people are rarely accessible to direct observation
creates obstacle for this method to collect data effectively.
The researcher should keep in mind things like:
What should be observed?
How the observations should be recorded? Or how the accuracy of observation can be ensured?
Incase the observation is characterized by a careful definition of the units to be observed,
The style of recording the observed information, standardized conditions of observation and the
selection of pertinent data of observation, then the observation is called as structured observation.
Generally, controlled observation takes place in various experiments that are carried out in a
laboratory or under controlled conditions
Whereas uncontrolled observation is resorted to in case of exploratory researches.
12.
Interview Method
Theinterview method is one of the important methods of primary data collection.
It is a confiscation between the observer and respondent. It is oral-verbal questions and
corresponding oral – verbal response to the queries made.
Definition of interviews:
PV Young : The interview may be regarded as a systematic method by which one persons enters
more or less legitimately into the inner life of another who is generally a stranger to him.
Hsin Pao Yang: The interview is a technique of field work which is used to watch the behaviour of an
individual or individuals, to record statements, to observe the concrete results of social or group
interactions.
CA Master : In a formal interview pre-determined questions are asked and the answers are collected
in a certain way.
The interviews can be conducted personally or though telephones.
The concept of interview, usually understood as face -to- face encounter, can be extended to include
telephone interviews and in today’s context, video interviews.
13.
Interview Method
Theinterview method of collecting data involves presentation of oral-verbal
stimuli and reply in terms of oral-verbal responses.
This method can be used through personal interviews and, if possible, through
telephone interviews.
Personal interviews: Personal interview method requires a person known as the
interviewer asking questions generally in a face-to-face contact to the other
person or persons.
At times the interviewee may also ask certain questions and the interviewer
responds to these, but usually the interviewer initiates the interview and collects
the information.
This sort of interview may be in the form of direct personal investigation or it
may be indirect oral investigation.
Direct personal investigation: He has to be on the spot and has to meet people
from whom data have to be collected.
This method is particularly suitable for intensive investigations.
14.
Interview Method
Indirect oralexamination can be conducted under which the interviewer has to
cross-examine other persons who are supposed to have knowledge about the
problem under investigation and the information, obtained is recorded.
Most of the commissions and committees appointed by government to carry on
investigations make use of this method.
Major advantages of personal interviews:
1. More information and that too in greater depth can be obtained.
2. There is greater flexibility under this method as the opportunity to restructure
questions is always there, specially in case of unstructured interviews.
3. Observation method can as well be applied to recording verbal answers to
various questions.
4. Personal information can as well be obtained easily under this method.
5. The interviewer can collect supplementary information about the respondent’s
personal characteristics and environment which is often of great value in
interpreting results.
15.
Interview Method
Weaknesses ofpersonal interviews:
1. It is a very expensive method, specially when large and widely spread
geographical sample is taken.
2. There remains the possibility of the bias of interviewer as well as that of the
respondent; there also remains the headache of supervision and control of
interviewers.
3. Certain types of respondents such as important officials or executives or people
in high income groups may not be easily approachable under this method and to
that extent the data may prove inadequate.
4. The presence of the interviewer on the spot may over-stimulate the respondent,
sometimes even to the extent that he may give imaginary information just to
make the interview interesting.
5. Under the interview method the organization required for selecting, training and
supervising the field-staff is more complex with formidable problems.
6. Interviewing at times may also introduce systematic errors.
16.
Interview Method
Telephone interviews:his method of collecting information consists in
contacting respondents on telephone itself. It is not a very widely used
method, but plays important part in industrial surveys, particularly in
developed regions.
The chief merits of such a system are:
1. It is more flexible in comparison to mailing method.
2. It is faster than other methods i.e., a quick way of obtaining information.
3. It is cheaper than personal interviewing method; here the cost per response is relatively low.
4. Recall is easy; callbacks are simple and economical.
5. There is a higher rate of response than what we have in mailing method; the non-response is
generally very low.
6. Replies can be recorded without causing embarrassment to respondents.
7. Interviewer can explain requirements more easily.
8. At times, access can be gained to respondents who otherwise cannot be contacted for one reason
or the other.
9. No field staff is required.
10. Representative and wider distribution of sample is possible
17.
Interview Method Contd….
Telephoneinterviews
Demerits of collecting information are:
1. Little time is given to respondents for considered answers; interview
period is not likely to exceed five minutes in most cases.
2. Surveys are restricted to respondents who have telephone facilities.
3. Extensive geographical coverage may get restricted by cost considerations.
4. It is not suitable for intensive surveys where comprehensive answers are
required to various questions.
5. Possibility of the bias of the interviewer is relatively more.
6. Questions have to be short and to the point; probes are difficult to handle.
18.
COLLECTION OF DATATHROUGH QUESTIONNAIRES
This method of data collection is quite popular, particularly in case of big
enquiries. It is being adopted by private individuals, research workers, private
and public organisations and even by governments.
In this method a questionnaire is sent (usually by post) to the persons
concerned with a request to answer the questions and return the questionnaire.
A questionnaire consists of a number of questions printed or typed in a
definite order on a form or set of forms.
The questionnaire is mailed to respondents who are expected to read and
understand the questions and write down the reply in the space meant for the
purpose in the questionnaire itself. The respondents have to answer the
questions on their own.
The method of collecting data by mailing the questionnaires to respondents is
most extensively employed in various economic and business surveys.
19.
COLLECTION OF DATATHROUGH QUESTIONNAIRES
Contd…
The opening questions should be such as to arouse human
interest. The following type of questions should generally
be avoided as opening questions in a questionnaire:
1. Questions that put too great a strain on the memory or
intellect of the respondent;
2. Questions of a personal character;
3. Questions related to personal wealth, etc.
20.
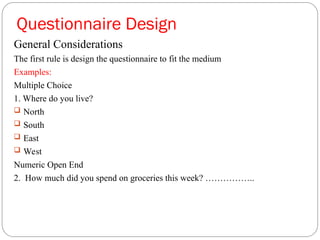
Questionnaire Design
General Considerations
Thefirst rule is design the questionnaire to fit the medium
Examples:
Multiple Choice
1. Where do you live?
North
South
East
West
Numeric Open End
2. How much did you spend on groceries this week? ……………..
21.
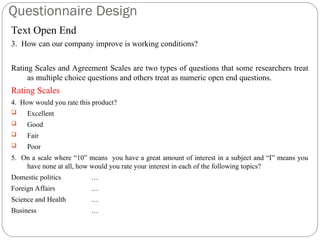
Questionnaire Design
Text OpenEnd
3. How can our company improve is working conditions?
Rating Scales and Agreement Scales are two types of questions that some researchers treat
as multiple choice questions and others treat as numeric open end questions.
Rating Scales
4. How would you rate this product?
Excellent
Good
Fair
Poor
5. On a scale where “10” means you have a great amount of interest in a subject and “I” means you
have none at all, how would you rate your interest in each of the following topics?
Domestic politics …
Foreign Affairs …
Science and Health …
Business …
22.
Questionnaire Design
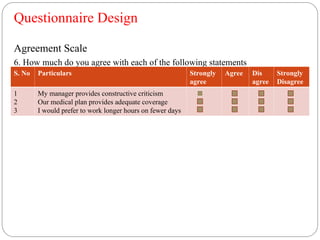
Agreement Scale
6.How much do you agree with each of the following statements
S. No Particulars Strongly
agree
Agree Dis
agree
Strongly
Disagree
1
2
3
My manager provides constructive criticism
Our medical plan provides adequate coverage
I would prefer to work longer hours on fewer days
23.
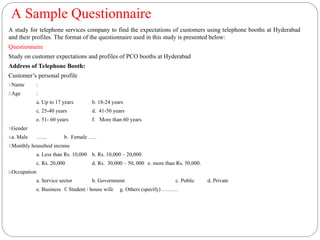
A Sample Questionnaire
Astudy for telephone services company to find the expectations of customers using telephone booths at Hyderabad
and their profiles. The format of the questionnaire used in this study is presented below:
Questionnaire
Study on customer expectations and profiles of PCO booths at Hyderabad
Address of Telephone Booth:
Customer’s personal profile
1.Name :
2.Age :
a. Up to 17 years b. 18-24 years
c. 25-40 years d. 41-50 years
e. 51- 60 years f. More than 60 years
3.Gender
4.a. Male …… b. Female …..
5.Monthly househod income
a. Less than Rs. 10,000 b. Rs. 10,000 – 20,000
c. Rs. 20,000 d. Rs. 30,000 – 50, 000 e. more than Rs. 50,000.
6.Occupation
a. Service sector b. Government c. Public d. Private
e. Business f. Student / house wife g. Others (specify) ………
24.
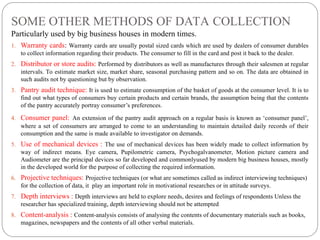
SOME OTHER METHODSOF DATA COLLECTION
Particularly used by big business houses in modern times.
1. Warranty cards: Warranty cards are usually postal sized cards which are used by dealers of consumer durables
to collect information regarding their products. The consumer to fill in the card and post it back to the dealer.
2. Distributor or store audits: Performed by distributors as well as manufactures through their salesmen at regular
intervals. To estimate market size, market share, seasonal purchasing pattern and so on. The data are obtained in
such audits not by questioning but by observation.
3. Pantry audit technique: It is used to estimate consumption of the basket of goods at the consumer level. It is to
find out what types of consumers buy certain products and certain brands, the assumption being that the contents
of the pantry accurately portray consumer’s preferences.
4. Consumer panel: An extension of the pantry audit approach on a regular basis is known as ‘consumer panel’,
where a set of consumers are arranged to come to an understanding to maintain detailed daily records of their
consumption and the same is made available to investigator on demands.
5. Use of mechanical devices : The use of mechanical devices has been widely made to collect information by
way of indirect means. Eye camera, Pupilometric camera, Psychogalvanometer, Motion picture camera and
Audiometer are the principal devices so far developed and commonlyused by modern big business houses, mostly
in the developed world for the purpose of collecting the required information.
6. Projective techniques: Projective techniques (or what are sometimes called as indirect interviewing techniques)
for the collection of data, it play an important role in motivational researches or in attitude surveys.
7. Depth interviews : Depth interviews are held to explore needs, desires and feelings of respondents Unless the
researcher has specialized training, depth interviewing should not be attempted
8. Content-analysis : Content-analysis consists of analysing the contents of documentary materials such as books,
magazines, newspapers and the contents of all other verbal materials.
25.
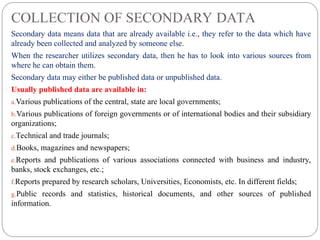
COLLECTION OF SECONDARYDATA
Secondary data means data that are already available i.e., they refer to the data which have
already been collected and analyzed by someone else.
When the researcher utilizes secondary data, then he has to look into various sources from
where he can obtain them.
Secondary data may either be published data or unpublished data.
Usually published data are available in:
a.Various publications of the central, state are local governments;
b.Various publications of foreign governments or of international bodies and their subsidiary
organizations;
c.Technical and trade journals;
d.Books, magazines and newspapers;
e.Reports and publications of various associations connected with business and industry,
banks, stock exchanges, etc.;
f.Reports prepared by research scholars, Universities, Economists, etc. In different fields;
g.Public records and statistics, historical documents, and other sources of published
information.
26.
COLLECTION OF SECONDARYDATA Contd….
The sources of unpublished data are many: It may be found in diaries, letters, unpublished
biographies and autobiographies and also may be available with scholars and research workers,
trade associations, labour bureaus and other public/private individuals and organisations.
Researcher must be very careful in using secondary data. By way of caution, the researcher,
before using secondary data, must see that they possess following characteristics:
1.Reliability of data: Reliability can be tested by finding out
(a) Who collected the data? (b) What were the sources of data?
(c) Were they collected by using proper methods (d) At what time were they collected?
(e) Was there any bias of the compiler? (f) What level of accuracy was desired? Was it
achieved ?
2.Suitability of data: The data that are suitable for one enquiry may not necessarily be found suitable
in another enquiry.
3.Adequacy of data: If the level of accuracy achieved in data is found inadequate for the purpose of
the present enquiry, they will be considered as inadequate and should not be used by the researcher.
From all this we can say that it is very risky to use the already available data. The already
available data should be used by the researcher only when he finds them reliable, suitable and
adequate.
27.
Description and analysisof Data
Technically speaking, description implies editing, coding, classification and
tabulation of collected data so that they are amenable to analysis.
The term analysis refers to the computation of certain measures along with
searching for patterns of relationship that exist among data-groups.
Thus, “in the process of analysis, relationships or differences supporting or
conflicting with original or new hypotheses should be subjected to statistical
tests of significance to determine with what validity data an be said to indicate
any conclusions”.
Editing: A routine work,
it has to be carried out with utmost care and devotion,
Checking the filled questionnaires,
Coding: It is an operation which requires judgment, skill, particularly for developing the coding
frame Reducing the mass data into manageable proportion
Classification: Tabulation of data is a common tool
It is used for summarizing the data so that they are amenable for interpretation
Summarizing data into tabular form.
28.
Description Operations
Editing: Editingof data is a process of examining the collected raw data
(specially in surveys) to detect errors and omissions and to
correct these when possible. It involves a careful scrutiny of the
completed questionnaires and/or schedules.
Field editing:
• Consists in the review of the reporting forms by the investigator for
completing (translating or rewriting)
• This type of editing is necessary in view of the fact that individual
writing styles often can be difficult for others to decipher.
Central editing:
• It should take place when all forms or schedules have been
completed and returned to the office. This type of editing implies
that all forms should get a thorough editing by a single editor in a
small study and by a team of editors in case of a large inquiry.
29.
Coding:
•Coding refers tothe process of assigning numerals or other symbols to
answers so that responses can be put into a limited number of categories or
classes.
•Coding is necessary for efficient analysis and through it the several replies
may be reduced to a small number of classes which contain the critical
information required for analysis.
Classification:
•Most research studies result in a large volume of raw data which must be
reduced into homogeneous groups if we are to get meaningful relationships.
1.Classification according to attributes: Data are classified on the basis of common
characteristics which can either be descriptive (such as literacy, sex, honesty, etc.) or numerical
(such as weight, height, income, etc.).
2.Classification according to class-intervals : The numerical characteristics refer to quantitative
phenomenon which can be measured through some statistical units. Data relating to income,
production, age, weight, etc.
Description Operations Contd…..
30.
Tabulation: When amass of data has been assembled, it becomes
necessary for the researcher to arrange the same in some kind
of concise and logical order. This procedure is referred to as
tabulation.
Tabulation is essential because of the following reasons:
1. It conserves space and reduces explanatory and descriptive
statement to a minimum.
2. It facilitates the process of comparison.
3. It facilitates the summation of items and the detection of
errors and omissions.
4. It provides a basis for various statistical computations.
Description Operations Contd…..
31.
Need for Sampling
Samplingis used in practice for a variety of reasons such as:
1. Sampling can save time and money. A sample study is usually less expensive than a
census study and produces results at a relatively faster speed.
2. Sampling may enable more accurate measurements for a sample study is generally
conducted by trained and experienced investigators.
3. Sampling remains the only way when population contains infinitely many members.
4. Sampling remains the only choice when a test involves the destruction of the item
under study.
5. Sampling usually enables to estimate the sampling errors and, thus, assists in
obtaining information concerning some characteristic of the population.
32.
Sample Design
The followingare to considered for a sample design:
i. Nature of universe: Universe may be either homogenous or heterogenous in
nature. If the items of the universe are homogenous, a small sample can serve
the purpose. But if the items are heteogenous, a large sample would be
required. Technically, this can be termed as the dispersion factor.
ii. Number of classes proposed: If many class-groups (groups and sub-groups)
are to be formed, a large sample would be required because a small sample
might not be able to give a reasonable number of items in each class-group.
iii. Nature of study: If items are to be intensively and continuously studied, the
sample should be small. For a general survey the size of the sample should
be large, but a small sample is considered appropriate in technical surveys.
iv. Type of sampling: Sampling technique plays an important part in
determining the size of the sample. A small random sample is apt to be much
superior to a larger but badly selected sample.
33.
Sample Design Contd…
v.Standard of accuracy and acceptable confidence level: If the standard of
accuracy or the level of precision is to be kept high, we shall require
relatively larger sample. For doubling the accuracy for a fixed significance
level, the sample size has to be increased fourfold.
vi. Availability of finance: In practice, size of the sample depends upon the
amount of money available for the study purposes. This factor should be
kept in view while determining the size of sample for large samples result
in increasing the cost of sampling estimates.
vii. Other considerations: Nature of units, size of the population, size of
questionnaire, availability of trained investigators, the conditions under
which the sample is being conducted, the time available for completion of
the study are a few other considerations to which a researcher must pay
attention while selecting the size of the sample.
34.
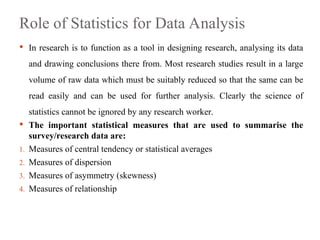
Role of Statisticsfor Data Analysis
In research is to function as a tool in designing research, analysing its data
and drawing conclusions there from. Most research studies result in a large
volume of raw data which must be suitably reduced so that the same can be
read easily and can be used for further analysis. Clearly the science of
statistics cannot be ignored by any research worker.
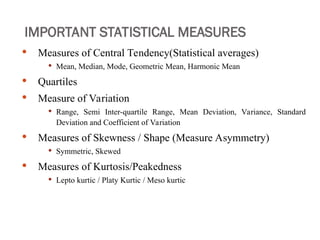
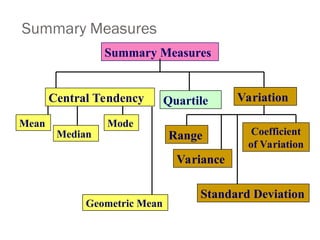
The important statistical measures that are used to summarise the
survey/research data are:
1. Measures of central tendency or statistical averages
2. Measures of dispersion
3. Measures of asymmetry (skewness)
4. Measures of relationship
35.
Some Important Definitions
A Population (Universe) is the whole collection of things under
consideration
A Sample is a Portion of the population selected for analysis
A Parameter is a Summary measure computed to describe the
characteristic of a population
A Statistic is a Summary measure computed to describe the characteristic
of a sample
36.
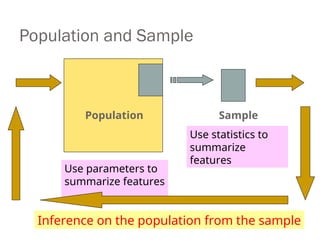
Population and Sample
PopulationSample
Use parameters to
summarize features
Use statistics to
summarize
features
Inference on the population from the sample
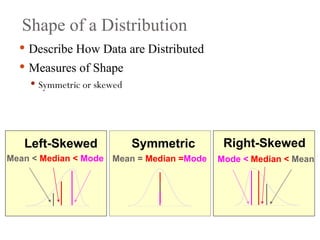
Shape of aDistribution
Describe How Data are Distributed
Measures of Shape
Symmetric or skewed
Mean = Median =Mode
Mean < Median < Mode Mode < Median < Mean
Right-Skewed
Left-Skewed Symmetric
41.
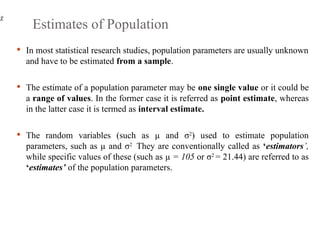
Estimates of Population
In most statistical research studies, population parameters are usually unknown
and have to be estimated from a sample.
The estimate of a population parameter may be one single value or it could be
a range of values. In the former case it is referred as point estimate, whereas
in the latter case it is termed as interval estimate.
The random variables (such as µ and σ2
) used to estimate population
parameters, such as µ and σ2
They are conventionally called as ‘estimators’,
while specific values of these (such as µ = 105 or σ2
= 21.44) are referred to as
‘estimates’ of the population parameters.
42.
Parametric and Non-ParametricMethods
Statisticians have developed several tests of hypotheses (also known
as the tests of significance) for the purpose of testing of hypotheses
which can be classified as:
1. Parametric tests or Standard tests of hypotheses
2. Non-parametric tests or Distribution-free test of hypotheses
Parametric tests usually assume certain properties of the parent population
from which we draw samples. Assumptions like observations come from a
normal population, sample size is large, assumptions about the population
parameters like mean, variance, etc., must hold good before parametric tests
can be used.
The important parametric tests are:
(1) z-test; (2) t-test; (3) ѱ2
-test, and (4) F-test.
43.
Parametric and Non-ParametricMethods Contd..
When the researcher cannot or does not want to
make such assumptions. In such situations we use
statistical methods for testing hypotheses which are
called non-parametric tests because such tests do
not depend on any assumption about the
parameters of the parent population.
44.
IMPORTANT NONPARAMETRIC ORDISTRIBUTION-FREE TESTS
Tests of hypotheses with ‘Order statistics’ or ‘Non-Parametric statistics’ or
‘Distribution-free statistics’ are known as nonparametric or distribution-free tests.
The following distribution-free tests are important and generally used:
i.Test of a hypothesis concerning some single value for the given data (such as one-
sample sign test).
ii.Test of a hypothesis concerning no difference among two or more sets of data (such
as two-sample sign test, Fisher-Irwin test, Rank sum test, etc.).
iii.Test of a hypothesis of a relationship between variables.
iv.Test of a hypothesis concerning variation in the given data i.e., test analogous to
ANOVA .
v.Tests of randomness of a sample based on the theory of runs viz., one sample runs
test.
vi.Test of hypothesis to determine if categorical data shows dependency or if two
classifications are independent viz., the chi-square test. The chi-square test can as well
be used to make comparison between theoretical populations and actual data when
categories are used.
45.
Points of CentralTendency
Measures of central tendency (or statistical averages) tell us the point about which
items have a tendency to cluster. Such a measure is considered as the most
representative figure for the entire mass of data. Measure of central tendency is also
known as statistical average. Mean, median and mode are the most popular averages.
Mean, also known as arithmetic average
Where = The symbol we use for mean (pronounced as X bar)
= Symbol for summation
Ʃ
n = total number of items
Median (M) is the value of the middle item of series when it is arranged in
ascending or descending order of magnitude.
Mode is the most commonly or frequently occurring value in a series. The
mode in a distribution is that item around which there is maximum
concentration.
=
46.
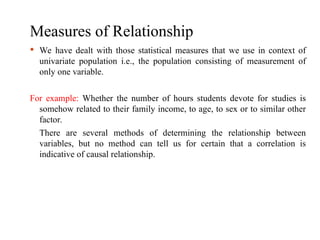
Measures of Relationship
We have dealt with those statistical measures that we use in context of
univariate population i.e., the population consisting of measurement of
only one variable.
For example: Whether the number of hours students devote for studies is
somehow related to their family income, to age, to sex or to similar other
factor.
There are several methods of determining the relationship between
variables, but no method can tell us for certain that a correlation is
indicative of causal relationship.
47.
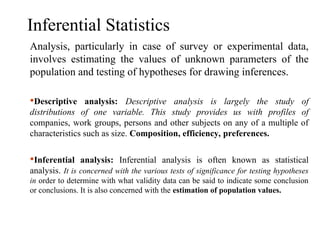
Inferential Statistics
Analysis, particularlyin case of survey or experimental data,
involves estimating the values of unknown parameters of the
population and testing of hypotheses for drawing inferences.
Descriptive analysis: Descriptive analysis is largely the study of
distributions of one variable. This study provides us with profiles of
companies, work groups, persons and other subjects on any of a multiple of
characteristics such as size. Composition, efficiency, preferences.
Inferential analysis: Inferential analysis is often known as statistical
analysis. It is concerned with the various tests of significance for testing hypotheses
in order to determine with what validity data can be said to indicate some conclusion
or conclusions. It is also concerned with the estimation of population values.
48.
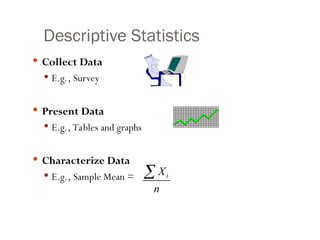
Descriptive Statistics
CollectData
E.g., Survey
Present Data
E.g., Tables and graphs
Characterize Data
E.g., Sample Mean = i
X
n
49.
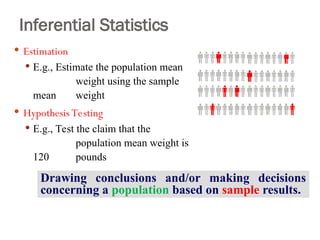
Inferential Statistics
Estimation
E.g., Estimate the population mean
weight using the sample
mean weight
Hypothesis Testing
E.g., Test the claim that the
population mean weight is
120 pounds
Drawing conclusions and/or making decisions
concerning a population based on sample results.
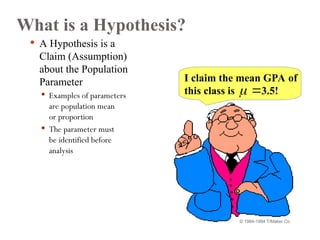
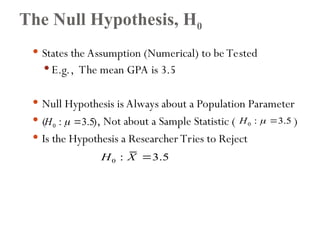
The Null Hypothesis,H0
States the Assumption (Numerical) to be Tested
E.g., The mean GPA is 3.5
Null Hypothesis is Always about a Population Parameter
( ), Not about a Sample Statistic ( )
Is the Hypothesis a Researcher Tries to Reject
0 : 3.5
H 0 : 3.5
H
0 : 3.5
H X
52.
The Null Hypothesis,H0
Begin with the Assumption that the Null Hypothesis is True
Similar to the notion of innocent until
proven guilty
Refer to the Status Quo
Always Contains the “=” Sign
The Null Hypothesis May or May Not be Rejected
(continued)
53.
The Alternative Hypothesis,H1
Is the Opposite of the Null Hypothesis
E.g., The mean GPA is NOT 3.5 ( )
Challenges the Status Quo
Never Contains the “=” Sign
The Alternative Hypothesis May or May Not Be
Accepted (i.e., The Null Hypothesis May or May
Not Be Rejected)
Is Generally the Hypothesis that the Researcher
Claims
1 : 3.5
H
54.
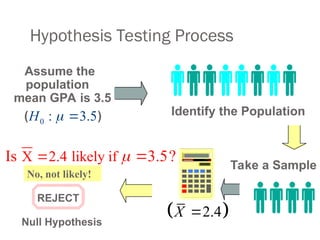
Hypothesis Testing Process
Identifythe Population
Assume the
population
mean GPA is 3.5
( )
REJECT
Take a Sample
Null Hypothesis
No, not likely!
X 2.4 likely if
Is 3.5?
0 : 3.5
H
2.4
X
55.
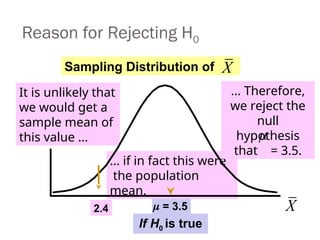
= 3.5
It isunlikely that
we would get a
sample mean of
this value ...
... if in fact this were
the population
mean.
... Therefore,
we reject the
null
hypothesis
that = 3.5.
Reason for Rejecting H0
Sampling Distribution of
2.4
If H0 is true
X
X
56.
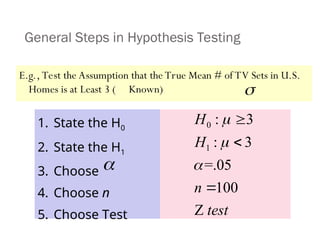
General Steps inHypothesis Testing
E.g., Test the Assumption that the True Mean # of TV Sets in U.S.
Homes is at Least 3 ( Known)
1. State the H0
2. State the H1
3. Choose
4. Choose n
5. Choose Test
0
1
: 3
: 3
=.05
100
Z
H
H
n
test
57.
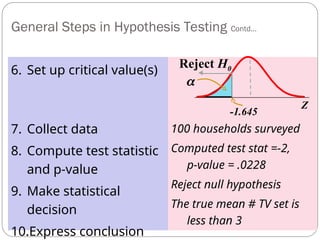
100 households surveyed
Computedtest stat =-2,
p-value = .0228
Reject null hypothesis
The true mean # TV set is
less than 3
Reject H0
-1.645
Z
6. Set up critical value(s)
7. Collect data
8. Compute test statistic
and p-value
9. Make statistical
decision
10.Express conclusion
General Steps in Hypothesis Testing Contd…
58.
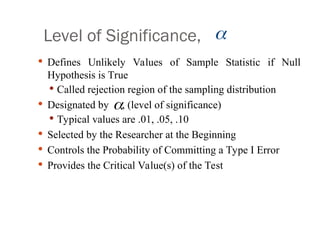
Level of Significance,
Defines Unlikely Values of Sample Statistic if Null
Hypothesis is True
Called rejection region of the sampling distribution
Designated by , (level of significance)
Typical values are .01, .05, .10
Selected by the Researcher at the Beginning
Controls the Probability of Committing a Type I Error
Provides the Critical Value(s) of the Test
59.
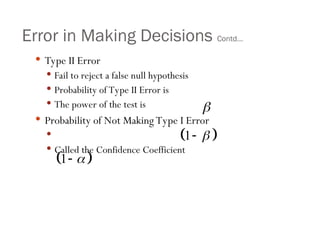
Error in MakingDecisions Contd…
Type II Error
Fail to reject a false null hypothesis
Probability of Type II Error is
The power of the test is
Probability of Not Making Type I Error
Called the Confidence Coefficient
1
1
60.
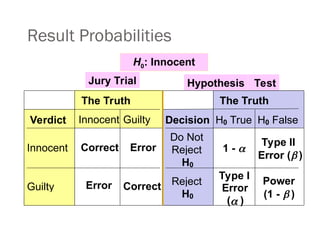
Result Probabilities
H0: Innocent
TheTruth The Truth
Verdict Innocent Guilty Decision H0 True H0 False
Innocent Correct Error
Do Not
Reject
H0
1 -
Type II
Error ( )
Guilty Error Correct Reject
H0
Type I
Error
( )
Power
(1 - )
Jury Trial Hypothesis Test
61.
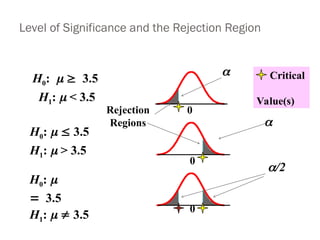
Level of Significanceand the Rejection Region
H0: 3.5
H1: < 3.5
0
0
0
H0: 3.5
H1: > 3.5
H0:
3.5
H1: 3.5
/2
Critical
Value(s)
Rejection
Regions
62.
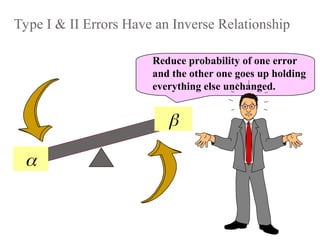
Type I &II Errors Have an Inverse Relationship
Reduce probability of one error
and the other one goes up holding
everything else unchanged.
63.
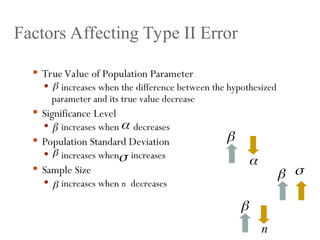
Factors Affecting TypeII Error
True Value of Population Parameter
increases when the difference between the hypothesized
parameter and its true value decrease
Significance Level
increases when decreases
Population Standard Deviation
increases when increases
Sample Size
increases when n decreases
n
64.
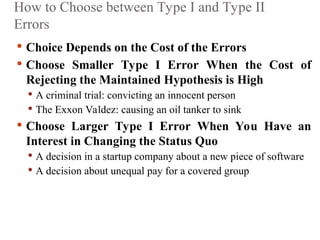
How to Choosebetween Type I and Type II
Errors
Choice Depends on the Cost of the Errors
Choose Smaller Type I Error When the Cost of
Rejecting the Maintained Hypothesis is High
A criminal trial: convicting an innocent person
The Exxon Valdez: causing an oil tanker to sink
Choose Larger Type I Error When You Have an
Interest in Changing the Status Quo
A decision in a startup company about a new piece of software
A decision about unequal pay for a covered group
65.
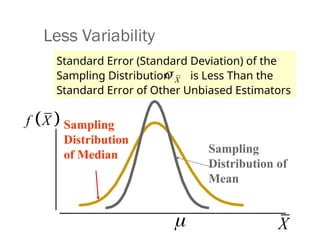
Less Variability
Sampling
Distribution
of MedianSampling
Distribution of
Mean
X
f X
Standard Error (Standard Deviation) of the
Sampling Distribution is Less Than the
Standard Error of Other Unbiased Estimators
X


![research. data collection [Autosaved].pptx](https://cdn.slidesharecdn.com/ss_thumbnails/datacollectionautosaved-250828164458-6418451b-thumbnail.jpg?width=640&height=640&fit=bounds)


