Download as PDF, PPTX

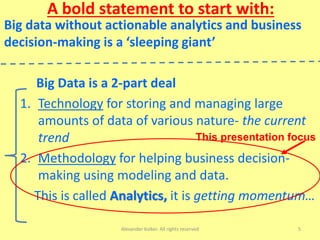
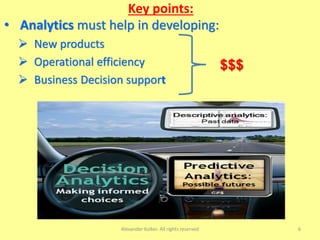
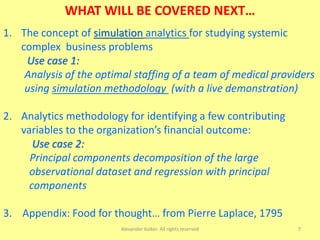
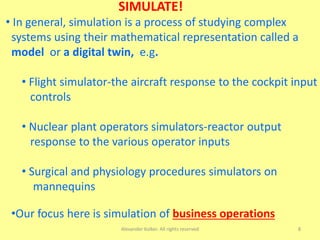
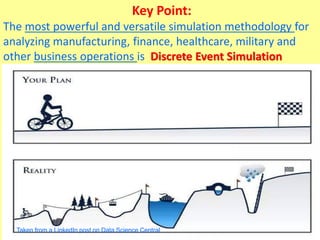
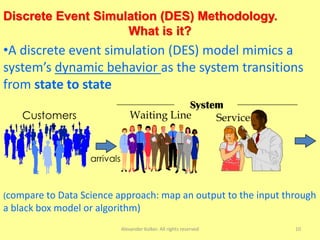
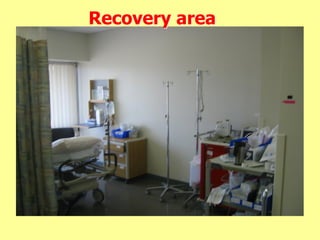
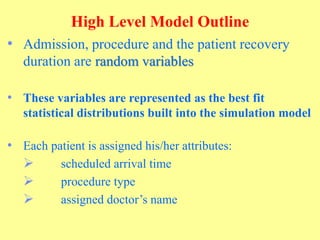
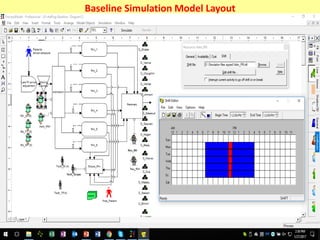
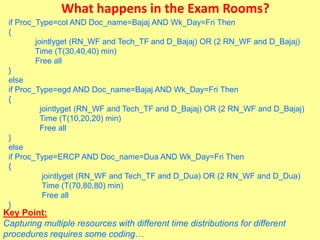
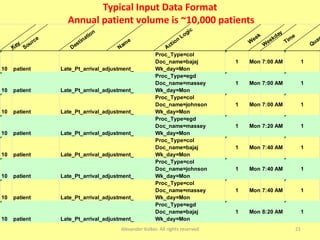
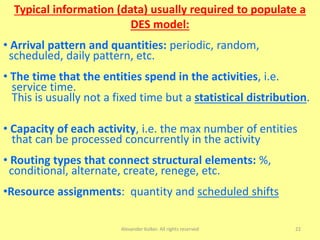
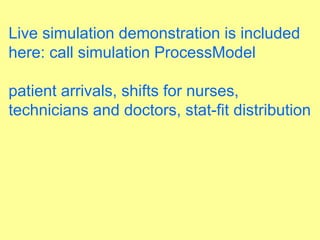
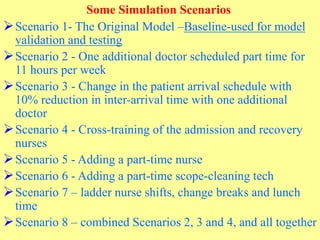
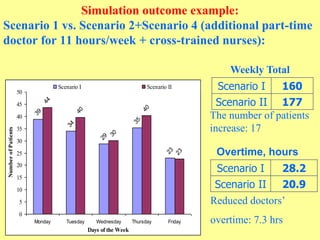
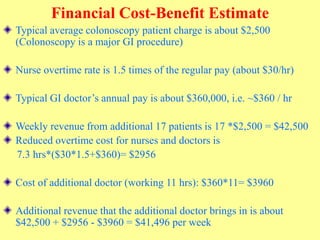
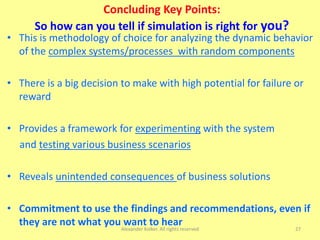
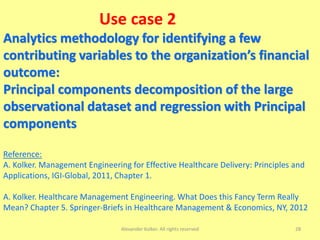
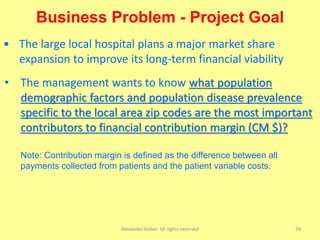
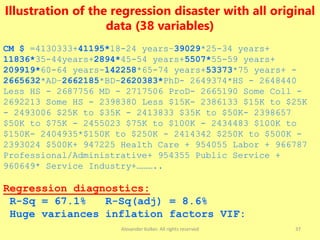

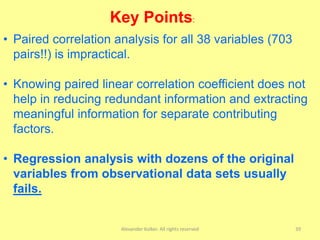


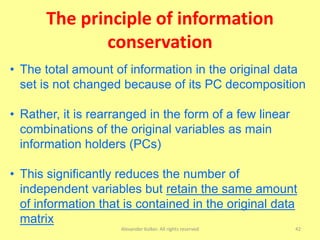
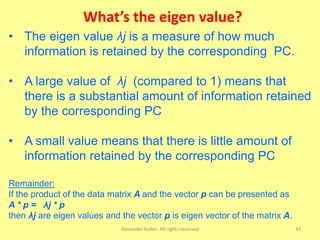
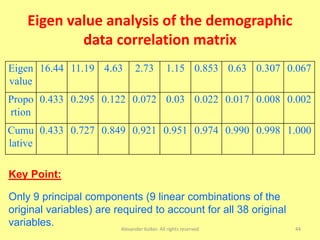
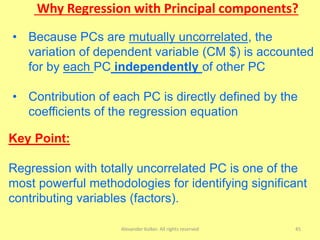
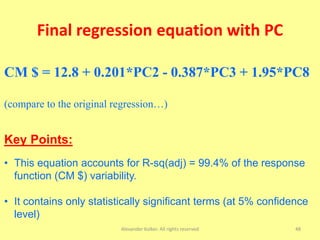
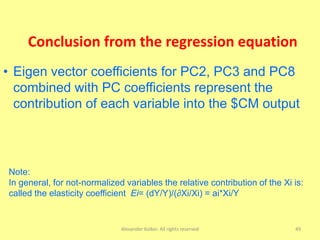
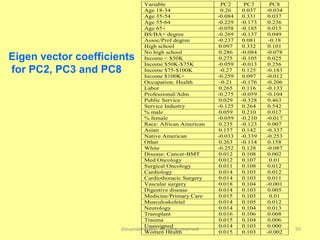
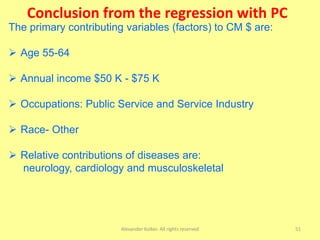
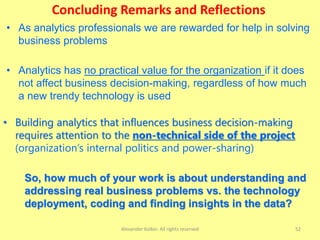


The document discusses the importance of shifting the focus of data analytics from technology to methodology in business settings for better decision-making and outcomes. It presents two use cases: one involving simulation analytics for optimizing staffing in healthcare settings using discrete event simulation, and another about analyzing demographic factors impacting financial performance using principal component analysis. The content emphasizes using rigorous methodologies to address complex business challenges and make informed decisions.


![[MPKD1] Introduction to business analytics and simulation](https://cdn.slidesharecdn.com/ss_thumbnails/introductiontobusinessanalyticsandsimulation-150908060653-lva1-app6891-thumbnail.jpg?width=640&height=640&fit=bounds)


![7.__Developing_a_Research_Proposal[1].pptx](https://cdn.slidesharecdn.com/ss_thumbnails/7-260131073037-df92dd7d-thumbnail.jpg?width=640&height=640&fit=bounds)


![제 23회 보아즈(BOAZ) 빅데이터 컨퍼런스 - [MBOAX] : ABSA를 활용한 소비자 반응 분석 기반 운영 효율화 대시보드 설계](https://cdn.slidesharecdn.com/ss_thumbnails/3-1boaz23rdconferencemboax-260203102709-9d519923-thumbnail.jpg?width=640&height=640&fit=bounds)


