SlideShare a Scribd company logo
1 of 9
Download to read offline
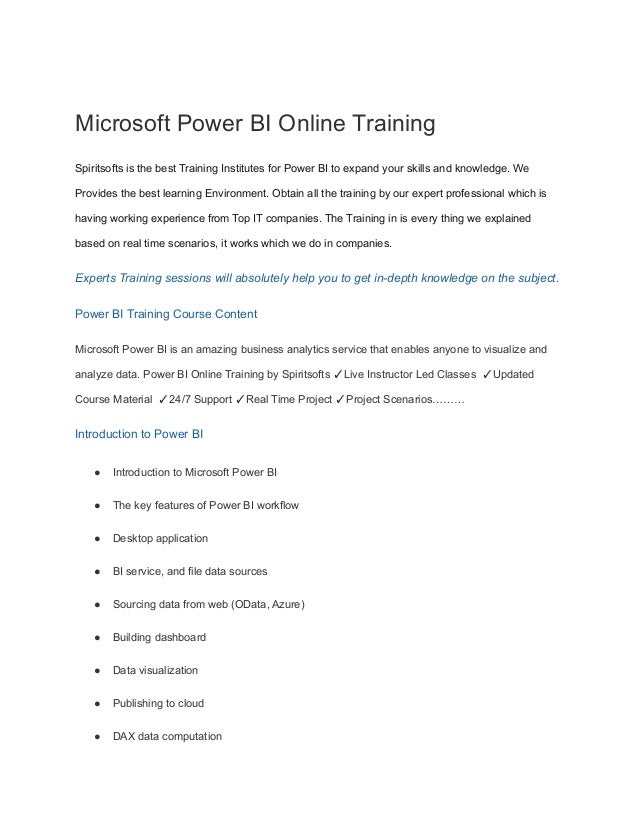
Microsoft Power BI Online Training
Spiritsofts is the best Training Institutes for Power BI to expand your skills and knowledge. We
Provides the best learning Environment. Obtain all the training by our expert professional which is
having working experience from Top IT companies. The Training in is every thing we explained
based on real time scenarios, it works which we do in companies.
Experts Training sessions will absolutely help you to get in-depth knowledge on the subject.
Power BI Training Course Content
Microsoft Power BI is an amazing business analytics service that enables anyone to visualize and
analyze data. Power BI Online Training by Spiritsofts ✓Live Instructor Led Classes ✓Updated
Course Material ✓24/7 Support ✓Real Time Project ✓Project Scenarios………
Introduction to Power BI
● Introduction to Microsoft Power BI
● The key features of Power BI workflow
● Desktop application
● BI service, and file data sources
● Sourcing data from web (OData, Azure)
● Building dashboard
● Data visualization
● Publishing to cloud
● DAX data computation
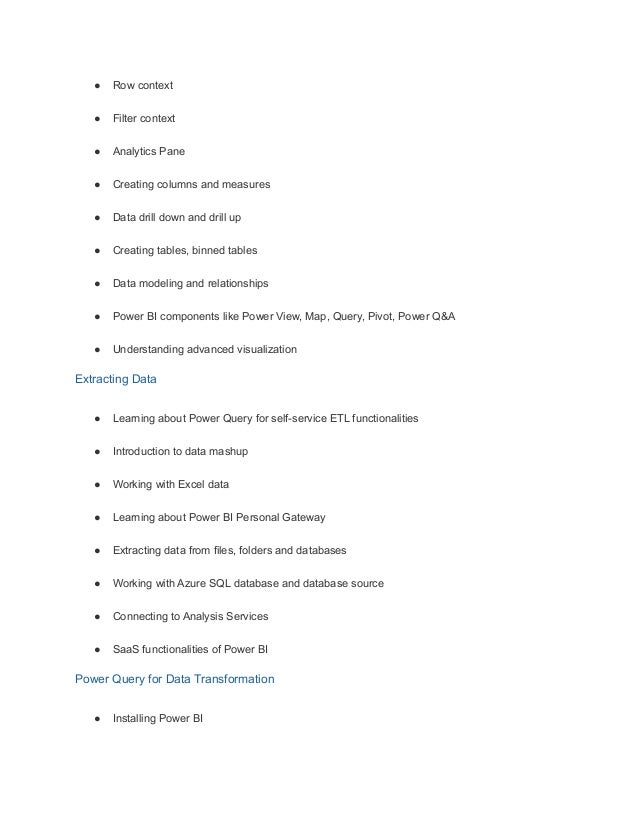
● Row context
● Filter context
● Analytics Pane
● Creating columns and measures
● Data drill down and drill up
● Creating tables, binned tables
● Data modeling and relationships
● Power BI components like Power View, Map, Query, Pivot, Power Q&A
● Understanding advanced visualization
Extracting Data
● Learning about Power Query for self-service ETL functionalities
● Introduction to data mashup
● Working with Excel data
● Learning about Power BI Personal Gateway
● Extracting data from files, folders and databases
● Working with Azure SQL database and database source
● Connecting to Analysis Services
● SaaS functionalities of Power BI
Power Query for Data Transformation
● Installing Power BI
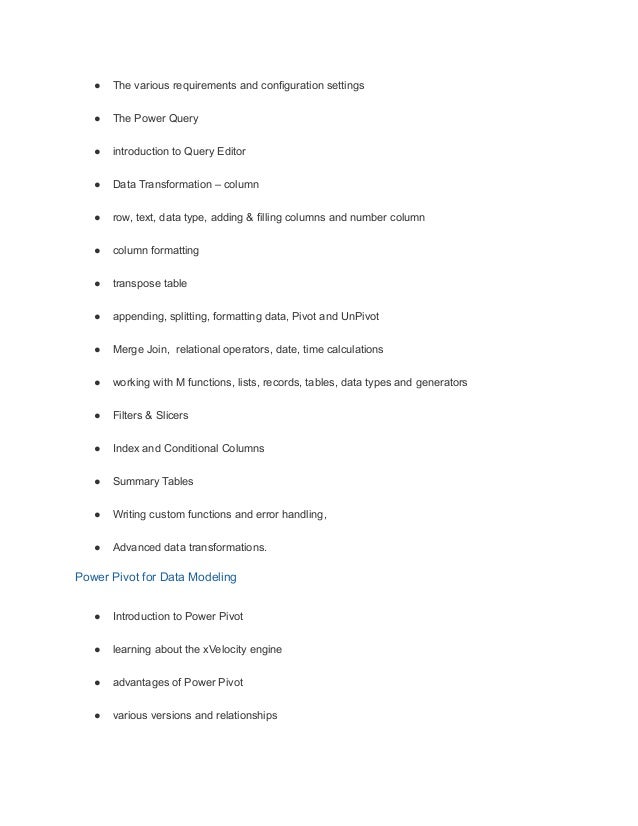
● The various requirements and configuration settings
● The Power Query
● introduction to Query Editor
● Data Transformation – column
● row, text, data type, adding & filling columns and number column
● column formatting
● transpose table
● appending, splitting, formatting data, Pivot and UnPivot
● Merge Join, relational operators, date, time calculations
● working with M functions, lists, records, tables, data types and generators
● Filters & Slicers
● Index and Conditional Columns
● Summary Tables
● Writing custom functions and error handling,
● Advanced data transformations.
Power Pivot for Data Modeling
● Introduction to Power Pivot
● learning about the xVelocity engine
● advantages of Power Pivot
● various versions and relationships
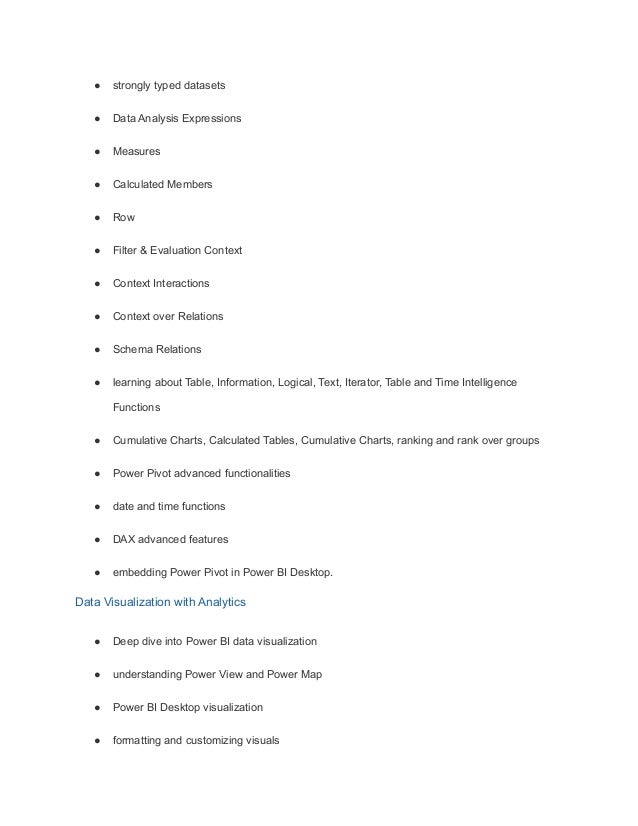
● strongly typed datasets
● Data Analysis Expressions
● Measures
● Calculated Members
● Row
● Filter & Evaluation Context
● Context Interactions
● Context over Relations
● Schema Relations
● learning about Table, Information, Logical, Text, Iterator, Table and Time Intelligence
Functions
● Cumulative Charts, Calculated Tables, Cumulative Charts, ranking and rank over groups
● Power Pivot advanced functionalities
● date and time functions
● DAX advanced features
● embedding Power Pivot in Power BI Desktop.
Data Visualization with Analytics
● Deep dive into Power BI data visualization
● understanding Power View and Power Map
● Power BI Desktop visualization
● formatting and customizing visuals
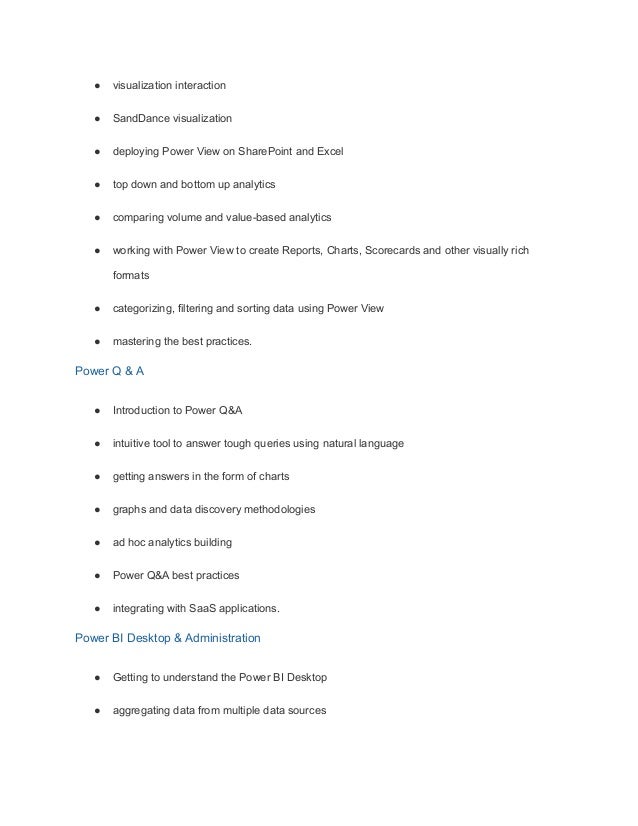
● visualization interaction
● SandDance visualization
● deploying Power View on SharePoint and Excel
● top down and bottom up analytics
● comparing volume and value-based analytics
● working with Power View to create Reports, Charts, Scorecards and other visually rich
formats
● categorizing, filtering and sorting data using Power View
● mastering the best practices.
Power Q & A
● Introduction to Power Q&A
● intuitive tool to answer tough queries using natural language
● getting answers in the form of charts
● graphs and data discovery methodologies
● ad hoc analytics building
● Power Q&A best practices
● integrating with SaaS applications.
Power BI Desktop & Administration
● Getting to understand the Power BI Desktop
● aggregating data from multiple data sources
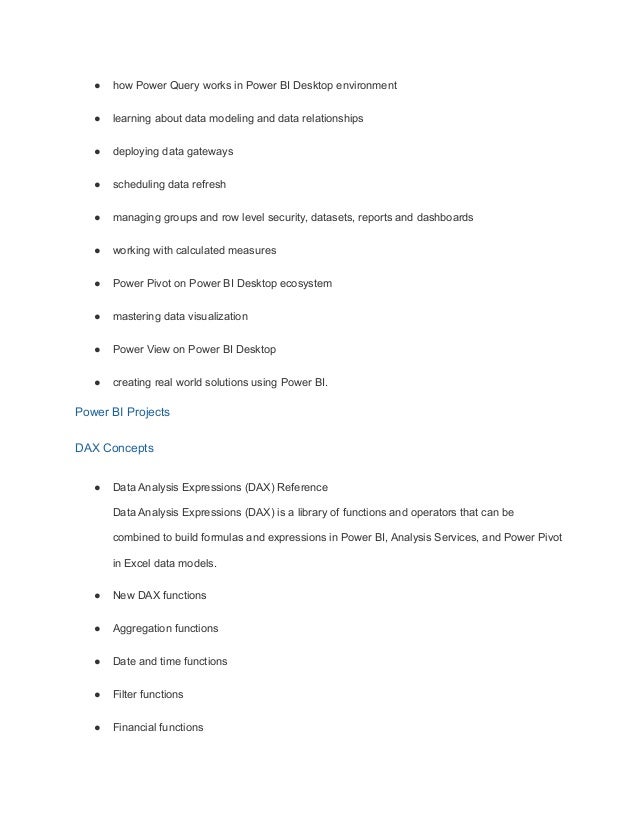
● how Power Query works in Power BI Desktop environment
● learning about data modeling and data relationships
● deploying data gateways
● scheduling data refresh
● managing groups and row level security, datasets, reports and dashboards
● working with calculated measures
● Power Pivot on Power BI Desktop ecosystem
● mastering data visualization
● Power View on Power BI Desktop
● creating real world solutions using Power BI.
Power BI Projects
DAX Concepts
● Data Analysis Expressions (DAX) Reference
Data Analysis Expressions (DAX) is a library of functions and operators that can be
combined to build formulas and expressions in Power BI, Analysis Services, and Power Pivot
in Excel data models.
● New DAX functions
● Aggregation functions
● Date and time functions
● Filter functions
● Financial functions
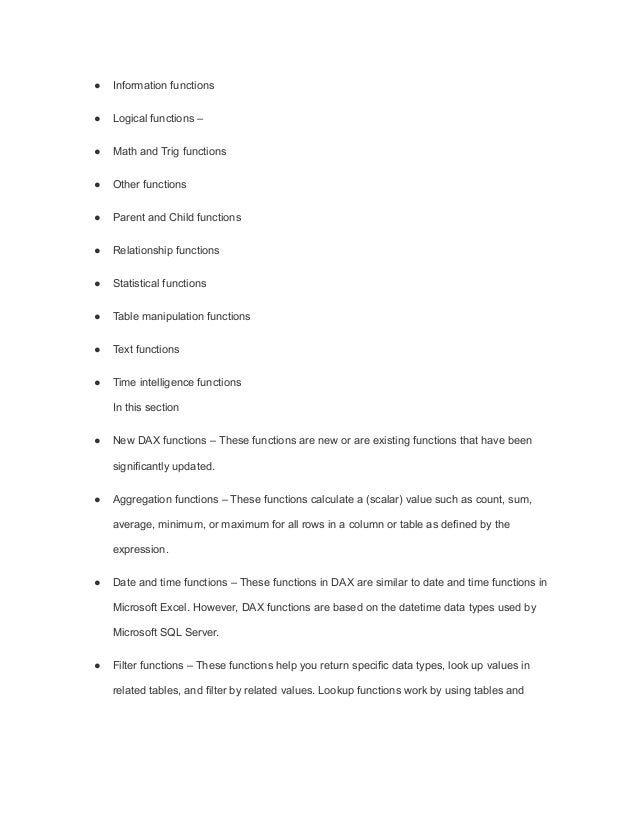
● Information functions
● Logical functions –
● Math and Trig functions
● Other functions
● Parent and Child functions
● Relationship functions
● Statistical functions
● Table manipulation functions
● Text functions
● Time intelligence functions
In this section
● New DAX functions – These functions are new or are existing functions that have been
significantly updated.
● Aggregation functions – These functions calculate a (scalar) value such as count, sum,
average, minimum, or maximum for all rows in a column or table as defined by the
expression.
● Date and time functions – These functions in DAX are similar to date and time functions in
Microsoft Excel. However, DAX functions are based on the datetime data types used by
Microsoft SQL Server.
● Filter functions – These functions help you return specific data types, look up values in
related tables, and filter by related values. Lookup functions work by using tables and
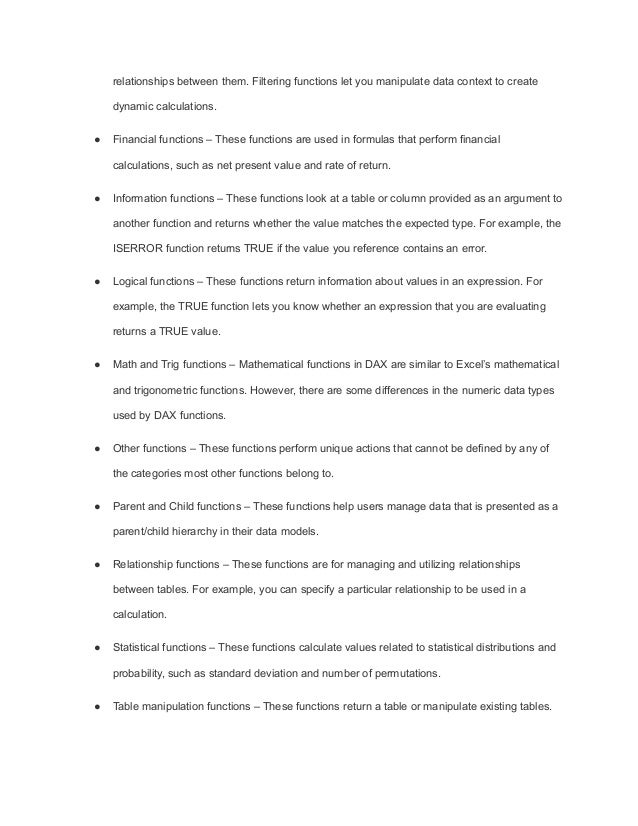
relationships between them. Filtering functions let you manipulate data context to create
dynamic calculations.
● Financial functions – These functions are used in formulas that perform financial
calculations, such as net present value and rate of return.
● Information functions – These functions look at a table or column provided as an argument to
another function and returns whether the value matches the expected type. For example, the
ISERROR function returns TRUE if the value you reference contains an error.
● Logical functions – These functions return information about values in an expression. For
example, the TRUE function lets you know whether an expression that you are evaluating
returns a TRUE value.
● Math and Trig functions – Mathematical functions in DAX are similar to Excel’s mathematical
and trigonometric functions. However, there are some differences in the numeric data types
used by DAX functions.
● Other functions – These functions perform unique actions that cannot be defined by any of
the categories most other functions belong to.
● Parent and Child functions – These functions help users manage data that is presented as a
parent/child hierarchy in their data models.
● Relationship functions – These functions are for managing and utilizing relationships
between tables. For example, you can specify a particular relationship to be used in a
calculation.
● Statistical functions – These functions calculate values related to statistical distributions and
probability, such as standard deviation and number of permutations.
● Table manipulation functions – These functions return a table or manipulate existing tables.
● Text functions – With these functions, you can return part of a string, search for text within a
string, or concatenate string values. Additional functions are for controlling the formats for
dates, times, and numbers.
● Time intelligence functions – These functions help you create calculations that use built-in
knowledge about calendars and dates. By using time and date ranges in combination with
aggregations or calculations, you can build meaningful comparisons across comparable time
periods for sales, inventory, and so on.
●

More Related Content

Similar to Microsoft Power BI Online Training.pdf

Microsoft Power BI Overview
Microsoft Power BI OverviewMicrosoft Power BI Overview
Microsoft Power BI OverviewNetwoven Inc.
 
SAP_Business_Object_Professional
SAP_Business_Object_ProfessionalSAP_Business_Object_Professional
SAP_Business_Object_ProfessionalKapil Verma
 
MS SQL Server Analysis Services 2008 and Enterprise Data Warehousing
MS SQL Server Analysis Services 2008 and Enterprise Data WarehousingMS SQL Server Analysis Services 2008 and Enterprise Data Warehousing
MS SQL Server Analysis Services 2008 and Enterprise Data WarehousingSlava Kokaev
 
Afternoons with Azure - Power BI and Azure Analysis Services
Afternoons with Azure - Power BI and Azure Analysis ServicesAfternoons with Azure - Power BI and Azure Analysis Services
Afternoons with Azure - Power BI and Azure Analysis ServicesCCG
 
Business Data Analysis Outlines.pptx
Business Data Analysis Outlines.pptxBusiness Data Analysis Outlines.pptx
Business Data Analysis Outlines.pptxMinaMouradTallaat
 
Microsoft BI reporting capabilities (on-prem solutions) Presentation
Microsoft BI reporting capabilities (on-prem solutions) PresentationMicrosoft BI reporting capabilities (on-prem solutions) Presentation
Microsoft BI reporting capabilities (on-prem solutions) Presentationjeromedoyen
 
L22 analyzing data using smart view
L22 analyzing data using smart viewL22 analyzing data using smart view
L22 analyzing data using smart viewNaresh Kumar SAHU
 
Power BI & Advanced Business Intelligence Tools Excel 2013 / 2016 By Spark Tr...
Power BI & Advanced Business Intelligence Tools Excel 2013 / 2016 By Spark Tr...Power BI & Advanced Business Intelligence Tools Excel 2013 / 2016 By Spark Tr...
Power BI & Advanced Business Intelligence Tools Excel 2013 / 2016 By Spark Tr...Ahmed Yasir Khan
 
Office 365 Saturday Europe - Self-Service Business Intelligence with Power BI
Office 365 Saturday Europe - Self-Service Business Intelligence with Power BIOffice 365 Saturday Europe - Self-Service Business Intelligence with Power BI
Office 365 Saturday Europe - Self-Service Business Intelligence with Power BIMarius Constantinescu [MVP]
 
Introducing microsoft bi tools
Introducing  microsoft bi  toolsIntroducing  microsoft bi  tools
Introducing microsoft bi toolsCMR WORLD TECH
 
AAO BI Resume
AAO BI ResumeAAO BI Resume
AAO BI ResumeAl Ottley
 
Evolved BI with SQL Server 2012
Evolved BIwith SQL Server 2012Evolved BIwith SQL Server 2012
Evolved BI with SQL Server 2012Andrew Brust
 
Resume - Charul Gupta - External
Resume - Charul Gupta - ExternalResume - Charul Gupta - External
Resume - Charul Gupta - ExternalCharul Gupta
 
Operational dashboarding and reporting with Microsoft Business Intelligence
Operational dashboarding and reporting with Microsoft Business IntelligenceOperational dashboarding and reporting with Microsoft Business Intelligence
Operational dashboarding and reporting with Microsoft Business IntelligenceJohn White
 
AnalytixLabs - Data Science 360 (Nasscom)-1648178720283 (1).pdf
AnalytixLabs - Data Science 360 (Nasscom)-1648178720283 (1).pdfAnalytixLabs - Data Science 360 (Nasscom)-1648178720283 (1).pdf
AnalytixLabs - Data Science 360 (Nasscom)-1648178720283 (1).pdfNamanGulati17
 
Sap hana attribute view
Sap hana attribute viewSap hana attribute view
Sap hana attribute viewDucat
 
Tenisha Hamilton -BI
Tenisha Hamilton -BITenisha Hamilton -BI
Tenisha Hamilton -BITenishaH
 
Jyothi_Ganta_Oracle_BI_Developer
Jyothi_Ganta_Oracle_BI_DeveloperJyothi_Ganta_Oracle_BI_Developer
Jyothi_Ganta_Oracle_BI_DeveloperJyothi srirama
 

Similar to Microsoft Power BI Online Training.pdf (20)

Microsoft Power BI Overview
Microsoft Power BI OverviewMicrosoft Power BI Overview
Microsoft Power BI Overview
 
SAP_Business_Object_Professional
SAP_Business_Object_ProfessionalSAP_Business_Object_Professional
SAP_Business_Object_Professional
 
MS SQL Server Analysis Services 2008 and Enterprise Data Warehousing
MS SQL Server Analysis Services 2008 and Enterprise Data WarehousingMS SQL Server Analysis Services 2008 and Enterprise Data Warehousing
MS SQL Server Analysis Services 2008 and Enterprise Data Warehousing
 
Afternoons with Azure - Power BI and Azure Analysis Services
Afternoons with Azure - Power BI and Azure Analysis ServicesAfternoons with Azure - Power BI and Azure Analysis Services
Afternoons with Azure - Power BI and Azure Analysis Services
 
Business Data Analysis Outlines.pptx
Business Data Analysis Outlines.pptxBusiness Data Analysis Outlines.pptx
Business Data Analysis Outlines.pptx
 
Microsoft BI reporting capabilities (on-prem solutions) Presentation
Microsoft BI reporting capabilities (on-prem solutions) PresentationMicrosoft BI reporting capabilities (on-prem solutions) Presentation
Microsoft BI reporting capabilities (on-prem solutions) Presentation
 
L22 analyzing data using smart view
L22 analyzing data using smart viewL22 analyzing data using smart view
L22 analyzing data using smart view
 
Power BI & Advanced Business Intelligence Tools Excel 2013 / 2016 By Spark Tr...
Power BI & Advanced Business Intelligence Tools Excel 2013 / 2016 By Spark Tr...Power BI & Advanced Business Intelligence Tools Excel 2013 / 2016 By Spark Tr...
Power BI & Advanced Business Intelligence Tools Excel 2013 / 2016 By Spark Tr...
 
Office 365 Saturday Europe - Self-Service Business Intelligence with Power BI
Office 365 Saturday Europe - Self-Service Business Intelligence with Power BIOffice 365 Saturday Europe - Self-Service Business Intelligence with Power BI
Office 365 Saturday Europe - Self-Service Business Intelligence with Power BI
 
Introducing microsoft bi tools
Introducing  microsoft bi  toolsIntroducing  microsoft bi  tools
Introducing microsoft bi tools
 
AAO BI Resume
AAO BI ResumeAAO BI Resume
AAO BI Resume
 
Priyanka_Ronanki_Resume
Priyanka_Ronanki_ResumePriyanka_Ronanki_Resume
Priyanka_Ronanki_Resume
 
Evolved BI with SQL Server 2012
Evolved BIwith SQL Server 2012Evolved BIwith SQL Server 2012
Evolved BI with SQL Server 2012
 
Resume - Charul Gupta - External
Resume - Charul Gupta - ExternalResume - Charul Gupta - External
Resume - Charul Gupta - External
 
Operational dashboarding and reporting with Microsoft Business Intelligence
Operational dashboarding and reporting with Microsoft Business IntelligenceOperational dashboarding and reporting with Microsoft Business Intelligence
Operational dashboarding and reporting with Microsoft Business Intelligence
 
AnalytixLabs - Data Science 360 (Nasscom)-1648178720283 (1).pdf
AnalytixLabs - Data Science 360 (Nasscom)-1648178720283 (1).pdfAnalytixLabs - Data Science 360 (Nasscom)-1648178720283 (1).pdf
AnalytixLabs - Data Science 360 (Nasscom)-1648178720283 (1).pdf
 
Sap hana attribute view
Sap hana attribute viewSap hana attribute view
Sap hana attribute view
 
Excel Services in SharePoint 2013
Excel Services in SharePoint 2013Excel Services in SharePoint 2013
Excel Services in SharePoint 2013
 
Tenisha Hamilton -BI
Tenisha Hamilton -BITenisha Hamilton -BI
Tenisha Hamilton -BI
 
Jyothi_Ganta_Oracle_BI_Developer
Jyothi_Ganta_Oracle_BI_DeveloperJyothi_Ganta_Oracle_BI_Developer
Jyothi_Ganta_Oracle_BI_Developer
 

More from SpiritsoftsTraining (20)

Devops Online Training.pdf
Devops Online Training.pdfDevops Online Training.pdf
Devops Online Training.pdf
 
Devops Online Training.pdf
Devops Online Training.pdfDevops Online Training.pdf
Devops Online Training.pdf
 
Kotlin Online Training.pdf
Kotlin Online Training.pdfKotlin Online Training.pdf
Kotlin Online Training.pdf
 
Selenium Online Training.pdf
Selenium Online Training.pdfSelenium Online Training.pdf
Selenium Online Training.pdf
 
Devops Online Training.pdf
Devops Online Training.pdfDevops Online Training.pdf
Devops Online Training.pdf
 
Kotlin Online Training.pdf
Kotlin Online Training.pdfKotlin Online Training.pdf
Kotlin Online Training.pdf
 
Kotlin Online Training.pdf
Kotlin Online Training.pdfKotlin Online Training.pdf
Kotlin Online Training.pdf
 
Kotlin Online Training.pdf
Kotlin Online Training.pdfKotlin Online Training.pdf
Kotlin Online Training.pdf
 
Kotlin Online Training.pdf
Kotlin Online Training.pdfKotlin Online Training.pdf
Kotlin Online Training.pdf
 
Kotlin Online Training.pdf
Kotlin Online Training.pdfKotlin Online Training.pdf
Kotlin Online Training.pdf
 
Kotlin Online Training.pdf
Kotlin Online Training.pdfKotlin Online Training.pdf
Kotlin Online Training.pdf
 
Kotlin Online Training.pdf
Kotlin Online Training.pdfKotlin Online Training.pdf
Kotlin Online Training.pdf
 
Devops Online Training.pdf
Devops Online Training.pdfDevops Online Training.pdf
Devops Online Training.pdf
 
Kotlin Online Training.pdf
Kotlin Online Training.pdfKotlin Online Training.pdf
Kotlin Online Training.pdf
 
C++ Training.pdf
C++ Training.pdfC++ Training.pdf
C++ Training.pdf
 
Selenium Online Training.pdf
Selenium Online Training.pdfSelenium Online Training.pdf
Selenium Online Training.pdf
 
AWS Training.pdf
AWS Training.pdfAWS Training.pdf
AWS Training.pdf
 
ASP.pdf
ASP.pdfASP.pdf
ASP.pdf
 
Python Training.pdf
Python Training.pdfPython Training.pdf
Python Training.pdf
 
Swift Online Training.pdf
Swift Online Training.pdfSwift Online Training.pdf
Swift Online Training.pdf
 

Recently uploaded

Activity 01 - Artificial Culture (1).pdf
Activity 01 - Artificial Culture (1).pdfActivity 01 - Artificial Culture (1).pdf
Activity 01 - Artificial Culture (1).pdfciinovamais
 
Kisan Call Centre - To harness potential of ICT in Agriculture by answer farm...
Kisan Call Centre - To harness potential of ICT in Agriculture by answer farm...Kisan Call Centre - To harness potential of ICT in Agriculture by answer farm...
Kisan Call Centre - To harness potential of ICT in Agriculture by answer farm...Krashi Coaching
 
9548086042 for call girls in Indira Nagar with room service
9548086042  for call girls in Indira Nagar  with room service9548086042  for call girls in Indira Nagar  with room service
9548086042 for call girls in Indira Nagar with room servicediscovermytutordmt
 
Paris 2024 Olympic Geographies - an activity
Paris 2024 Olympic Geographies - an activityParis 2024 Olympic Geographies - an activity
Paris 2024 Olympic Geographies - an activityGeoBlogs
 
A Critique of the Proposed National Education Policy Reform
A Critique of the Proposed National Education Policy ReformA Critique of the Proposed National Education Policy Reform
A Critique of the Proposed National Education Policy ReformChameera Dedduwage
 
Beyond the EU: DORA and NIS 2 Directive's Global Impact
Beyond the EU: DORA and NIS 2 Directive's Global ImpactBeyond the EU: DORA and NIS 2 Directive's Global Impact
Beyond the EU: DORA and NIS 2 Directive's Global ImpactPECB
 
Web & Social Media Analytics Previous Year Question Paper.pdf
Web & Social Media Analytics Previous Year Question Paper.pdfWeb & Social Media Analytics Previous Year Question Paper.pdf
Web & Social Media Analytics Previous Year Question Paper.pdfJayanti Pande
 
Mastering the Unannounced Regulatory Inspection
Mastering the Unannounced Regulatory InspectionMastering the Unannounced Regulatory Inspection
Mastering the Unannounced Regulatory InspectionSafetyChain Software
 
APM Welcome, APM North West Network Conference, Synergies Across Sectors
APM Welcome, APM North West Network Conference, Synergies Across SectorsAPM Welcome, APM North West Network Conference, Synergies Across Sectors
APM Welcome, APM North West Network Conference, Synergies Across SectorsAssociation for Project Management
 
Advanced Views - Calendar View in Odoo 17
Advanced Views - Calendar View in Odoo 17Advanced Views - Calendar View in Odoo 17
Advanced Views - Calendar View in Odoo 17Celine George
 
Sanyam Choudhary Chemistry practical.pdf
Sanyam Choudhary Chemistry practical.pdfSanyam Choudhary Chemistry practical.pdf
Sanyam Choudhary Chemistry practical.pdfsanyamsingh5019
 
Measures of Central Tendency: Mean, Median and Mode
Measures of Central Tendency: Mean, Median and ModeMeasures of Central Tendency: Mean, Median and Mode
Measures of Central Tendency: Mean, Median and ModeThiyagu K
 
1029 - Danh muc Sach Giao Khoa 10 . pdf
1029 -  Danh muc Sach Giao Khoa 10 . pdf1029 -  Danh muc Sach Giao Khoa 10 . pdf
1029 - Danh muc Sach Giao Khoa 10 . pdfQucHHunhnh
 
The Most Excellent Way | 1 Corinthians 13
The Most Excellent Way | 1 Corinthians 13The Most Excellent Way | 1 Corinthians 13
The Most Excellent Way | 1 Corinthians 13Steve Thomason
 
BAG TECHNIQUE Bag technique-a tool making use of public health bag through wh...
BAG TECHNIQUE Bag technique-a tool making use of public health bag through wh...BAG TECHNIQUE Bag technique-a tool making use of public health bag through wh...
BAG TECHNIQUE Bag technique-a tool making use of public health bag through wh...Sapna Thakur
 
Software Engineering Methodologies (overview)
Software Engineering Methodologies (overview)Software Engineering Methodologies (overview)
Software Engineering Methodologies (overview)eniolaolutunde
 
social pharmacy d-pharm 1st year by Pragati K. Mahajan
social pharmacy d-pharm 1st year by Pragati K. Mahajansocial pharmacy d-pharm 1st year by Pragati K. Mahajan
social pharmacy d-pharm 1st year by Pragati K. Mahajanpragatimahajan3
 

Recently uploaded (20)

Mattingly "AI & Prompt Design: Structured Data, Assistants, & RAG"
Mattingly "AI & Prompt Design: Structured Data, Assistants, & RAG"Mattingly "AI & Prompt Design: Structured Data, Assistants, & RAG"
Mattingly "AI & Prompt Design: Structured Data, Assistants, & RAG"
 
Código Creativo y Arte de Software | Unidad 1
Código Creativo y Arte de Software | Unidad 1Código Creativo y Arte de Software | Unidad 1
Código Creativo y Arte de Software | Unidad 1
 
Activity 01 - Artificial Culture (1).pdf
Activity 01 - Artificial Culture (1).pdfActivity 01 - Artificial Culture (1).pdf
Activity 01 - Artificial Culture (1).pdf
 
Kisan Call Centre - To harness potential of ICT in Agriculture by answer farm...
Kisan Call Centre - To harness potential of ICT in Agriculture by answer farm...Kisan Call Centre - To harness potential of ICT in Agriculture by answer farm...
Kisan Call Centre - To harness potential of ICT in Agriculture by answer farm...
 
9548086042 for call girls in Indira Nagar with room service
9548086042  for call girls in Indira Nagar  with room service9548086042  for call girls in Indira Nagar  with room service
9548086042 for call girls in Indira Nagar with room service
 
Paris 2024 Olympic Geographies - an activity
Paris 2024 Olympic Geographies - an activityParis 2024 Olympic Geographies - an activity
Paris 2024 Olympic Geographies - an activity
 
A Critique of the Proposed National Education Policy Reform
A Critique of the Proposed National Education Policy ReformA Critique of the Proposed National Education Policy Reform
A Critique of the Proposed National Education Policy Reform
 
Beyond the EU: DORA and NIS 2 Directive's Global Impact
Beyond the EU: DORA and NIS 2 Directive's Global ImpactBeyond the EU: DORA and NIS 2 Directive's Global Impact
Beyond the EU: DORA and NIS 2 Directive's Global Impact
 
Web & Social Media Analytics Previous Year Question Paper.pdf
Web & Social Media Analytics Previous Year Question Paper.pdfWeb & Social Media Analytics Previous Year Question Paper.pdf
Web & Social Media Analytics Previous Year Question Paper.pdf
 
Mastering the Unannounced Regulatory Inspection
Mastering the Unannounced Regulatory InspectionMastering the Unannounced Regulatory Inspection
Mastering the Unannounced Regulatory Inspection
 
APM Welcome, APM North West Network Conference, Synergies Across Sectors
APM Welcome, APM North West Network Conference, Synergies Across SectorsAPM Welcome, APM North West Network Conference, Synergies Across Sectors
APM Welcome, APM North West Network Conference, Synergies Across Sectors
 
Advanced Views - Calendar View in Odoo 17
Advanced Views - Calendar View in Odoo 17Advanced Views - Calendar View in Odoo 17
Advanced Views - Calendar View in Odoo 17
 
Sanyam Choudhary Chemistry practical.pdf
Sanyam Choudhary Chemistry practical.pdfSanyam Choudhary Chemistry practical.pdf
Sanyam Choudhary Chemistry practical.pdf
 
Advance Mobile Application Development class 07
Advance Mobile Application Development class 07Advance Mobile Application Development class 07
Advance Mobile Application Development class 07
 
Measures of Central Tendency: Mean, Median and Mode
Measures of Central Tendency: Mean, Median and ModeMeasures of Central Tendency: Mean, Median and Mode
Measures of Central Tendency: Mean, Median and Mode
 
1029 - Danh muc Sach Giao Khoa 10 . pdf
1029 -  Danh muc Sach Giao Khoa 10 . pdf1029 -  Danh muc Sach Giao Khoa 10 . pdf
1029 - Danh muc Sach Giao Khoa 10 . pdf
 
The Most Excellent Way | 1 Corinthians 13
The Most Excellent Way | 1 Corinthians 13The Most Excellent Way | 1 Corinthians 13
The Most Excellent Way | 1 Corinthians 13
 
BAG TECHNIQUE Bag technique-a tool making use of public health bag through wh...
BAG TECHNIQUE Bag technique-a tool making use of public health bag through wh...BAG TECHNIQUE Bag technique-a tool making use of public health bag through wh...
BAG TECHNIQUE Bag technique-a tool making use of public health bag through wh...
 
Software Engineering Methodologies (overview)
Software Engineering Methodologies (overview)Software Engineering Methodologies (overview)
Software Engineering Methodologies (overview)
 
social pharmacy d-pharm 1st year by Pragati K. Mahajan
social pharmacy d-pharm 1st year by Pragati K. Mahajansocial pharmacy d-pharm 1st year by Pragati K. Mahajan
social pharmacy d-pharm 1st year by Pragati K. Mahajan
 

Microsoft Power BI Online Training.pdf

  • 1. Microsoft Power BI Online Training Spiritsofts is the best Training Institutes for Power BI to expand your skills and knowledge. We Provides the best learning Environment. Obtain all the training by our expert professional which is having working experience from Top IT companies. The Training in is every thing we explained based on real time scenarios, it works which we do in companies. Experts Training sessions will absolutely help you to get in-depth knowledge on the subject. Power BI Training Course Content Microsoft Power BI is an amazing business analytics service that enables anyone to visualize and analyze data. Power BI Online Training by Spiritsofts ✓Live Instructor Led Classes ✓Updated Course Material ✓24/7 Support ✓Real Time Project ✓Project Scenarios……… Introduction to Power BI ● Introduction to Microsoft Power BI ● The key features of Power BI workflow ● Desktop application ● BI service, and file data sources ● Sourcing data from web (OData, Azure) ● Building dashboard ● Data visualization ● Publishing to cloud ● DAX data computation
  • 2. ● Row context ● Filter context ● Analytics Pane ● Creating columns and measures ● Data drill down and drill up ● Creating tables, binned tables ● Data modeling and relationships ● Power BI components like Power View, Map, Query, Pivot, Power Q&A ● Understanding advanced visualization Extracting Data ● Learning about Power Query for self-service ETL functionalities ● Introduction to data mashup ● Working with Excel data ● Learning about Power BI Personal Gateway ● Extracting data from files, folders and databases ● Working with Azure SQL database and database source ● Connecting to Analysis Services ● SaaS functionalities of Power BI Power Query for Data Transformation ● Installing Power BI
  • 3. ● The various requirements and configuration settings ● The Power Query ● introduction to Query Editor ● Data Transformation – column ● row, text, data type, adding & filling columns and number column ● column formatting ● transpose table ● appending, splitting, formatting data, Pivot and UnPivot ● Merge Join, relational operators, date, time calculations ● working with M functions, lists, records, tables, data types and generators ● Filters & Slicers ● Index and Conditional Columns ● Summary Tables ● Writing custom functions and error handling, ● Advanced data transformations. Power Pivot for Data Modeling ● Introduction to Power Pivot ● learning about the xVelocity engine ● advantages of Power Pivot ● various versions and relationships
  • 4. ● strongly typed datasets ● Data Analysis Expressions ● Measures ● Calculated Members ● Row ● Filter & Evaluation Context ● Context Interactions ● Context over Relations ● Schema Relations ● learning about Table, Information, Logical, Text, Iterator, Table and Time Intelligence Functions ● Cumulative Charts, Calculated Tables, Cumulative Charts, ranking and rank over groups ● Power Pivot advanced functionalities ● date and time functions ● DAX advanced features ● embedding Power Pivot in Power BI Desktop. Data Visualization with Analytics ● Deep dive into Power BI data visualization ● understanding Power View and Power Map ● Power BI Desktop visualization ● formatting and customizing visuals
  • 5. ● visualization interaction ● SandDance visualization ● deploying Power View on SharePoint and Excel ● top down and bottom up analytics ● comparing volume and value-based analytics ● working with Power View to create Reports, Charts, Scorecards and other visually rich formats ● categorizing, filtering and sorting data using Power View ● mastering the best practices. Power Q & A ● Introduction to Power Q&A ● intuitive tool to answer tough queries using natural language ● getting answers in the form of charts ● graphs and data discovery methodologies ● ad hoc analytics building ● Power Q&A best practices ● integrating with SaaS applications. Power BI Desktop & Administration ● Getting to understand the Power BI Desktop ● aggregating data from multiple data sources
  • 6. ● how Power Query works in Power BI Desktop environment ● learning about data modeling and data relationships ● deploying data gateways ● scheduling data refresh ● managing groups and row level security, datasets, reports and dashboards ● working with calculated measures ● Power Pivot on Power BI Desktop ecosystem ● mastering data visualization ● Power View on Power BI Desktop ● creating real world solutions using Power BI. Power BI Projects DAX Concepts ● Data Analysis Expressions (DAX) Reference Data Analysis Expressions (DAX) is a library of functions and operators that can be combined to build formulas and expressions in Power BI, Analysis Services, and Power Pivot in Excel data models. ● New DAX functions ● Aggregation functions ● Date and time functions ● Filter functions ● Financial functions
  • 7. ● Information functions ● Logical functions – ● Math and Trig functions ● Other functions ● Parent and Child functions ● Relationship functions ● Statistical functions ● Table manipulation functions ● Text functions ● Time intelligence functions In this section ● New DAX functions – These functions are new or are existing functions that have been significantly updated. ● Aggregation functions – These functions calculate a (scalar) value such as count, sum, average, minimum, or maximum for all rows in a column or table as defined by the expression. ● Date and time functions – These functions in DAX are similar to date and time functions in Microsoft Excel. However, DAX functions are based on the datetime data types used by Microsoft SQL Server. ● Filter functions – These functions help you return specific data types, look up values in related tables, and filter by related values. Lookup functions work by using tables and
  • 8. relationships between them. Filtering functions let you manipulate data context to create dynamic calculations. ● Financial functions – These functions are used in formulas that perform financial calculations, such as net present value and rate of return. ● Information functions – These functions look at a table or column provided as an argument to another function and returns whether the value matches the expected type. For example, the ISERROR function returns TRUE if the value you reference contains an error. ● Logical functions – These functions return information about values in an expression. For example, the TRUE function lets you know whether an expression that you are evaluating returns a TRUE value. ● Math and Trig functions – Mathematical functions in DAX are similar to Excel’s mathematical and trigonometric functions. However, there are some differences in the numeric data types used by DAX functions. ● Other functions – These functions perform unique actions that cannot be defined by any of the categories most other functions belong to. ● Parent and Child functions – These functions help users manage data that is presented as a parent/child hierarchy in their data models. ● Relationship functions – These functions are for managing and utilizing relationships between tables. For example, you can specify a particular relationship to be used in a calculation. ● Statistical functions – These functions calculate values related to statistical distributions and probability, such as standard deviation and number of permutations. ● Table manipulation functions – These functions return a table or manipulate existing tables.
  • 9. ● Text functions – With these functions, you can return part of a string, search for text within a string, or concatenate string values. Additional functions are for controlling the formats for dates, times, and numbers. ● Time intelligence functions – These functions help you create calculations that use built-in knowledge about calendars and dates. By using time and date ranges in combination with aggregations or calculations, you can build meaningful comparisons across comparable time periods for sales, inventory, and so on. ●