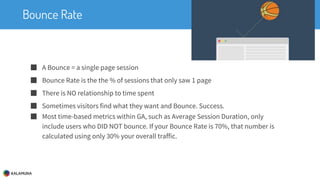
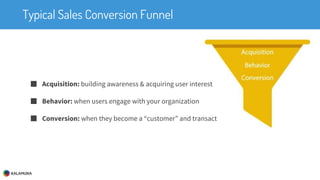
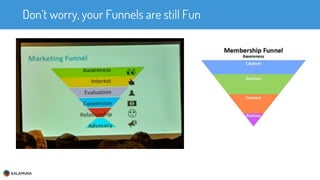
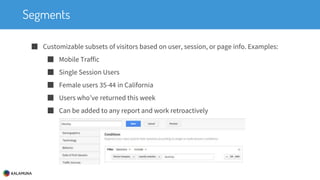
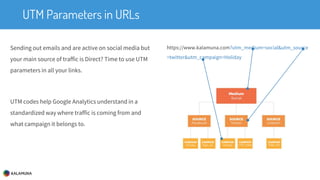
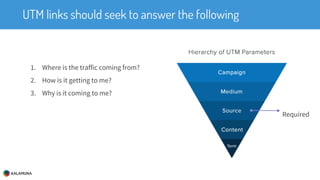
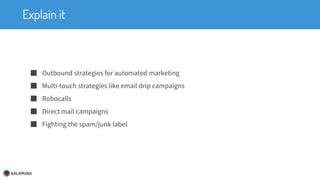
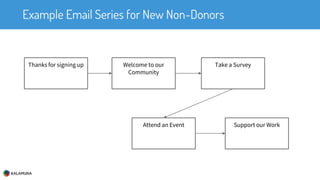
Download to read offline


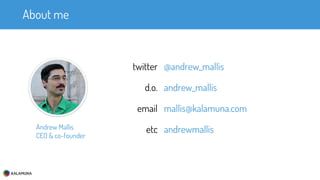


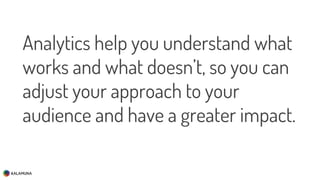
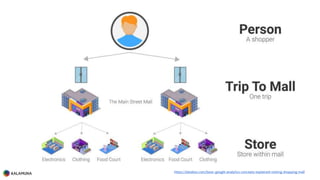


Andrew Mallis, CEO and co-founder of Kalamuna, discusses the importance of transforming data through analytics to empower organizations in making impactful decisions. He emphasizes the role of digital analytics in understanding user behavior and optimizing strategies for better outcomes. The document covers various analytics concepts, metrics, and tools, providing insights on how to leverage data effectively.


![제 23회 보아즈(BOAZ) 빅데이터 컨퍼런스 - [MBOAX] : ABSA를 활용한 소비자 반응 분석 기반 운영 효율화 대시보드 설계](https://cdn.slidesharecdn.com/ss_thumbnails/3-1boaz23rdconferencemboax-260203102709-9d519923-thumbnail.jpg?width=640&height=640&fit=bounds)


