Geographical Information Systems (GIS) are indispensable tool for administrating big datasets based on location of measured point. The values related to space may vary with both time and location. GIS-supported Geostatistical Analyst (GA) can evaluate datasets by analysing the locations of points. Maps produced using probability and prediction methods must be the base products for city planning. This study develops methods to obtain maps to determine traffic hot zones in Konya, Turkey, by applying GA supported by GIS. By applying GA, this study differs from previous studies which have determined the hot spots using linear analysis. In this study, unlike preceding studies, the aim is to determine new safe routes and zones with the help of GA.
Another, different aim is to map and determine graduated hot or safe zones using number of mortalities criterion (AC1), number of injured people criterion (AC2), number of accidents with damage only criterion (AC3), and total number of accidents criterion (AC4).
GIS-3D Analysis of Susceptibility Landslide Disaster in Upstream Area of Jene...AM Publications
The assessment of landslide hazard and risk has become a topic of major interest for both geoscientists and engineering professionals as well as for local communities and administrations in many parts of the world. Recently, Geographic Information Systems (GIS), with their excellent spatial data processing capacity, have attracted great attention in natural disaster assessment. In this paper, an assessment of landslide hazard at Upper Area of Jeneberang Watershed has been studied using GIS technology. By simulating the potential landslide according the minimum safety factor value using GIS, it can be expected that great contribution as a basic decision making for many prevention works before future landslide occurs at upstream area of Jeneberang River Watershead, South Sulawesi, Indonesia
This document describes a new robust fixed rank kriging (R-FRK) method for improving the spatial completeness and accuracy of satellite sea surface temperature (SST) products. The R-FRK method addresses two key issues: 1) it allows for dimension reduction kriging to be applied to satellite SST data over irregular regions, and 2) it incorporates a data-driven bias correction model to address systematic biases in the satellite SST measurements. The method is applied to Moderate Resolution Imaging Spectroradiometer (MODIS) SST data from 2003 and 2010. Validation using drifting buoy observations shows the method produces spatially complete SST fields with high accuracy.
Comparison among Height Observation of GPS, Total Station and Level and their...IRJET Journal
This document compares the accuracy of GPS, total station, and level instruments for measuring elevation in mining works by using GIS technology. Statistical analysis showed the level measurements had the lowest variation while GPS had the highest. Topographic maps were created from observations from each instrument, showing they produced similar overall elevation patterns. The document concludes that while GPS and total station measurements have some error, their accuracy is sufficient for mining works. GIS allows easy analysis and use of elevation data from any of the three instruments.
This document analyzes the homogeneity of rainfall records for 13 stations in Iraq using three statistical tests: Pettitt test, Buishand test, and double mass curve test. The Pettitt and Buishand tests indicated no break points for most stations, while the double mass curve identified break points at the Karbala station in March 1998 and the Samawa station in December 1991. The rainfall records for these two stations were adjusted using the double mass curve method and retested with Pettitt and Buishand, which then showed no break points. In summary, statistical testing found the rainfall records to be homogeneous for most Iraqi stations, with adjustments made for break points identified at two stations.
As basic data, the reliability of precipitation data makes a significant impact on many results of environmental applications. In order to obtain spatially distributed precipitation data, measured points are interpolated. There are many spatial interpolation schemes, but none of them can perform best in all cases. So criteria of precision evaluation are established. This study aims to find an optimal interpolation scheme for rainfall in Ningxia. The study area is located in northwest China. Meteorological stations distribute at a low density here. Six interpolation methods have been tested after exploring data. Cross-validation was used as the criterion to evaluate the accuracy of various methods. The best results were obtained by cokriging with elevation as the second variable, while the inverse distance weighting (IDW) preform worst. Three types of model in cokriging were compared, and Gaussian model is the best.
Triangulation, trilateration, traverse, leveling, and radiation are the five most common land survey techniques. Traverse surveying involves measuring distances and lengths to connect points and determine locations, making it suitable for preliminary surveys and navigating around obstacles. Given the existing buildings on the site, traverse surveying would allow connecting points to survey the site while working around structures.
The document discusses an automated method for classifying earth surfaces to assess landslide susceptibility using topographic data. It examines different geomorphometric classification approaches and parameters to distinguish landscape types related to landslides. The study tests supervised and unsupervised classification methods, compares results, and develops an integrated method using slope gradient, convexity and texture that identifies terrain features correlated with past landslide events. The automated integrated classification approach provides a useful tool for landslide susceptibility analysis at a territorial scale.
USING THE ANALYTIC HIERARCHY PROCESS AND GIS FOR DECISION MAKING IN RURAL HIG...IAEME Publication
Rural highway route location is a very complex case, requiring significant time and effort from the planners. This study presented the route location method by applying Analytic Hierarchy Process (AHP) and Geographical Information System (GIS). The location of the study is confined to south Mosul city in Iraq of the area (198km2). The researcher is behind defining the route which connects Baghdad-Mosul and Mosul-Kirkuk roadways. This route is considered the suggested turn to Mosul city. A variety of data set from different sources and at different scales are managed.
Multi-Criteria Decision Making in Hotel Site Selection inventionjournals
In the Multi Criteria Decision-Making (MCDM) context, the selection is facilitated by evaluating each choice on the set of criteria. The criteria must be measurable and their outcomes must be measured for every decision alternative. In This Paper the decision making process frame work was developed to provide Hotel site suitability map. Road, river , built up areas n and the Available area were prepared as layers in ArcGIS 10.2 to create suitability model for development area. The results of this analysis indicated that 41% of the study area is considered as the most suitable place for hotel site selection, 33% of the area as moderately suitable and 21% percent as marginally suitable. A portion of 5% was found to be not suitable areas for hotel site selection
The document compares the use of ordinary least squares (OLS) regression and geographically weighted regression (GWR) to model and estimate electricity distribution patterns using land use and demographic data. OLS regression provided moderately good results with an R2 value of 31.9% but showed spatial autocorrelation. GWR accounted for spatial non-stationarity and provided better results with an R2 of 51.65%. GWR also had a lower Akaike information criterion score, indicating it was a better model. The study area of Manali, India was classified into land use types from satellite imagery and population growth was also considered. GWR was found to provide a more effective model for estimating patterns of low tension electricity distribution networks
Suitability Analysis of Waste Disposal Site of Kathmandu DistrictAshmita Dhakal
# The main objectives of the project is:
To determine suitable sites for waste disposal within the 15 km buffer distance from Kathmandu district.
# Following are the sub-objectives of the project:
1.To identify the important criteria for locating a solid waste disposal site.
2. To map suitable disposal site along with suitability and restriction model.
IJRET-V1I1P3 - Remotely Sensed Images in using Automatic Road Map CompilationISAR Publications
High Resolution satellite Imagery is an important source for road network extraction for
roads database creation, refinement and updating. Various sources of imagery are known for their
differences in spectral, spatial, radioactive and temporal characteristics and thus are suitable for
different purposes of vegetation mapping. A number of shape descriptors are computed to reduce
the misclassification between road and other spectrally similar objects. The detected road segments
are further refined using morphological operations to form final road network, which is then
evaluated for its completeness, correctness and quality. The proposed methodology has been tested
on updating on road extraction from remotely-sensed imagery.
Geostatistics for radiological characterization and sampling optimizationGeovariances
Find out in a few slides why geostatistics is essential to a reliable and precise radiological characterization.
This presentation has been made by our expert during WM 2013 Conference in Phoenix.
Topographic Information System as a Tool for Environmental Management, a Case...iosrjce
IOSR Journal of Environmental Science, Toxicology and Food Technology (IOSR-JESTFT) multidisciplinary peer-reviewed Journal with reputable academics and experts as board member. IOSR-JESTFT is designed for the prompt publication of peer-reviewed articles in all areas of subject. The journal articles will be accessed freely online.
Automatic Delineation of Grid based and Geo-Morphological Slope Units for Sus...Omar F. Althuwaynee
+ Introduction to mapping units theory and practice
+ How to Build, edit and run a Graphical modeler tool in QGIS?
+ How to run QGIS modeler to integrate thematic maps with training/ testing landslides data
This document describes a study that used multi-criteria decision analysis (MCDA) to select suitable sites for nuclear power plants in Egypt. Six constraints and twenty-two factors related to safety, environment, and socioeconomics were considered. Three MCDA models were applied: 1) binary overlay to identify candidate areas by eliminating constrained lands, 2) weighted linear combination to produce potential site maps based on factor weights, and 3) analytic hierarchy process to rank four candidate sites on the northwest and Red Sea coasts. The study found El Dabaa site to be most suitable followed by East El Negila site.
Determining the Absolute Height of the Ground using the Global Mapper Program...YogeshIJTSRD
The main goal is to use modern GAT technologies to determine the absolute height of the ground using the Global Mapper program and to create a relief of eroded lands on the basis of an automated system and to create and apply maps that will increase a number of economic savings based on regional data. Shoxrux Fayziev | Zulfizar Esanova | Nuriddin Abdiraxmatovich Abdiraxmatov "Determining the Absolute Height of the Ground using the Global Mapper Program and Creating the Relief of Eroded Lands on the Basis of an Automated System" Published in International Journal of Trend in Scientific Research and Development (ijtsrd), ISSN: 2456-6470, Special Issue | International Research Development and Scientific Excellence in Academic Life , March 2021, URL: https://www.ijtsrd.com/papers/ijtsrd38723.pdf Paper Url: https://www.ijtsrd.com/engineering/other/38723/determining-the-absolute-height-of-the-ground-using-the-global-mapper-program-and-creating-the-relief-of-eroded-lands-on-the-basis-of-an-automated-system/shoxrux-fayziev
This document summarizes a study that used GIS and multi-criteria decision analysis to select suitable landfill sites in Sulaymaniyah City, Iraq. Sixteen criteria were used to evaluate potential sites, including proximity to water wells, roads, airports, and other factors. The analytical hierarchy process was used to determine weights for each criterion. GIS was then used to overlay the weighted criteria and identify areas most suitable for landfills. Two candidate sites were selected within the most suitable areas based on having sufficient size and meeting environmental criteria.
Gis spatial analysis for digital elevation model dem applicationIAEME Publication
This document discusses using GIS spatial analysis to analyze digital elevation models (DEMs) before and after construction of the Alsukhna city project in Egypt. Two DEMs were created, one before and one after construction, using field surveys, satellite images, and topographic maps. GIS was used to compare the DEMs and determine the volume of cutting and filling during construction. The analysis found that the total volume of cutting from mountains was 116,405,841 cubic meters and the total volume of filling was 113,612,511 cubic meters, with 98% of cut material used for filling. The cutting and filling process helped protect the project area from rainfall risks and mountain collapse.
The document outlines topics related to horizontal positioning in engineering surveys, including introduction to horizontal positioning, datum defects, and methods to provide horizontal control such as triangulation, trilateration, intersection, and resection. It discusses these topics over several pages with examples and explanations. The focus is on establishing accurate horizontal positioning for engineering projects.
This presentation discusses using GIS to analyze flood hazards through vulnerability indexing. It begins by outlining the objectives and typical causes of flooding. GIS can help by mapping flood areas and modeling flood simulations. Important data includes DEM, land use, soil type and rainfall data. A methodology is described for Trivandrum City that considers factors like runoff, soil type, slope and land cover to calculate a flood hazard index. Part B discusses aligning drainage systems. Another methodology for Cochin City is shown through a flow chart. Multi-criteria evaluation is used to assign vulnerability scores and weights to create a cumulative vulnerability map. Analysis of the 2015 Chennai floods is also summarized, which considered rainfall data, drainage systems and terrain factors
Numerical simulation of wind flow over complex terrain (yangon city)Zin Soul
This document describes a numerical simulation of wind flow over the complex terrain of Yangon City, Myanmar. The study uses the OpenFOAM computational fluid dynamics (CFD) toolbox to model wind flow for different directions using the k-epsilon turbulence model. Vertical wind speed profiles are simulated for various locations in Yangon and compared to measured field data. The results show the influence of Yangon's topography on wind directions. Accounting for more wind direction sectors could improve the vertical wind profile predictions. This research aims to help engineers better understand wind conditions for building design in Yangon.
International Journal of Engineering and Science Invention (IJESI)inventionjournals
International Journal of Engineering and Science Invention (IJESI) is an international journal intended for professionals and researchers in all fields of computer science and electronics. IJESI publishes research articles and reviews within the whole field Engineering Science and Technology, new teaching methods, assessment, validation and the impact of new technologies and it will continue to provide information on the latest trends and developments in this ever-expanding subject. The publications of papers are selected through double peer reviewed to ensure originality, relevance, and readability. The articles published in our journal can be accessed online.
This document describes a surveying project conducted by a group of students from the Department of Civil and Geomatics Engineering at Tribhuwan University. It provides an overview of the objectives and methodology for conducting topographic surveying, bridge site surveying, road alignment surveying, and an introduction to geographic information systems. The group's project involved topographic mapping, bridge site data collection, horizontal and vertical road alignment design, and cross-section surveying at a field site along the Kali Khola river.
Gis based multi criteria suitability analysis of community hospitalSourav Bhadra
Site selection for sitting of urban activities/facilities is one of the crucial policy-related decisions taken by urban planners and policy makers. The process of site selection is inherently complicated. A careless site imposes exorb itant costs on city budget and damages the environment inevitably. Nowadays, mu lti -attributes decision making approaches are suggested to use to improve precision of decision making and reduce surplus side effects. To find out a suitable location for Community Hospitals in an urban area, GIS based multicriteria analysis is very helpful and accurate. In this project Ward No-22 in Dhaka City is taken as a study area to do a Suitability Analysis for Community Hospitals.
TYBSC IT PGIS Unit I Chapter II Geographic Information and Spacial DatabaseArti Parab Academics
This document discusses geographic information systems and spatial databases. It covers several key topics:
1) Models and representations of the real world in digital form, including raster and vector data models. Raster models use a grid approach while vector models represent points, lines and polygons.
2) Types of geographic phenomena like fields and objects that can be represented. Fields have values across a continuous space like elevation, while objects are discrete like roads.
3) Computer representations including raster and vector formats. Raster uses a grid of cells while vector uses points, lines and polygons.
4) Topology and spatial relationships between objects like containment, overlap and adjacency.
5) Organizing and managing spatial data in
This document summarizes a student's research project on quantifying levels of service (LOS) at uncontrolled median openings using approach speed delay. The student conducted a literature review on previous studies that used area occupancy and service delay as measures of effectiveness. Speed data was then collected and statistical analysis found a significant decrease in speeds within the median opening area. A quadratic equation was developed using regression that can estimate the percentage reduction in speed with 92% accuracy based on the speed within the median opening. Clustering techniques will then be used to determine the LOS criteria based on the quantified delays.
This document estimates the expected number of accidents on sections of a road in Nagpur, India and examines the relationship between accidents and geometric road variables. Accident and road characteristic data were collected for eight sections over three years. Negative binomial regression identified relationships between accidents and average daily traffic, road width, length, speed, and number of accesses. The empirical Bayes method was then used to calculate the expected number of accidents, standard deviation, and expected accidents per km/year for each section. Results show variations in expected accidents across sections based on their characteristics.
IJRET : International Journal of Research in Engineering and Technology is an international peer reviewed, online journal published by eSAT Publishing House for the enhancement of research in various disciplines of Engineering and Technology. The aim and scope of the journal is to provide an academic medium and an important reference for the advancement and dissemination of research results that support high-level learning, teaching and research in the fields of Engineering and Technology. We bring together Scientists, Academician, Field Engineers, Scholars and Students of related fields of Engineering and Technology
Gravitational search algorithm with chaotic map (gsa cm) for solving optimiza...eSAT Journals
Abstract
Gravitational Search Algorithm (GSA) is a newly heuristic algorithm inspired by nature which utilizes Newtonian gravity law and
mass interactions. It has captured much attention since it has provided higher performance in solving various optimization
problems. This study hybridizes the GSA and chaotic equations. Ten chaotic-based GSA (GSA-CM) methods, which define the
random selections by different chaotic maps, have been developed. The proposed methods have been applied to the minimization
of benchmark problems and the results have been compared. The obtained numeric results show that most of the proposed
algorithms have increased the performance of GSA and have developed its quality of solution.
Keywords: Computational Intelligence, Evolutionary Computation, Heuristic Algorithms, Chaotic Maps, Optimization
Methods.
This document presents models developed to predict rates of different types of accidents (total, fatal, injury, damage) on a rural road in Saudi Arabia based on geometric design elements and traffic volume. Statistical analyses were conducted using accident and road data over 5 years. Multiple linear regression models were developed relating accident rates to average curvature, average gradient, number of horizontal/vertical curves, and average annual daily traffic. The models showed acceptable correlation and were found to be statistically significant, indicating relationships between accident rates and road/traffic characteristics. The developed models can be used for short-term accident prediction and identification of safety-influencing factors.
Comparison of Ordinary Least Square Regression and Geographically Weighted Re...theijes
The International Journal of Engineering & Science is aimed at providing a platform for researchers, engineers, scientists, or educators to publish their original research results, to exchange new ideas, to disseminate information in innovative designs, engineering experiences and technological skills. It is also the Journal's objective to promote engineering and technology education. All papers submitted to the Journal will be blind peer-reviewed. Only original articles will be published.
The papers for publication in The International Journal of Engineering& Science are selected through rigorous peer reviews to ensure originality, timeliness, relevance, and readability.
Theoretical work submitted to the Journal should be original in its motivation or modeling structure. Empirical analysis should be based on a theoretical framework and should be capable of replication. It is expected that all materials required for replication (including computer programs and data sets) should be available upon request to the authors.
The International Journal of Engineering & Science would take much care in making your article published without much delay with your kind cooperation
International Refereed Journal of Engineering and Science (IRJES)irjes
International Refereed Journal of Engineering and Science (IRJES) is a leading international journal for publication of new ideas, the state of the art research results and fundamental advances in all aspects of Engineering and Science. IRJES is a open access, peer reviewed international journal with a primary objective to provide the academic community and industry for the submission of half of original research and applications
A bayesian model for predicting road traffic fatalities in ghanaAlexander Decker
This document presents a Bayesian statistical model for predicting annual road traffic fatalities in each of Ghana's 10 regions based on population size, number of registered vehicles, and historical fatality data from 1991 to 2011. The model assumes the parameters (alpha and beta) relating fatalities to population and vehicles vary by region and follow normal distributions informed by previous estimates. Markov chain Monte Carlo sampling is used to estimate the posterior distributions of the parameters for each region and predict future fatalities. The data shows population and vehicles are the main factors influencing fatalities.
Surveying for Civil engineering is a
particular type of surveying known as "land surveying", it is the
detailed study or inspection, as by gathering information through
observations, measurements in the field, questionnaires, or
research of legal instruments, and data analysis in the support of
planning, designing, and establishing of property boundaries.
Land surveying can include associated services such as mapping
and related data accumulation, construction layout surveys,
precision measurements of length, angle, elevation, area, and
volume, as well as horizontal and vertical control surveys, and
the analysis and utilization of land survey data. Surveyors use
various tools to do their work successfully and accurately, such
as total stations, robotic total stations, GPS receivers, prisms, 3D
scanners, radio communicators, handheld tablets, digital levels,
and surveying software.
Survey data can be directly entered into a GIS from digital
data collection systems on survey instruments. When data is
captured, the user should consider if the data should be captured
with either a relative accuracy or absolute accuracy, since this
could not only influence how information will be interpreted but
also the cost of data captured.
In this paper GIS maps were developed depending on the
field surveying data made for a two traverses. First one has ribs
less than 50m length and the other larger than 50m. Each
traverse is holding five times using five equipments and
instruments: Tape, Level, Digital level, Digital theodolite and
Laser tape. Also those maps were drawn by using both of ACAD
and ArcView softwares. Then a detail surveying map was
produced. The precision was computed for both traverses in each
method. Its value is range from 1/140 to 1/10000.
Using of intelligent communicational devices in controlling road structural w...IOSR Journals
The goal of this paper is to state and evaluate the differences in gap acceptance observations
between left lane and right lane change, and experiment overall aggressiveness by the means of right lane
change behaviors and use of electrical instruments for reaching this goal, furthermore we use Digital Signal
Processing on our controlling cameras to be able to distinguish different behaviours of drivers. Also, in this
paper we evaluate the decision making process of drivers, we do this work with use of electrical sensors for
accumulating some data and clarifying and processing them and finally with use of cumulative distribution
functions of driver lane change behaviours from the observed field data. These experiments are performed for
drivers using I-20 in Grand Prairie, Texas with the roadside controlling cameras and some other electronical
controlling instruments which were amounted near the intersection of I-20 and Great Southwest Blvd. Our
experiments and evaluations demonstrates, that the whole ratio of right lane change observations to left lane
change observations was close to 3 to 1.
Towards the Implementation of the Sudan Interpolated Geoid Model Khartoum Sta...ijtsrd
The discussions between ellipsoid and geoid have invoked many researchers during the recent decades, especially during the GNSS technology era, which had witnessed a great deal of development but still geoid undulation requires more investigations. To figure out a solution for Sudans local geoid, this research has tried to intake the possibility of determining the geoid model by following two approaches, gravimetric and geometrical geoid model determination, by making use of GNSS leveling benchmarks at Khartoum state. The Benchmarks are well distributed in the study area, in which, the horizontal coordinates and the height above the ellipsoid have been observed by GNSS while orthometric heights were carried out using precise leveling. The Global Geopotential Model GGM represented in EGM2008 has been exploited to figure out the geoid undulation at the benchmarks in the study area. This is followed by a fitting process, that has been done to suit the geoid undulation data which has been computed using GNSS leveling data and geoid undulation inspired by the EGM2008. Two geoid surfaces were created after the fitting process to ensure that they are identical and both of them could be counted for getting the same geoid undulation with an acceptable accuracy. In this respect, statistical operation played an important role in ensuring the consistency and integrity of the model by applying cross validation techniques splitting the data into training and testing datasets for building the geoid model and testing its eligibility. The geometrical solution for geoid undulation computation has been utilized by applying straightforward equations that facilitate the calculation of the geoid undulation directly through applying statistical techniques for the GNSS leveling data of the study area to get the common equation parameters values that could be utilized to calculate geoid undulation of any position in the study area within the claimed accuracy. Both systems were checked and proved eligible to be used within the study area with acceptable accuracy which may contribute to solving the geoid undulation problem in the Khartoum area, and be further generalized to determine the geoid model over the entire country, and this could be considered in the future, for regional and continental geoid model. Ahmed M. A. Mohammed. | Kamal A. A. Sami "Towards the Implementation of the Sudan Interpolated Geoid Model (Khartoum State Case Study)" Published in International Journal of Trend in Scientific Research and Development (ijtsrd), ISSN: 2456-6470, Volume-8 | Issue-1 , February 2024, URL: https://www.ijtsrd.com/papers/ijtsrd63483.pdf Paper Url: https://www.ijtsrd.com/engineering/civil-engineering/63483/towards-the-implementation-of-the-sudan-interpolated-geoid-model-khartoum-state-case-study/ahmed-m-a-mohammed
This document summarizes a study that evaluated the accuracy of GPS and automatic level instruments for topographic surveying. The study collected elevation data using both instruments at points in a study area in Iraq. The data was input into GIS software to create contour maps and digital elevation models (DEMs) from each dataset. The accuracy of the DEMs was then evaluated and compared. The results showed the effect that the source data, DEM resolution, and ground control point distribution had on accuracy. This allowed the study to assess the relative accuracy and effectiveness of GPS versus automatic leveling for topographic data collection and DEM generation.
This document summarizes a study that evaluated the accuracy of GPS and automatic level instruments for topographic surveying. Researchers collected elevation data for 25 points in the study area using both a GPS receiver and an automatic level. They then used ArcGIS to create contour maps and digital elevation models from each dataset. The results showed that the GPS data had lower standard deviation and was therefore more accurate than the automatic level data. However, automatic leveling remains a cost-effective method for small study areas. The integration of GPS and GIS techniques allows for efficient processing and analysis of spatial data to produce high accuracy topographic maps and DEMs.
Consequences of Road Traffic Accident in Nigeria: Time Series Approach Editor IJCATR
Road traffic accident in Nigeria is increasing at a worrying rate and has raised one of the country major concerns. We provided appropriate and suitable time series model for the consequences of road accident, the injured, killed and total casualty of the road accident in Nigeria. The most widely used conventional method, Autoregressive Integrated Moving Average (ARIMA) model of time series, also known as Box-Jenkins method is applied to yearly data on the consequences of road accident data in Nigeria from 1960-2013 to determine patterns of road traffic accident consequences; injured, killed and total casualty of the road accident along the Nigeria motorway. Appropriate models are developed for the accident consequences; injured, killed and total casualty. ARIMA (0; 2; 1) model is obtained for the injury and total casualty consequences, whilst ARIMA(1,2,2) model is obtained for the killed consequences, using the data from 1960-2011. The adequacy and the performance of the model are tested on the remaining data from 2012 to 2013. Seven years forecast are provided using the developed models and showed that road traffic accident consequences examined; injured, killed and total casualty would continue to increase on average.
Vehicle positioning in urban environments using particle filtering-based glob...IJECEIAES
This article presents a new method for land vehicle navigation using global positioning system (GPS), dead reckoning sensor (DR), and digital road map information, particularly in urban environments where GPS failures can occur. The odometer sensors and map measure can be used to provide continuous navigation and correct the vehicle location in the presence of GPS masking. To solve this estimation problem for vehicle navigation, we propose to use particle filtering for GPS/odometer/map integration. The particle filter is a method based on the Bayesian estimation technique and the Monte Carlo method, which deals with non-linear models and is not limited to Gaussian statistics. When the GPS sensor cannot provide a location due to the number of satellites in view, the filter fuses the limited GPS pseudo-range data to enhance the vehicle positioning. The developed filter is then tested in a transportation network scenario in the presence of GPS failures, which shows the advantages of the proposed approach for vehicle location compared to the extended Kalman filter.
Quantifying modelingon risk of travel demand and measure to sustaining road s...eSAT Journals
Abstract In these days urbanization of road transportation facilities are more complexity to developing in the form of to improve road safety. With the increased usage of Vehicles has enhanced the need for developing the infrastructure where these motor vehicles can move safely. By developing safe roads which connect destinations and cities is a key foundation to infrastructural development in a safe connectivity of road transportation. Mainly in this study can approach the road safety by using principal component analysis(PCA) by using MAT LAB and geographical information system (GIS) Arc-GIS software to develop base maps and accident causing zones identify in the study area. In this study an attempt has been made to study the existing road network for Ongole, Pernamitta village road (Kurnool road state highway) area and propose the necessary improvements to be done. And this model presented in this paper discussing with a multi set of variables under the one dimensionality set to identifying and deriving the new data set for risk identify zones with raking by this analysis of principal component analysis. The safety audit is defined as the place or location which causes number of accidents. It may be curve or faulty infrastructure. Such accidents are taken as input from Ongole taluka Police Station at Ongole for further study. These accidents are registered from First Information Report (FIR) informed by people. The study areas taken into consideration are Ongole to Pernamitta village Road (Ongole to Kurnool UN divided two way line state highway). The aim of this study is to minimize the accidents and find out the risk identify zones on the particular road network. Key words: road safety,faulty infrastructure, PCA analysis, Arc-GIS,FIR and urbanization.
Tarımsal Toprak Haritalama'da Jeofizik MühendisliğiAli Osman Öncel
1) The document discusses a study evaluating the reliability and reproducibility of electromagnetic induction (EMI) data collection.
2) The study compared data from two identical EMI instruments, the calibration methods of different individuals, and variations in calibration height.
3) The results showed significant differences between instruments, calibrations, and heights. This demonstrates the need for standardization of EMI data collection procedures to ensure reliable and reproducible data.
Individual movements and geographical data mining. Clustering algorithms for ...Beniamino Murgante
Individual movements and geographical data mining. Clustering algorithms for highlighting hotspots in personal navigation routes.
Giuseppe Borruso, Gabriella Schoier - University of Trieste
Similar to Risk governance for traffic accidents by Geostatistical Analyst methods (20)
Exploratory study on the use of crushed cockle shell as partial sand replacem...IJRES Journal
The increasing demand for natural river sand supply for the use in construction industry along
with the issue of environmental problem posed by the dumping of cockle shell, a by-product from cockle
business have initiated research towards producing a more environmental friendly concrete. This research
explores the potential use of cockle shell as partial sand replacement in concrete production. Cockle shell used
in this experimental work were crushed to smaller size almost similar to sand before mixed in concrete. A total
of six concrete mixtures were prepared with varying the percentages of cockle shell viz. 0%, 5%, 10%, 15%,
20% and 25%. All the specimens were subjected to continuous water curing. The compressive strength test was
conducted at 28 days in accordance to BS EN 12390. Finding shows that integration of suitable content of
crushed cockle shell of 10% as partial sand replacement able to enhance the compressive strength of concrete.
Adopting crushed cockle shell as partial sand replacement in concrete would reduce natural river sand
consumption as well as reducing the amount of cockle shell disposed as waste.
Congenital Malaria: Correlation of Umbilical Cord Plasmodium falciparum Paras...IJRES Journal
The vertical (trans-placental) transmission of the parasite Plasmodium falciparum from
pregnant mother to fetus during gestational period was investigated in a clinical research involving 43 full term
pregnant women in selected Hospitals in Jimeta Yola, Adamawa State Nigeria. During the observational study,
parasitemia was determined by light microscopic examination of umbilical and maternal peripheral blood film
for the presence of the trophozoites of Plasmodium falciparum. Correlational analysis was then carried on the
result obtained at p<0.05.><0.05) was established between maternal peripheral blood and umbilical cord
blood parasitemia with Pearson’s correlation coefficient of 0.762. Thus, in a malaria endemic area like Yola,
Adamawa State, Nigeria, with a stable transmission of parasite, there is a high probability of vertical
transmission of Plasmodium falciparum parasite from mother to fetus during gestation that can be followed by
the presentation of the symptoms of malaria by the newborn and other malaria related complications. Families
are advised to consistently sleep under appropriately treated insecticide mosquito net to avoid mosquito bite and
subsequent infestation.
Review: Nonlinear Techniques for Analysis of Heart Rate VariabilityIJRES Journal
Heart rate variability (HRV) is a measure of the balance between sympathetic mediators of heart
rate that is the effect of epinephrine and norepinephrine released from sympathetic nerve fibres acting on the
sino-atrial and atrio-ventricular nodes which increase the rate of cardiac contraction and facilitate conduction at
the atrio-ventricular node and parasympathetic mediators of heart rate that is the influence of acetylcholine
released by the parasympathetic nerve fibres acting on the sino-atrial and atrio-ventricular nodes leading to a
decrease in the heart rate and a slowing of conduction at the atrio-ventricular node. Sympathetic mediators
appear to exert their influence over longer time periods and are reflected in the low frequency power(LFP) of
the HRV spectrum (between 0.04Hz and 0.15 Hz).Vagal mediators exert their influence more quickly on the
heart and principally affect the high frequency power (HFP) of the HRV spectrum (between 0.15Hz and 0.4
Hz). Thus at any point in time the LFP:HFP ratio is a proxy for the sympatho- vagal balance. Thus HRV is a
valuable tool to investigate the sympathetic and parasympathetic function of the autonomic nervous system.
Study of HRV enhance our understanding of physiological phenomenon, the actions of medications and disease
mechanisms but large scale prospective studies are needed to determine the sensitivity, specificity and predictive
values of heart rate variability regarding death or morbidity in cardiac and non-cardiac patients. This paper
presents the linear and nonlinear to analysis the HRV.
Dynamic Modeling for Gas Phase Propylene Copolymerization in a Fluidized Bed ...IJRES Journal
The document presents a dynamic two-phase model for a fluidized bed reactor used to produce polypropylene. The model divides the reactor into an emulsion phase and bubble phase, with reaction assumed to occur in both phases. Simulation results show the temperature profile is lower than previous single-phase models due to considering both phases. Approximately 13% of the produced polymer comes from the bubble phase, demonstrating the importance of accounting for both phases.
Study and evaluation for different types of Sudanese crude oil propertiesIJRES Journal
Sudanese crude oil is regarded as one of the sweet types of crude in the world, Sulphur containing
compounds are un desirable in petroleum because they de activate the catalyst during the refining processes and
are the main source of acid rains and environmental pollution.(Mark Cullen 2001),Since it contains considerable
amount of salts and acids, it negatively impact the production facilities and transportation lines with corrosive
materials. However it suffers other problems in flow properties represented by the high viscosity and high
percentage of wax. Samples were collected after the initial and final treatment at CPF, and tested for
physical and chemical properties.wax content is in the range 23-31 weight % while asphalting content is about
0.1 weight% . Resin content is 13-7 weight % and deposits are 0.01 weight%. The carbon number distribution in
the crude is in the range 7-35 carbon atoms. The pour point vary between 39°C-42°C and the boiling point is in
the range 70 °C - 533 °C.
A Short Report on Different Wavelets and Their StructuresIJRES Journal
This article consists of basics of wavelet analysis required for understanding of and use of wavelet
theory. In this article we briefly discuss about HAAR wavelet transform their space and structures.
A Case Study on Academic Services Application Using Agile Methodology for Mob...IJRES Journal
Recently, Mobile Cloud Computing reveals many modern development areas in the Information
Technology industry. Several software engineering frameworks and methodologies have been developed to
provide solutions for deploying cloud computing resources on mobile application development. Agile
methodology is one of the most commonly used methodologies in the field. This paper presents the MCCAS a
Web and Mobile application that provide feature for the Palestinian higher education/academic institutions. An
Agile methodology was used in the development of the MCCAS but in parallel with emphasis on Cloud
computing resources deployment. Also many related issues is discussed such as how software engineering
modern methodologies (advances) influenced the development process.
Wear Analysis on Cylindrical Cam with Flexible RodIJRES Journal
Firstly, the kinetic equation of spatial cylindrical cam with flexible rod has been established. Then, an
accurate cylindrical cam mechanism model has been established based on the spatial modeling software
Solidworks. The dynamic effect of flexible rod on mechanical system was studied in detail based on the
mechanical system dynamics analytical software Adams, and Archard wear model is used to predict the wear of
the cam. We used Ansys to create finite element model of the cam link, extracted the first five order mode to
export into Adams. The simulation results show that the dynamic characteristics of spatial cylindrical cam
mechanical system with flexible rod is closed to ideal mechanism. During the cam rotate one cycle, the collision
in the linkage with a clearance occurs in some special location, others still keep a continuous contact, and the
prediction of wear loss is smaller than rigid body.
DDOS Attacks-A Stealthy Way of Implementation and DetectionIJRES Journal
Cloud Computing is a new paradigm provides various host service [paas, saas, Iaas over the internet.
According to a self-service,on-demand and pay as you use business model,the customers will obtain the cloud
resources and services.It is a virtual shared service.Cloud Computing has three basic abstraction layers System
layer(Virtual Machine abstraction of a server),Platform layer(A virtualized operating system, database and
webserver of a server and Application layer(It includes Web Applications).Denial of Service attack is an attempt
to make a machine or network resource unavailable to the intended user. In DOS a user or organization is
deprived of the services of a resource they would normally expect to have.A Successful DOS attack is a highly
noticeable event impacting the entire online user base.DOS attack is found by First Mathematical Metrical
Method (Rate Controlling,Timing Window,Worst Case and Pattern Matching)DOS attack not only affect the
Quality of the service and also affect the performance of the server. DDOS attacks are launched from Botnet-A
large Cluster of Connected device(cellphone,pc or router) infected with malware that allow remote control by an
attacker. Intruder using SIPDAS in DDOS to perform attack.SIPDAS attack strategies are detected using Heap
Space Monitoring Algorithm.
An improved fading Kalman filter in the application of BDS dynamic positioningIJRES Journal
Aiming at the poor dynamic performance and low navigation precision of traditional fading
Kalman filter in BDS dynamic positioning, an improved fading Kalman filter based on fading factor vector is
proposed. The fading factor is extended to a fading factor vector, and each element of the vector corresponds to
each state component. Based on the difference between the actual observed quantity and the predicted one, the
value of the vector is changed automatically. The memory length of different channel is changed in real time
according to the dynamic property of the corresponding state component. The actual observation data of BDS is
used to test the algorithm. The experimental results show that compared with the traditional fading Kalman filter
and the method of the third references, the positioning precision of the algorithm is improved by 46.3% and
23.6% respectively.
Positioning Error Analysis and Compensation of Differential Precision WorkbenchIJRES Journal
The document analyzes positioning errors in differential precision workbenches and proposes a compensation method. It discusses sources of error in workbench transmission systems and guides. Through theoretical analysis and experimentation, it is shown that positioning errors increase with travel distance due to factors like guideway errors. A method is developed to sample positioning at multiple points, compare values to identify errors, and implement reverse error correction through motion control cards. This allows positioning accuracy better than 15 micrometers over 150mm of travel to be achieved. The compensation method can improve precision for a range of machine tool designs.
Status of Heavy metal pollution in Mithi river: Then and NowIJRES Journal
The Mithi River runs through the heart of suburban Mumbai. Its path of flow has been severely
damaged due to industrialization and urbanization. The quality of water has been deteriorating ever since. The
Municipal and industrial effluents are discharged in unchecked amounts. The municipal discharge comprises
untreated domestic and sewage wastes whereas the industries are majorly discharge chemicals and other toxic
effluents which are responsible in increasing the metal load of the river. In the current study, the water is
analysed for heavy metals- Copper, Cadmium, Chromium, Lead and Nickel. It also includes a brief
understanding on the fluctuations that have occurred in the heavy metal pollution, through the compilation of
studies carried out in the area previously.
The Low-Temperature Radiant Floor Heating System Design and Experimental Stud...IJRES Journal
In order to analyze the temperature distribution of the low-temperature radiant floor heating system
that uses the condensing wall-hung boiler as the heat source, the heating system is designed according to a typical
house facing south in Shanghai. The experiments are carried out to study the effects of the supply water
temperature on the thermal comfort of the system. Eventually, the supply water temperature that makes people in
the room feel more comfortable is obtained. The result shows that in the condition of that the outside temperature
is 8~15℃ and the relative humidity is 30~70%RH, the temperature distribution in the room is from high to low
when the height is from bottom to top. The floor surface temperature is highest, but its uniformity is very poor.
When the heating system reaches the steady state, the air temperature of the room is uniform. When the supply
water temperature is 63℃ The room is relatively comfortable at the above experimental condition.
Experimental study on critical closing pressure of mudstone fractured reservoirsIJRES Journal
This study examines the critical closing pressure of fractures in mudstone reservoir cores from the Daqing oilfield in China. Laboratory experiments subjected fractured and unfractured mudstone cores to increasing external pressures while measuring permeability. The critical closing pressure is defined as the pressure when fractured core permeability matches unfractured permeability, indicating fracture closure. Results show fractured cores have higher permeability than unfractured cores due to fractures. Permeability generally decreases exponentially with increasing pressure. By calculating sensitivity equations relating permeability and production pressure difference, the study estimates critical closing pressures under reservoir conditions are lower than values from external pressure experiments. The study provides guidance but notes limitations in fully simulating complex in-situ stress conditions.
Correlation Analysis of Tool Wear and Cutting Sound SignalIJRES Journal
With the classic signal analysis and processing method, the cutting of the audio signal in time
domain and frequency domain analysis. We reached the following conclusions: in the time domain analysis,
cutting audio signals mean and the variance associated with tool wear state change occurred did not change
significantly, and tool wear is not high degree of correlation, and the mean-square value of the audio signal
changes in the size and tool wear the state has a good relationship.
Reduce Resources for Privacy in Mobile Cloud Computing Using Blowfish and DSA...IJRES Journal
Mobile cloud computing in light of the increasing popularity among users of mobile smart
technology which is the next indispensable that enables users to take advantage of the storage cloud computing
services. However, mobile cloud computing, the migration of information on the cloud is reliable their privacy
and security issues. Moreover, mobile cloud computing has limitations in resources such as power energy,
processor, Memory and storage. In this paper, we propose a solution to the problem of privacy with saving and
reducing resources power energy, processor and Memory. This is done through data encryption in the mobile
cloud computing by symmetric algorithm and sent to the private cloud and then the data is encrypted again and
sent to the public cloud through Asymmetric algorithm. The experimental results showed after a comparison
between encryption algorithms less time and less time to decryption are as follows: Blowfish algorithm for
symmetric and the DSA algorithm for Asymmetric. The analysis results showed a significant improvement in
reducing the resources in the period of time and power energy consumption and processor.
Resistance of Dryland Rice to Stem Borer (Scirpophaga incertulas Wlk.) Using ...IJRES Journal
Rice stem borer is one of the important pests that attack plants so as to reduce production. One way
to control pests is to use organic fertilizers that make the plant stronger and healthier. This study was conducted
to determine the effects of organic fertilizers with various doses without the use of pesticides in controlling stem
borer, Scirpophaga incertulas. Methods using split-split plot design which consists of two levels of the whole
plot factor (solid and liquid organic fertilizers), two levels of the subplot factor (conventional and industry,
Tiens and Mitraflora), and four levels of the sub-subplot factor of conventional and industry (5, 10, 15, 20
tonnes/ha), and one level of the sub-subplot factor of Tiens and Mitraflora (each 2 ml/l). Based on the results
Statistical analysis there were no significant differences among treatments and this shows that the use of organic
fertilizers that only a dose of 5 tonnes/ha is sufficient available nutrients that make plants more robust and
resistant to control stem borer, besides that can reduce production costs and friendly to the environment when
compared with using inorganic fertilizers.
A novel high-precision curvature-compensated CMOS bandgap reference without u...IJRES Journal
A novel high-precision curvature-compensated bandgap reference (BGR) without using op-amp
is presented in this paper. It is based on second-order curvature correction principle, which is a weighted sum of
two voltage curves which have opposite curvature characteristic. One voltage curve is achieved by first-order
curvature-compensated bandgap reference (FCBGR) without using op-amp and the other found by using W
function is achieved by utilizing a positive temperature coefficient (TC) exponential current and a linear
negative TC current to flow a linear resistor. The exponential current is gained by using anegative TC voltage to
control a MOSFET in sub-threshold region. In the temperature ranging from -40℃ to 125℃, experimental
results implemented with SMIC 0.18μm CMOS process demonstrate that the presented BGR can achieve a TC
as low as 2.2 ppm/℃ and power-supply rejection ratio(PSRR)is -69 dB without any filtering capacitor at 2.0 V.
While the range of the supply voltage is from 1.7 to 3.0 V, the output voltage line regulation is about1 mV/ V
and the maximum TC is 3.4 ppm/℃.
Structural aspect on carbon dioxide capture in nanotubesIJRES Journal
In this work we reported the carbon dioxide adsorption (CO2) in six different nanostructures in order
to investigate the capturing capacity of the materials at nanoscale. Here we have considered the three different
nanotubes including zinc oxide nanotube (ZnONT), silicon carbide nanotube (SiCNT) and single walled carbon
nanotube (SWCNT). Three different chiralities such as zigzag (9,0), armchair (5,5) and chiral (6,4) having
approximately same diameter are analyzed. The adsorption binding energy values under various cases are
estimated with density functional theory (DFT). We observed CO2 molecule chemisorbed on ZnONT and
SiCNT’s whereas the physisorption is predominant in CNT. To investigate the structural aspect, the tubes with
defects are studied and compared with defect free tubes. We have also analyzed the electrical properties of tubes
from HOMO, LUMO energies. Our results reveal the defected structure enhance the CO2 capture and is
predicted to be a potential candidate for environmental applications.
Thesummaryabout fuzzy control parameters selected based on brake driver inten...IJRES Journal
In this paper, the brake driving intention identification parameters based on the fuzzy control are
summarized and analyzed, the necessary parameters based on the fuzzy control of the brake driving intention
recognition are found out, and I pointed out the commonly corrupt parameters, and through the relevant
parameters , I establish the corresponding driving intention model.
We have designed & manufacture the Lubi Valves LBF series type of Butterfly Valves for General Utility Water applications as well as for HVAC applications.
Digital Twins Computer Networking Paper Presentation.pptxaryanpankaj78
A Digital Twin in computer networking is a virtual representation of a physical network, used to simulate, analyze, and optimize network performance and reliability. It leverages real-time data to enhance network management, predict issues, and improve decision-making processes.
Tools & Techniques for Commissioning and Maintaining PV Systems W-Animations ...Transcat
Join us for this solutions-based webinar on the tools and techniques for commissioning and maintaining PV Systems. In this session, we'll review the process of building and maintaining a solar array, starting with installation and commissioning, then reviewing operations and maintenance of the system. This course will review insulation resistance testing, I-V curve testing, earth-bond continuity, ground resistance testing, performance tests, visual inspections, ground and arc fault testing procedures, and power quality analysis.
Fluke Solar Application Specialist Will White is presenting on this engaging topic:
Will has worked in the renewable energy industry since 2005, first as an installer for a small east coast solar integrator before adding sales, design, and project management to his skillset. In 2022, Will joined Fluke as a solar application specialist, where he supports their renewable energy testing equipment like IV-curve tracers, electrical meters, and thermal imaging cameras. Experienced in wind power, solar thermal, energy storage, and all scales of PV, Will has primarily focused on residential and small commercial systems. He is passionate about implementing high-quality, code-compliant installation techniques.
3rd International Conference on Artificial Intelligence Advances (AIAD 2024)GiselleginaGloria
3rd International Conference on Artificial Intelligence Advances (AIAD 2024) will act as a major forum for the presentation of innovative ideas, approaches, developments, and research projects in the area advanced Artificial Intelligence. It will also serve to facilitate the exchange of information between researchers and industry professionals to discuss the latest issues and advancement in the research area. Core areas of AI and advanced multi-disciplinary and its applications will be covered during the conferences.
Impartiality as per ISO /IEC 17025:2017 StandardMuhammadJazib15
This document provides basic guidelines for imparitallity requirement of ISO 17025. It defines in detial how it is met and wiudhwdih jdhsjdhwudjwkdbjwkdddddddddddkkkkkkkkkkkkkkkkkkkkkkkwwwwwwwwwwwwwwwwwwwwwwwwwwwwwwwwwwwwwwwwwwwwwwwwwwwwwwwwwwwwwwwwwwwwwwwwwwwwwwwwwwwwwwwwwwwwwwwwwwwwwwwwwwwwwwwwwwwwwwwwwwwwwwwwwwwwwwwwwwwwwwwwwwwwwwwwwioiiiiiiiiiiiii uwwwwwwwwwwwwwwwwhe wiqqqqqqqqqqqqqqqqqqqqqqqqqqqqqqqqqqqqqqqqqqqqqqqqqqqqqqqqqqqqqqqqqqqqqqqqqqqqqqqqqqqqqqqqqqqqqqqqqqqqqqqqqqqqqqqqqqqqqqqqqqqqqqqqqqqqqqqqqqqqqqqqqqqqqqqqqqqqqqqqqqqqqqqqqqqqqqqqqqqqqqqqqqqqqqqqqqq gbbbbbbbbbbbbb owdjjjjjjjjjjjjjjjjjjjj widhi owqqqqqqqqqqqqqqqqqqqqqqqqqqqqqqqqqq uwdhhhhhhhhhhhhhhhhhhhhhhhhhhhhhhhhhhhhhhhhhhhhhhhhhhhhhhhhhhhhhhhhhhhhhhhhhhhhhhhhhhhhhhhhhhhhhhhhhhhhhhhhhhhhhhhhhhhhhhhhhhhhhhhhhhhhhhhhhhhhhhhhhhhhhhhhhhhhhhhhhhhhhhwqiiiiiiiiiiiiiiiiiiiiiiiiiiiiw0pooooojjjjjjjjjjjjjjjjjjjjjjjjjjjjjjjjjjjjjjjjjjjjjjjjjjjjjj whhhhhhhhhhh wheeeeeeee wihieiiiiii wihe
e qqqqqqqqqqeuwiiiiiiiiiiiiiiiiiiiiiiiiiiiiiiiiiiiiiiiiiiiiiiiiiiiiiiiiiiiiiiiiiiiiiiiiiiiiiiiiiiiiiiiiiiiiiiiiiiiiiiiiiiiiiiiiiiiiiiiiiiiiiiiiiiiiiiiiiiiiiiiiiiiiiiiiiiiiiiiiiiiiiiiiiiiiiiiiiiiiiiiiiiiiiiiiiiiiiiiiiiiiiiiiiiiiiiiiiiiiiiiiiiiiiiiiiiiiiiiiiiiiiiiiiiiiiiiiiiiiiiiiiiiiiiiiiiiiiiiiiiiiiiiiiiiiiiiiiiiiiiiiiiiiiiiiiqw dddddddddd cccccccccccccccv s w c r
cdf cb bicbsad ishd d qwkbdwiur e wetwwwwwwwwwwwwwwwwwwwwwwwwwwwwwwwwwwwwwwwwwwwwwwwwwwwwwwwwwwwwwwwwwwwwww w
dddddddddddddddddddddddddddddddddddddddddddddddddddddddddddddddddddddddddddddddddddddddddddddddddddddddddddfffffffffffffffffffffffffffffffffffffffffffffffffffffffffffffffffffffffffffffffffffffffffffffffffffffffffffffffffffffffffffffffffffffffffffffffffffffffffffffffffffffffffffffffffffffffffffffffffffffffffffffffffffffw
uuuuhhhhhhhhhhhhhhhhhhhhhhhhe qiiiiiiiiiiiiiiiiiiiiiiiiiiiiiiiiiiiiiiiiiiiiiiiiiiiiiiiiiiiiiii iqqqqqqqqqqqqqqqqqqqqqqqqqqqqqqqqqqqqqqqqqqqqqqqqqqqqqqqqqqqqqqqqqqqqqqqqqqqqqqqqqqqqqqqqqqqqqqqqqqqqqqqqqqqqqqqqqqqqqqqqqqqqqqqqqqqqq eeeeeeeeeeeeeeeeeeeeeeeeeeeeeeeeeeeeeeeeeeeeeeeeeeeeeeeeeeeeeeeeeeeeeeeeeeeeeeeeeeeeeeeeeeeeeeeeee qqqqqqqqqqqqqqqqqqqqqqqqqqqqqqqqqqqqqqqqqqqqqqqqqqqqqqqqqqqqqqqqqqqqqqqqqqqqqqqqqqqqqqqqqqqqqqqqqqqqqqqqqqqqqqccccccccccccccccccccccccccccccccccccccccccccccccccccccccccccc ccccccccccccccccccccccccccccccccccc bbbbbbbbbbbbbbbbbbbbbbbbbbbbbbbbbbbbbbbbbbbbbbbbbbbbbbbbbbbbbbbbbbbbbbbbbbbbbbbbu uuuuuuuuuuuuuuuuuuuuuuuuuuuuuuuuuuuuuuuuuuuuuuuuuuuuuuuuuuuuuuuuuuuuuuuuuuuuuuuuuuuuuuuuuuuuuuuuuuuuuuuuuuuuuuuuuuuuuuuuuuuuuuuuuuuuuuuuuuuuuuuuuuuuuuuuuum
m
m mmmmmmmmmmmmmmmmmmmmmmmmmmmmmmmmmmmmmmmmmmmmmmmmmmmmmmmmmmmmmmmmmmmmmmmmmmmmmmmmmmmmmmmmmmmm m i
g i dijsd sjdnsjd ndjajsdnnsa adjdnawddddddddddddd uw
Determination of Equivalent Circuit parameters and performance characteristic...pvpriya2
Includes the testing of induction motor to draw the circle diagram of induction motor with step wise procedure and calculation for the same. Also explains the working and application of Induction generator
Prediction of Electrical Energy Efficiency Using Information on Consumer's Ac...PriyankaKilaniya
Energy efficiency has been important since the latter part of the last century. The main object of this survey is to determine the energy efficiency knowledge among consumers. Two separate districts in Bangladesh are selected to conduct the survey on households and showrooms about the energy and seller also. The survey uses the data to find some regression equations from which it is easy to predict energy efficiency knowledge. The data is analyzed and calculated based on five important criteria. The initial target was to find some factors that help predict a person's energy efficiency knowledge. From the survey, it is found that the energy efficiency awareness among the people of our country is very low. Relationships between household energy use behaviors are estimated using a unique dataset of about 40 households and 20 showrooms in Bangladesh's Chapainawabganj and Bagerhat districts. Knowledge of energy consumption and energy efficiency technology options is found to be associated with household use of energy conservation practices. Household characteristics also influence household energy use behavior. Younger household cohorts are more likely to adopt energy-efficient technologies and energy conservation practices and place primary importance on energy saving for environmental reasons. Education also influences attitudes toward energy conservation in Bangladesh. Low-education households indicate they primarily save electricity for the environment while high-education households indicate they are motivated by environmental concerns.
Supermarket Management System Project Report.pdfKamal Acharya
Supermarket management is a stand-alone J2EE using Eclipse Juno program.
This project contains all the necessary required information about maintaining
the supermarket billing system.
The core idea of this project to minimize the paper work and centralize the
data. Here all the communication is taken in secure manner. That is, in this
application the information will be stored in client itself. For further security the
data base is stored in the back-end oracle and so no intruders can access it.
Risk governance for traffic accidents by Geostatistical Analyst methods
1. International Journal of Research in Engineering and Science (IJRES)
ISSN (Online): 2320-9364, ISSN (Print): 2320-9356
www.ijres.org Volume 2 Issue 9 ǁ September. 2014 ǁ PP.35-40
www.ijres.org 35 | Page
Risk governance for traffic accidents by Geostatistical Analyst
methods
Ismail Bulent Gundogdu
Department of Geomatics, Engineering Faculty, Selcuk University.
Abstract : Geographical Information Systems (GIS) are indispensable tool for administrating big datasets
based on location of measured point.
The values related to space may vary with both time and location. GIS-supported Geostatistical Analyst
(GA) can evaluate datasets by analysing the locations of points.
Maps produced using probability and prediction methods must be the base products for city planning. This
study develops methods to obtain maps to determine traffic hot zones in Konya, Turkey, by applying GA
supported by GIS.
By applying GA, this study differs from previous studies which have determined the hot spots using linear
analysis. In this study, unlike preceding studies, the aim is to determine new safe routes and zones with the help
of GA.
Another, different aim is to map and determine graduated hot or safe zones using number of mortalities
criterion (AC1), number of injured people criterion (AC2), number of accidents with damage only criterion
(AC3), and total number of accidents criterion (AC4).
Keywords: Geostatistical Analyst; GIS; traffic accidents; probability maps; prediction maps; kriging
I. Introduction
In this paper, geostatistical approaches have been used to study traffic accident datasets in a case study of
the city of Konya. The paper attempts to examine the characteristics of the spatial distribution of traffic accident
data according to the accident criteria (AC) using kriging methods and to analyse their implications for junction
spatial structure. The paper is organised as follows: after the next section on the data and methodology, I set up
and interpret the accident mortality numbers, numbers of injured, numbers of accidents with damage only, and
the total number of distribution models. Then I analyse the implications of traffic accident data models for urban
spatial structure. The last section is the conclusion.
A report from the World Health Organization (WHO) and the World Bank (WB) (2004) on road traffic
accidents and injuries estimated 1.2 million people are killed in road crashes each year and as many as 50
million are injured worldwide (Gundogdu, 2010). According to estimations of the WB traffic accidents will be
the third most frequent reason of deaths in 2020.
The Turkish Statistical Institute (TUIK) facts reveal that 665 618 traffic accidents, 2629 of which resulted
in mortality (3393 deaths), 77 644 of which resulted in injuries (135 441 injuries) and 585 345 of which resulted
in economical damage, occurred in Turkey in last seven years.
The most specified analysis and plotting can be carried out using GIS nowadays.
Large number of recent studies such as (Cho 2003; Hansen and Lauritsen, 2010; Hill et al., 2011;
Parasannakumar et al., 2011; Gu et al., 2013; Yu and Abdel-Aty, 2013 ) using the techniques that have been
developed over the last fifty years.
No studies of traffic accidents that applied GA were encountered. However, some studies discussed similar
problems: risk reduction in urban planning (Wamsler, 2006), transportation planning, discussed in an editorial
article (Journal of Transportation Planning), the relationship between noise pollution and traffic (Seto et al.,
2007), and urban traffic flow (Stathopoulos and Dimitriou, 2008).
This study differs from others in that the mapping is carried out according to the different AC. So, in this
phase, GA must be explained in detail.
II. Geostatistical Analyst
In this chapter, the connection with the basis of GA is explained to guide the application. Geostatistics is a
branch of practical statistics. Geostatistics was developed by George Matheron of the Centre de Morophologie
Mathematicque in Fontainebleau in France.
Evaluation of the traffic accident dataset according to different criteria is also not possible with known
statistical methods because the effects of sampling location are not taken into consideration in the calculations
2. Risk governance for traffic accidents by Geostatistical Analyst methods
www.ijres.org 36 |
of variance and standard deviation for any variable. In GA, weights do not depend on the distances measured or
predicted between two points.
According to Boogaart and Schaeben (2002) kriging is defined as BLUP (best linear unbiased predictor) or
BLUE (best linear unbiased estimator). The method is named after the mining engineer D.G. Krige who first
used it. (Trangmar et al, 1985) described that Kriging is an unbiased estimator of the spatial variation of
unsampled points using the attributes of a variogram.
Calculating the variance is the most important and distinctive peculiarity of kriging in comparison with
other techniques. The value is the criterion for the reliability of the estimated value. If the calculated variance is
smaller than the variance of certain values, the estimated value is reliable for the unsampled point or area.
(Pearce et al., 2009; Laguardia, 2011; Pan and Zhu, 2011) state that kriging is better than other interpolation
techniques using obtained geostatistical results.
Geostatistical Analyst provides many tools to help determine the parameters to be used and the defaults are
also provided so that a surface can be created quickly. Kriging is a moderately quick interpolator that can be
exact or smoothed depending on the measurement error model.
The ordinary Kriging formula is generally given by:
*
1 1
1
n u n u
a a a
a a
Z u u Z u u m
where, *
Z u is the ordinary Kriging estimate at spatial location u , n u is the number of the data used at
the known locations, aZ u are the n measured data at locations au located close to u , m is mean of
distribution, a u weights for location au computed from the spatial covariance matrix.
Ordinary Kriging assumes a constant but unknown mean and estimates the mean value as a constant in the
searching neighbourhood (Kumar et al., 2007).
The variogram is the function which characterises the dependence of variables between two different
points in space. According to Çetin and Tülücü (1998), in contrast to classical statistical methods,
semivariogram models are interested in all data points whether regularly distributed or not with respect to both
time and location.
III. Materials and method
Konya is almost exactly in the middle of Turkey, it can be designated as a junction point where all
territories of the country are linked to each other. The city is not only the largest province of Turkey in the
context of territorial size but also has the longest road network, with a 2966 km state road in a country with a
total of just 62344 km of roads.
Traffic accident data
Accident records for ten years have been obtained from Konya Police Department and input into the
database using MS Access to set up the GIS-based application. To define junctions, digitisation and analyses
were performed using maps with a scale of 1/25 000.
Figure 1 shows 103 digitised junction points on the roads. In this process, besides all AC, dates, times, and
types of vehicle data were recorded in the main dataset. In this period, a total of 2662 accidents occurred; there
were 17 accidents with mortalities, 361 accidents with injuries, and 1903 accidents with only damage.
3. Risk governance for traffic accidents by Geostatistical Analyst methods
www.ijres.org 37 |
Figure 1: 103 junction points in the city centre.
IV. Methodology
First of all, the characteristics of all data must be evaluated. As mentioned above, in this phase all analyses
were carried out, including not only the number of total accidents, but also other AC separately. Table 1 shows
the histogram values for all AC, and Figure 2 shows a QQPlot graphic for AC4 as an example.
Figure 2: Example of a QQPlot graphic for AC4.
4. Risk governance for traffic accidents by Geostatistical Analyst methods
www.ijres.org 38 |
Table 1: Histogram values calculated by AC4.
AC Min Max Mean Std. Dev. Skewness Kurtosis 1st Quantile Median 3rd Quantile
AC1 0 1 0.029 0.1689 5.6 32.363 0 0 0
AC2 0 22 3.0485 3.4052 2.849 14.249 1 2 4
AC3 0 67 17 16.111 1.244 3.779 4.25 11 25.5
AC4 1 76 20.078 18.123 1.2805 3.9217 6.25 13 30.25
If the mean and median values are close, it can be said that the data have a normal distribution. A histogram
shows whether distributions of data are symmetrical or not. Symmetrical data can be realised with a skewness value
close to zero. According to the values in Table 1, our data are not normally distributed or exactly symmetrical.
Two effects may influence the results. One of them is the global trend and the other is anisotropy. When a study
is carried out on a two dimensional surface, sometimes the semivariogram and covariance functions must be
investigated not only according to distance but also according to direction. This is called anisotropy. Anisotropy is
determined by random errors, and it is different from a global trend.
In addition, unlike the circular isotropic model, an ellipse must be chosen in the searching neighbourhood to
determine the neighbourhood number and location. In interpolation, the major axis must have the same direction as
the anisotropic direction. This is taken into consideration in the calculation of the values in Table 2.
According to Ahmadi and Sedghamiz (2007), the ratio of nugget to sill can indicate statistical autocorrelation. If
the value is smaller than 0.25, there is strong autocorrelation; if the value is between 0.25 and 0.75 there is moderate
spatial autocorrelation; otherwise there is no spatial autocorrelation. Table 2 shows all geostatistical values constituted
with all AC. All values which are important to show AC and to plan for the future are in shown the table. To carry out
mapping with the help of the Table2, the rules must first be considered primarily as below.
The best map can be produced with the trial and error method by changing parameters. Transformations are not
applied but there is anisotropy.
Finally, before the mapping, the performance of values can be controlled by cross validation. Cross validation
investigates which model has the best performance.
Figure 3 shows prediction maps with the numbers of (a) mortalities, (b) injured persons, (c) accidents with
damage only, and (d) total accidents. Representations of maps illustrated using Equal Area techniques have generally
been used for probability maps to clarify extreme values so far. Therefore, all maps are produced using this method.
Furthermore, probability maps can be produced in respect of threshold values that are exceeded or not exceeded.
A related example is shown in Figure 3 (e) where the number is 10, which is the below the mean value for the total
number of accidents.
The indicator prediction value shows the probability of exceeding a threshold value. The most important maps to
interpret to prevent traffic accidents are of this type. Figure 3(f) was produced using covariance values. These maps
illustrate the probability of exceeding 10.
Table 2: All calculated statistical values necessary for interpretations.
Accident criteria
Statistical values
Mortality Number
(AC1)
Injured Number
(AC2)
Accident with
damage (AC3)
Total Number
(AC4)
Trend Arcsin. - - Log
Anisotropy
Major range 20097.4 23584.3 927.791 958.977
Minor range 7538.64 8943.27 200.871 207.655
Nugget 0.017025 5.5656 0 0
Sill 0.017687 8.3892 347.7 310.86
Nugget sill ratio 0.96 0.66 0 0
Ordinary kriging results
Mean 0.001294 0.1055 -0.4731 -0.3556
Root-Mean-Square 0.179 3.926 16.7 18.95
Average Standard Error 0.1458 2.658 16.13 18.1
Mean Standardized 0.01359 0.02456 -0.02577 -0.0153
Root-Mean-Square
Standardized
1.209 1.345 1.026 1.032
For the correct interpretation of the values shown in the table, the following rules must be taken into
consideration.
5. Risk governance for traffic accidents by Geostatistical Analyst methods
www.ijres.org 39 |
(a) (b) (c)
(d) (e) (f)
Figure 3: Result maps: (a) prediction map for number of mortalities, (b) prediction map for number of injured
persons, (c) prediction map for number of accidents with damage only, (d) prediction map for total number of
accidents, (e) probability map with no more than 10 accidents, (f) probability map using cross validation results.
V. Conclusions and future work
Deterministic and geostatistical methods are examined with two groups in GA. These methods are
basically similar as data for nearby points are close.
On the other hand, when the mathematical and statistical methods are used together, geostatistical methods
are not only used as interpolation methods but also give an opportunity for interpretation. The method also gives
6. Risk governance for traffic accidents by Geostatistical Analyst methods
www.ijres.org 40 |
information about the reliability of predicted values. Therefore, deterministic applications were not performed in
this study. This study has tried to understand the characteristics of traffic accidents. Nevertheless, in order to
generalise, similar tests must be applied for more areas.
The study gives different results from others concerning GA applications for traffic accidents in the
literature. In addition, it differs from other studies in that it uses not only the number of total accidents but also
different traffic accident criteria.
According to the resulting values, accident data are not exactly normally distributed or symmetrical. This
shows that the frequency and intensity of accidents are out of order, and some junctions are problematic.
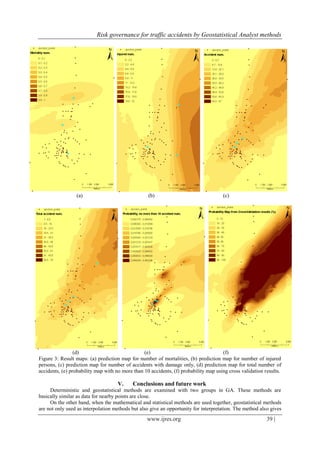
When the QQPlot graphic is considered with all outlier AC values, there are problematic junctions: three
junctions (6, 20, 71) arising from AC1, three junctions (25, 38, 52) arising from AC2, three junctions (30, 49,
51) arising from AC3, and four junctions (25, 30, 50, 51) arising from AC4. These problematic junctions are
shown in light colour in Figures 3(a), (b), (c), and (d) separately.
Three junctions (30, 49, 51) which meet four criteria, of a total of nine problematic junctions, must be
improved urgently.
When the trend graphic is observed, global trends are seen for all AC.
In the Semivariogram/Covariance Cloud, most of the data are clustered in the first part of the variogram.
This distribution shows that the numbers of accidents are correlated with each other, and there are no, or less,
location influences.
Anisotropy was proved for all AC in the study as on weather pollution maps. There are anisotropies for all
AC except AC1. The reason is that this is the biggest artery lying in a northeast to southwest direction. The most
straight and longest north artery with high traffic speed triggering the all AC. Precautions about reducing the
speed must be put on the agenda urgently.
As a result, in the light of calculated values, result maps were produced with the aim of helping to create
new city models. Maps which have statistical value and can be visualised will be a better help to city planners.
References
[1.] Ahmadi, S.H., Sedghamiz, A., 2007. Geostatistical analysis of spatial and temporal variations of groundwater level, Environ
Monit Assess 129, pp:277-294
[2.] Boogaart, K.G., van der, Schaeben, H., 2002. Kriging of regionalized directions, axes and orientations I. Directions and axes,
Mathematical Geology, Vol. 34, No. 5, 479-503
[3.] Cho, W.K.T., 2003. Contagion effects and ethnic contribution Networks. American journal of political science. 47 (2) pp.368-
387
[4.] Gu, X., Sun, G., Li, G., Huang, X., Li, Y., Li, Q. 2013. Multiobjective optimization design for vehicle occupant restraint system
under frontal impact. Structural & Multidisciplinary Optimization. 47-3, p465-477.
[5.] Gundogdu, I.B., 2010. Traffic management in Konya by Junction Risk Factor. Municipal Engineer. 163, pp:99-105.
[6.] Hansen, D., Lauritsen, J M., 2010. Identification of black spots for traffic injury in road intersections dependence of injury
definition. Injury Prevention Vol. 16, pp:261-267
[7.] Hill, L., Rybar, J., Baird, S., Concha-Garcia, S., Coimbra, R., Patrick, K. 2011. Road safe seniors: Screening for age-related
driving disorders in inpatient and outpatient settings. Journal of Safety Research.42-3, pp165-169.
[8.] Kumar, A., Maroju, S., and Bhat, A., 2007., Application of ArcGis geostatistical analyst for interpolating environmental data
from observations. Wiley Interscience DOI 10.1002/eg. 10223
[9.] Laguardia, G., 2011 Representing the precipitation regime by means of Fourier series. International Journal of Climatology. 31-
9, p1398-1407
[10.] Pan, F., Zhu, P., 2011. Design optimisation of vehicle roof structures: benefits of using multiple surrogates. International Journal
of Crashworthiness, 16-1, pp85-95.
[11.] Pearce, JL; Rathbun, SL; Aguilar-Villalobos, M; Naeher, LP. 2009 Characterizing the spatiotemporal variability of PM2.5 in
Cusco, Peru using kriging with external drift Atmospheric Environment, 43; 12; p2060-p2069
[12.] Prasannakumar ,V., Vijith, H., Charutha, R., Geetha, N. 2011. Spatio-Temporal Clustering of Road Accidents: GIS Based
Analysis and Assessment In International Conference: Spatial Thinking and Geographic Information Sciences 2011, Procedia -
Social and Behavioral Sciences. 21:317-325
[13.] Seto, E.Y.W., Holt, A., Rivard, T., Bhatia, R., 2007. Spatial distribution of traffic induced nnoise exposures in a US city: an
analytical tool for assessing the health impacts of urban planning decisions. International Journal of Health Geographics. 6:24.
[14.] Stathopoulos, A., Dimitriou, L., 2008. Fuzzy modelling approach for combined forecasting of urban traffic flow. Computer-
Aided Civil and Infrastructure Engineering. 23, 521-535.
[15.] Trangmar, B.B., Yost, R.J., and Wehara, G., 1985. Application of geostatistics to spatial studies of soil properties. Advances in
Argonomy, Vol 38, 65-91
[16.] Wamsler, C., 2006. Main streaming risk reduction in urban planning and housing: a challenge for international aid organisations.
Blackwell Publishing. USA.
[17.] World report on road traffic injury prevention: summary, http://www.who.int/world-health-day/2004/infomaterials/world
report/en/summary _en_rev.pdf.
[18.] Yu, R., Abdel-Aty, M. 2013. Investigating the different characteristics of weekday and weekend crashes. Journal of Safety
Research. Vol. 46, pp91-97