Download to read offline


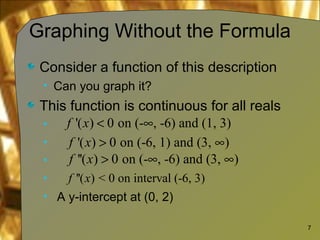

This document provides guidance on curve sketching functions by hand without using a graphing calculator. It outlines the key steps and tools needed for curve sketching, including determining the domain, finding intercepts and critical points, checking for asymptotes, analyzing the first and second derivatives to determine concavity and monotonicity, and connecting the points to sketch the curve. The document also provides examples to demonstrate how to apply these techniques to sketch curves based on information about the function's behavior.