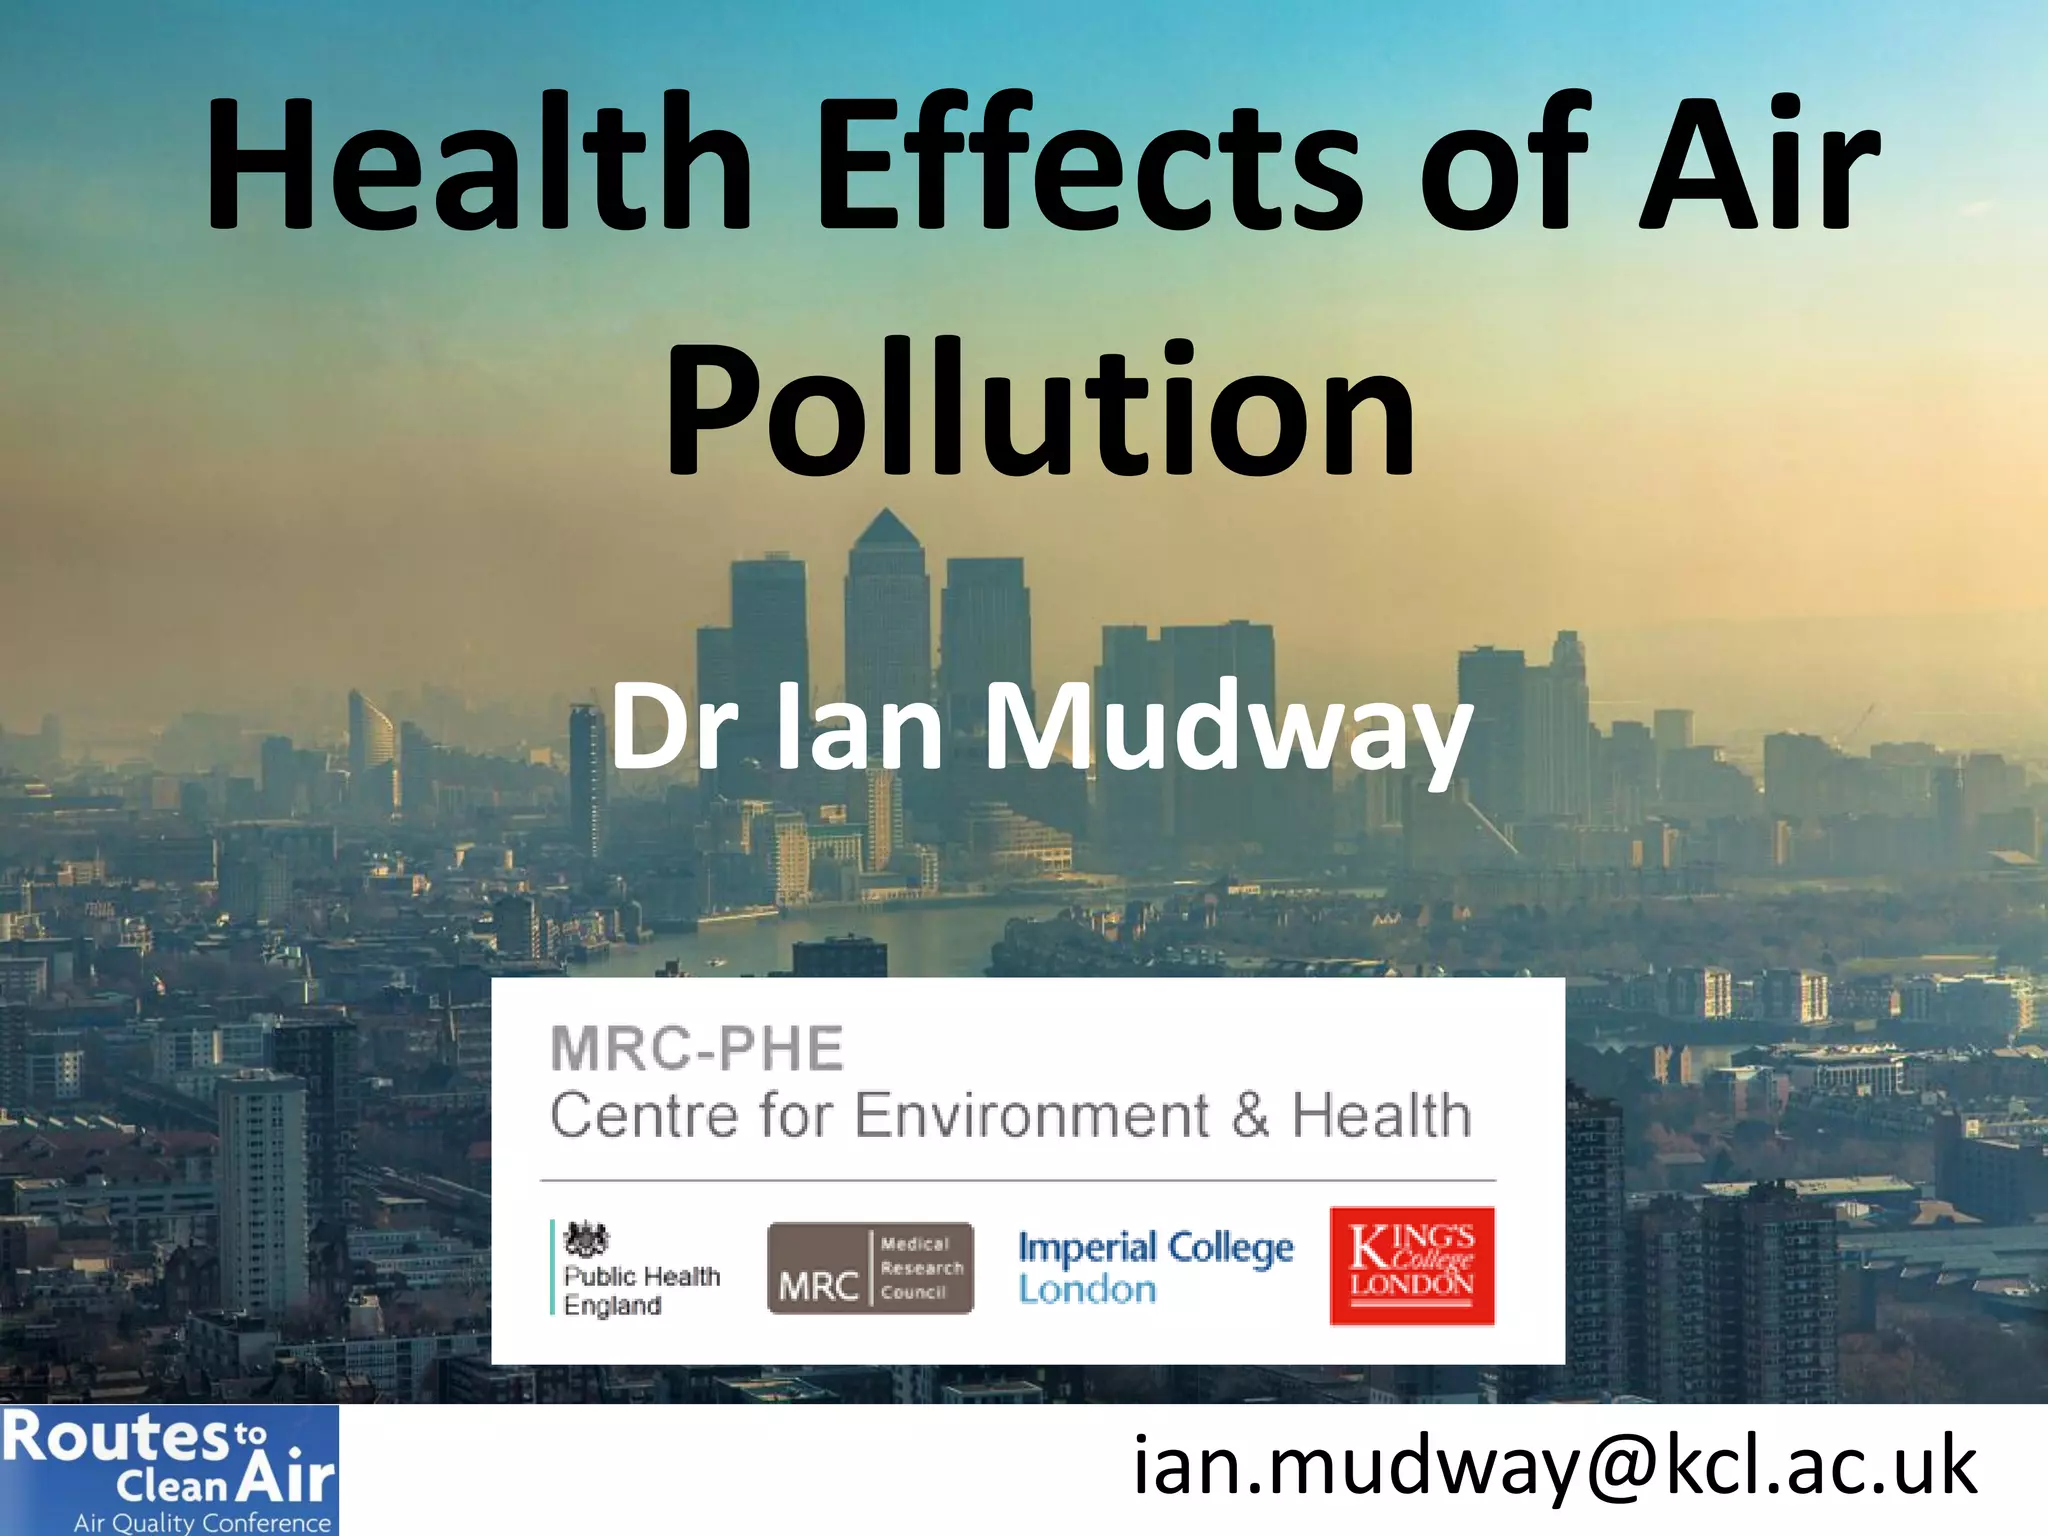
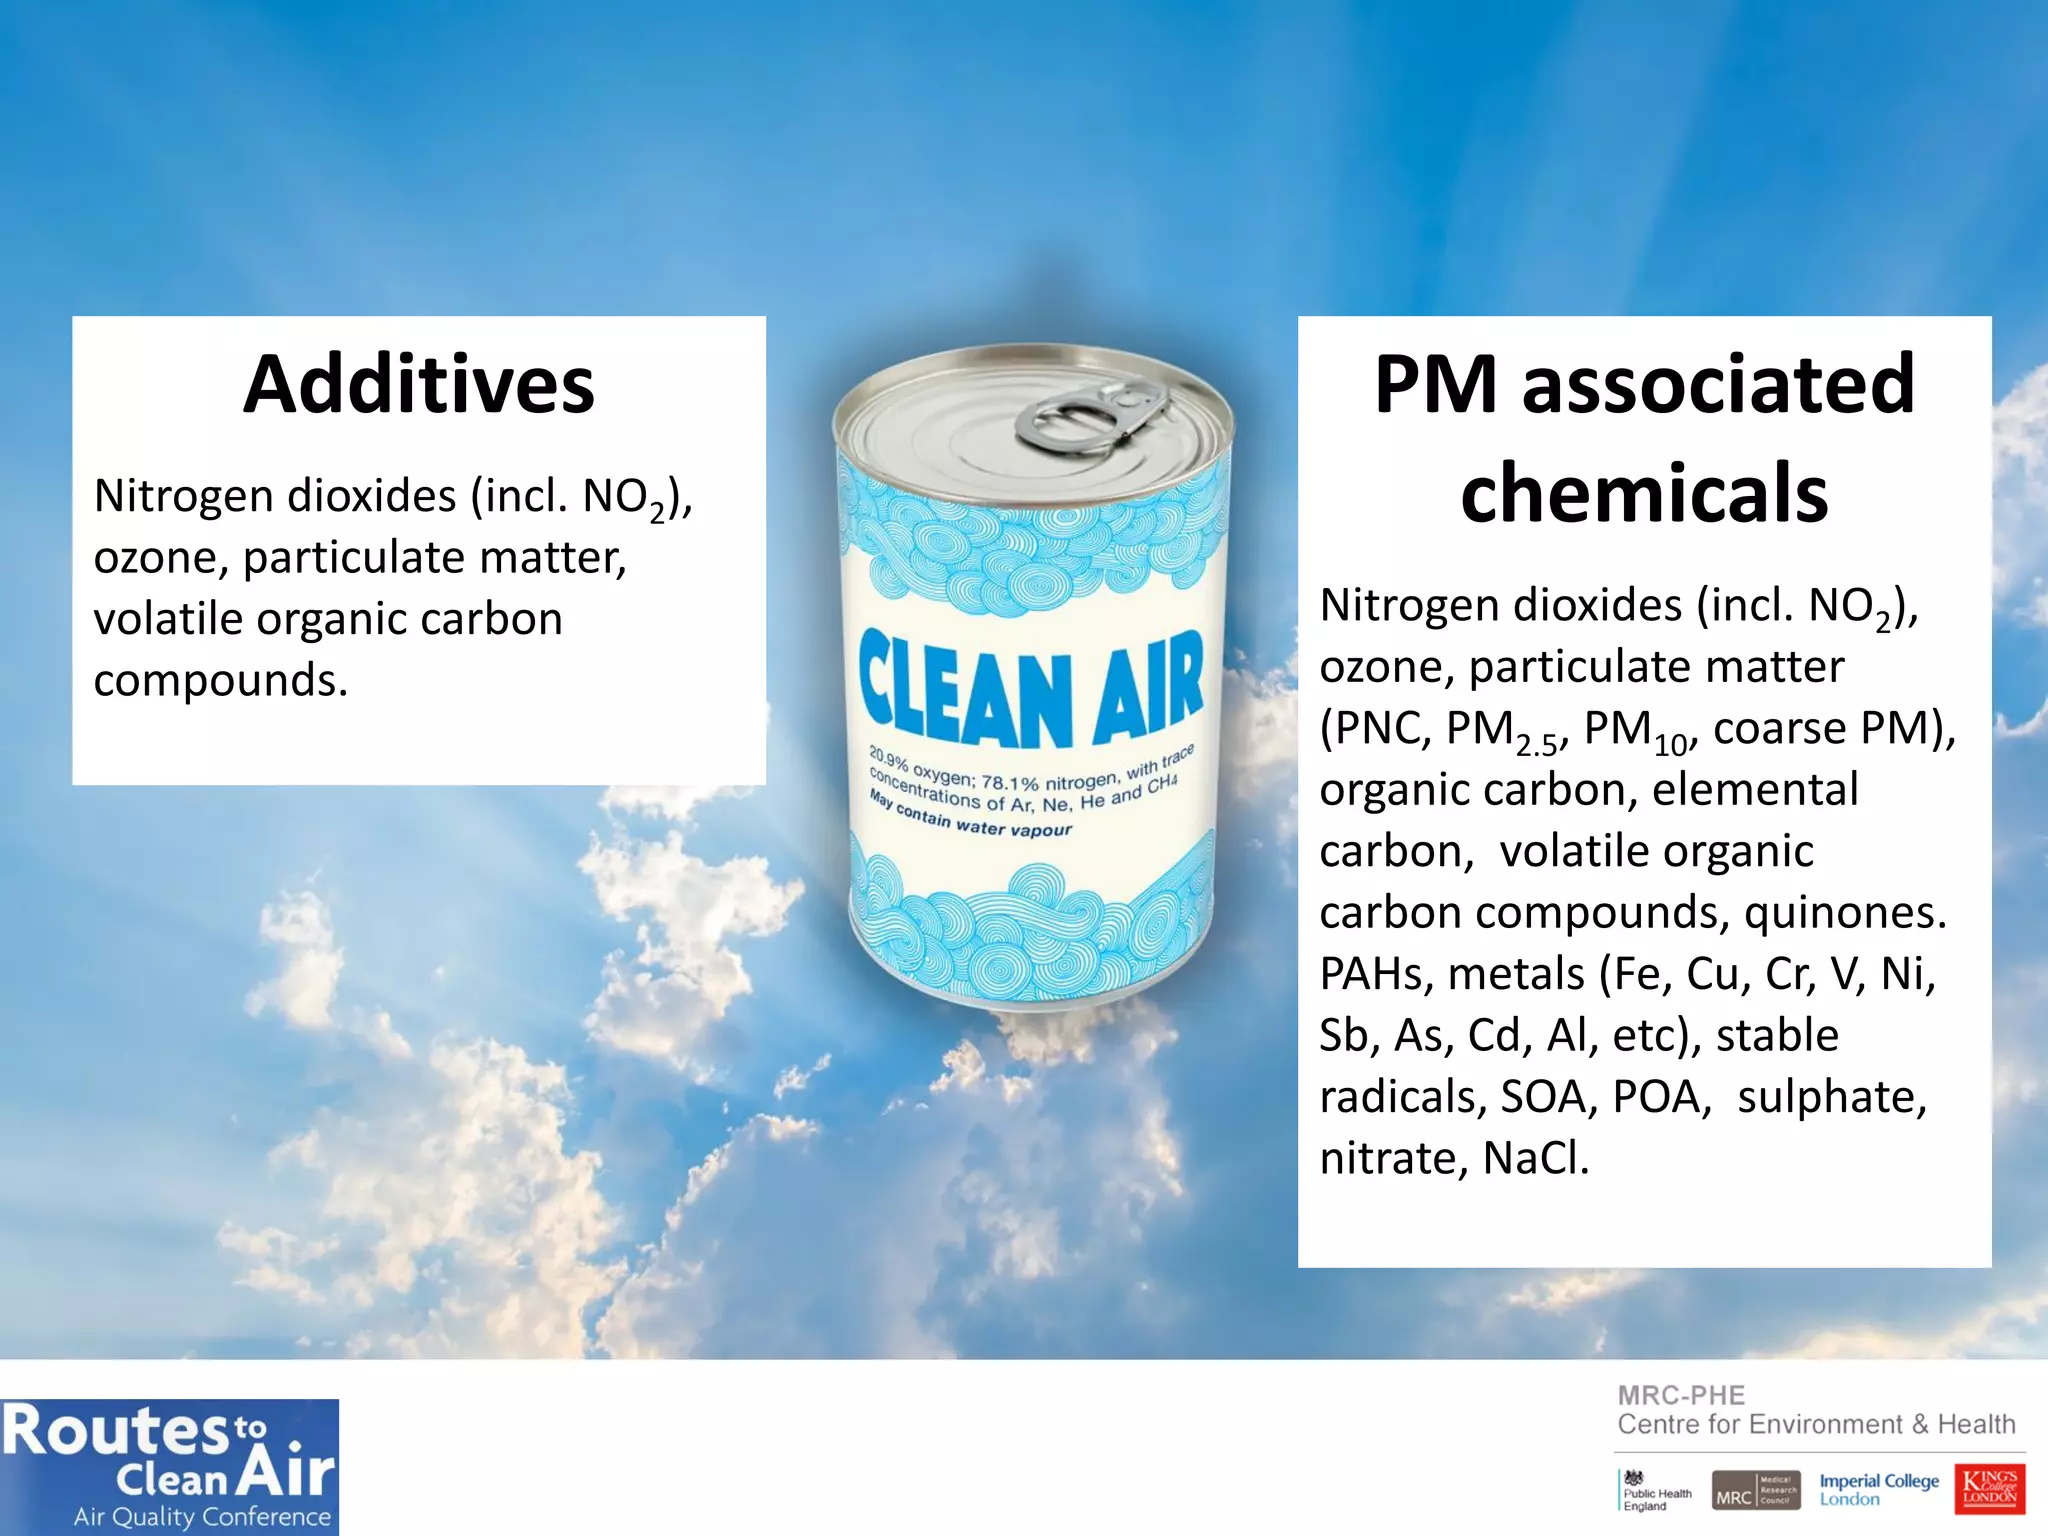
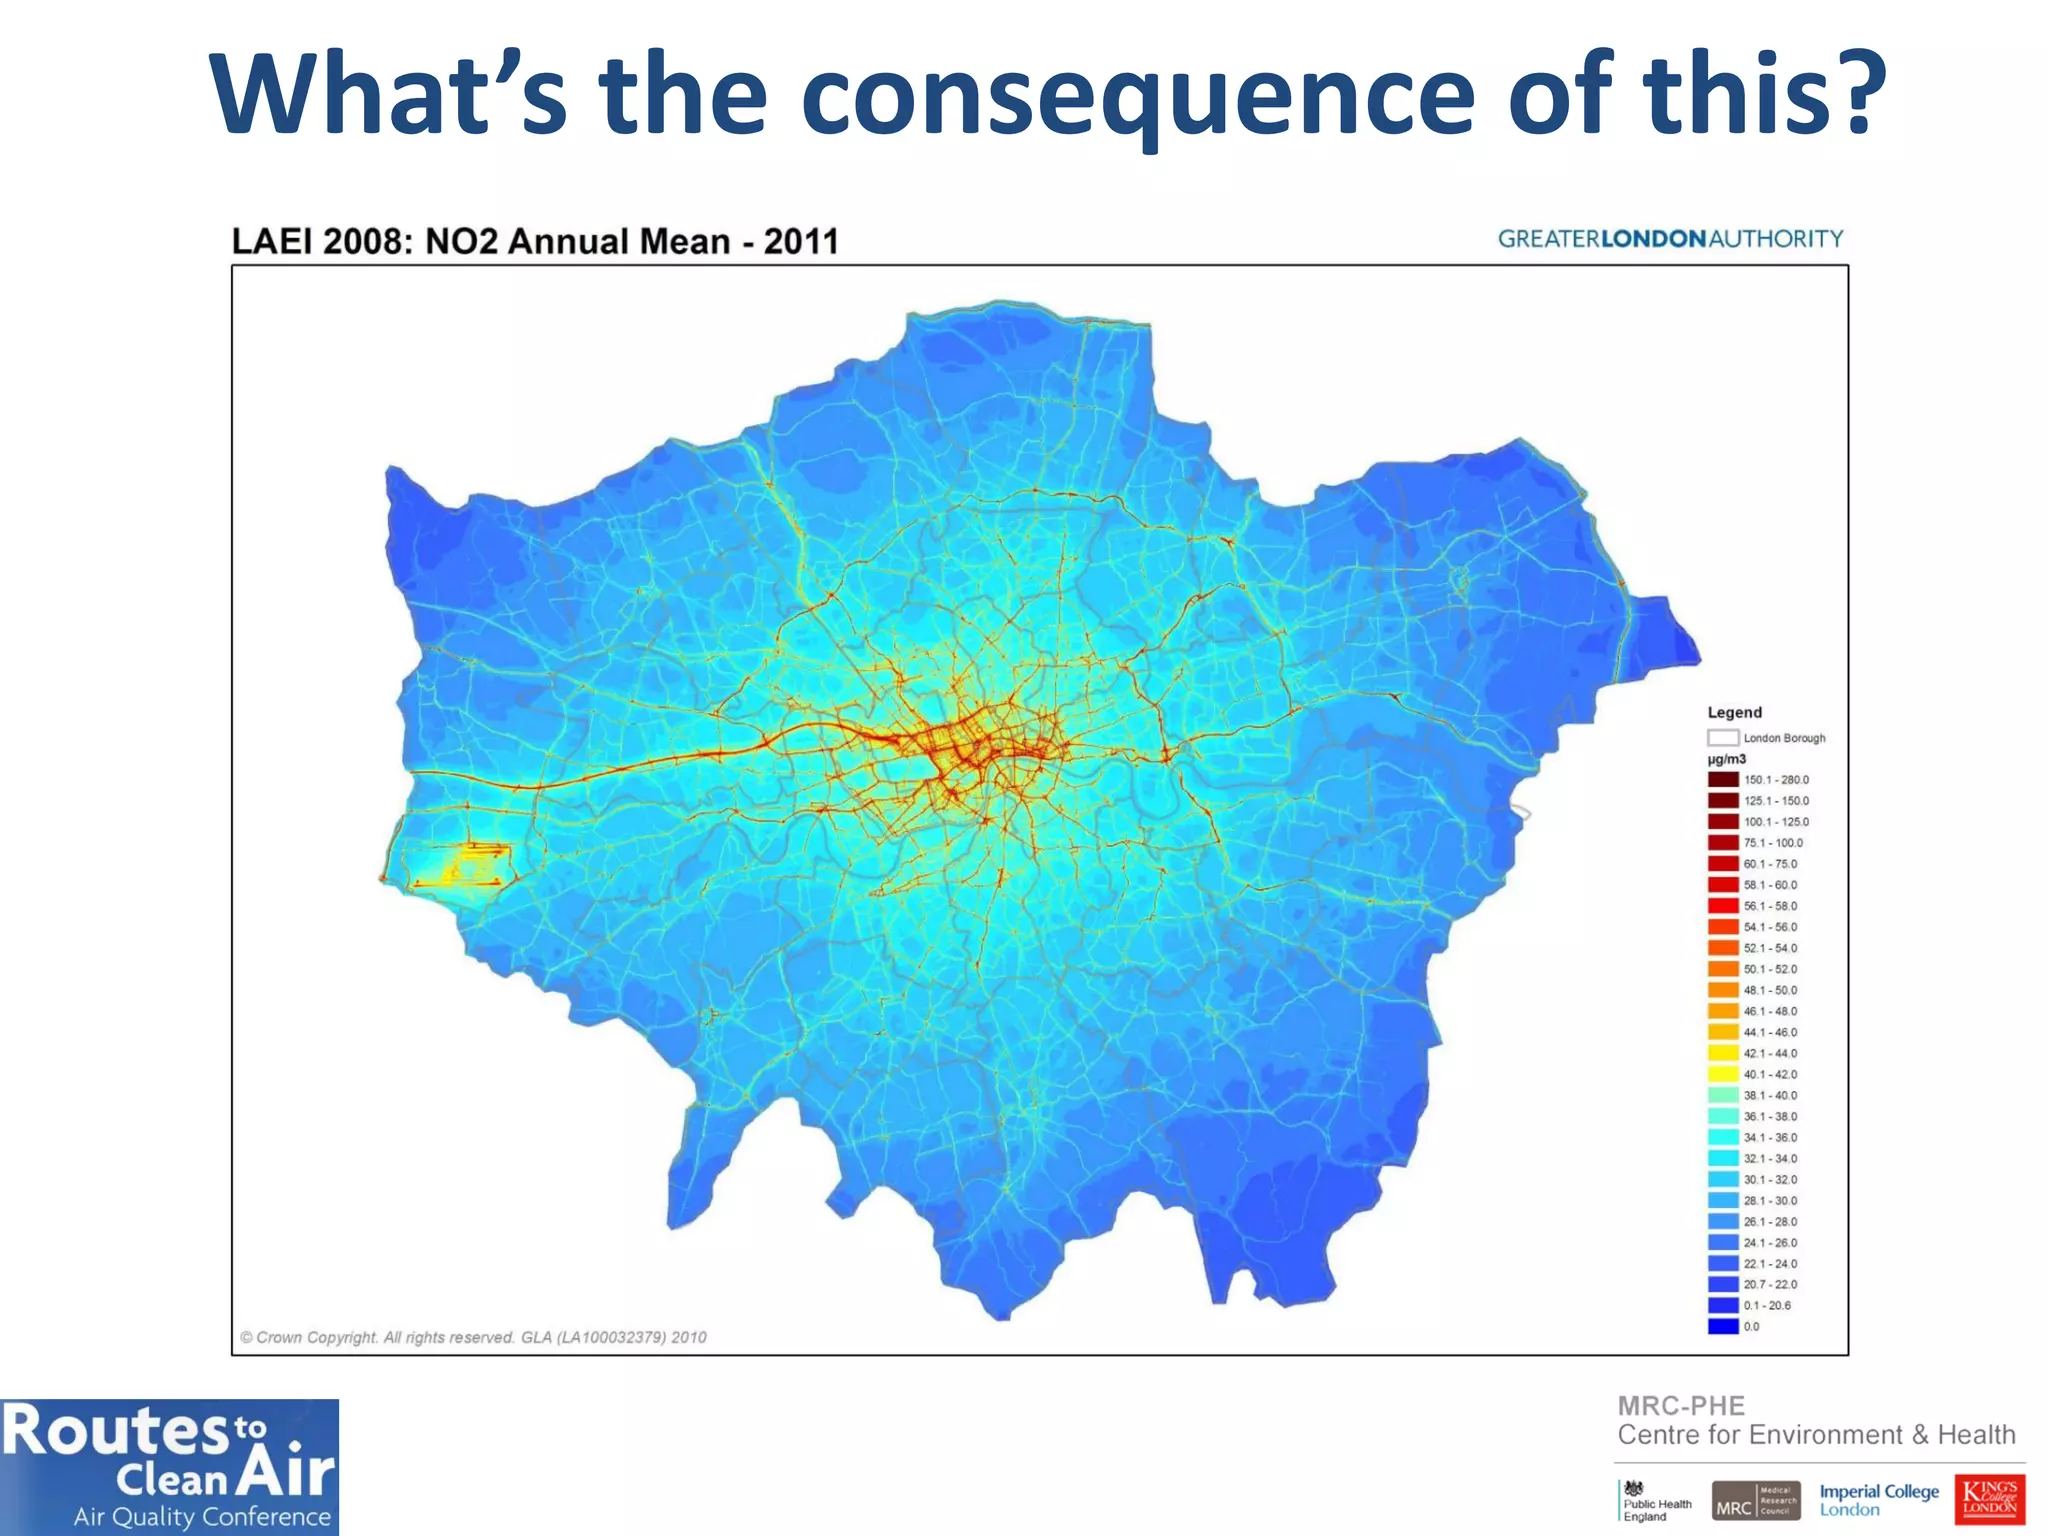
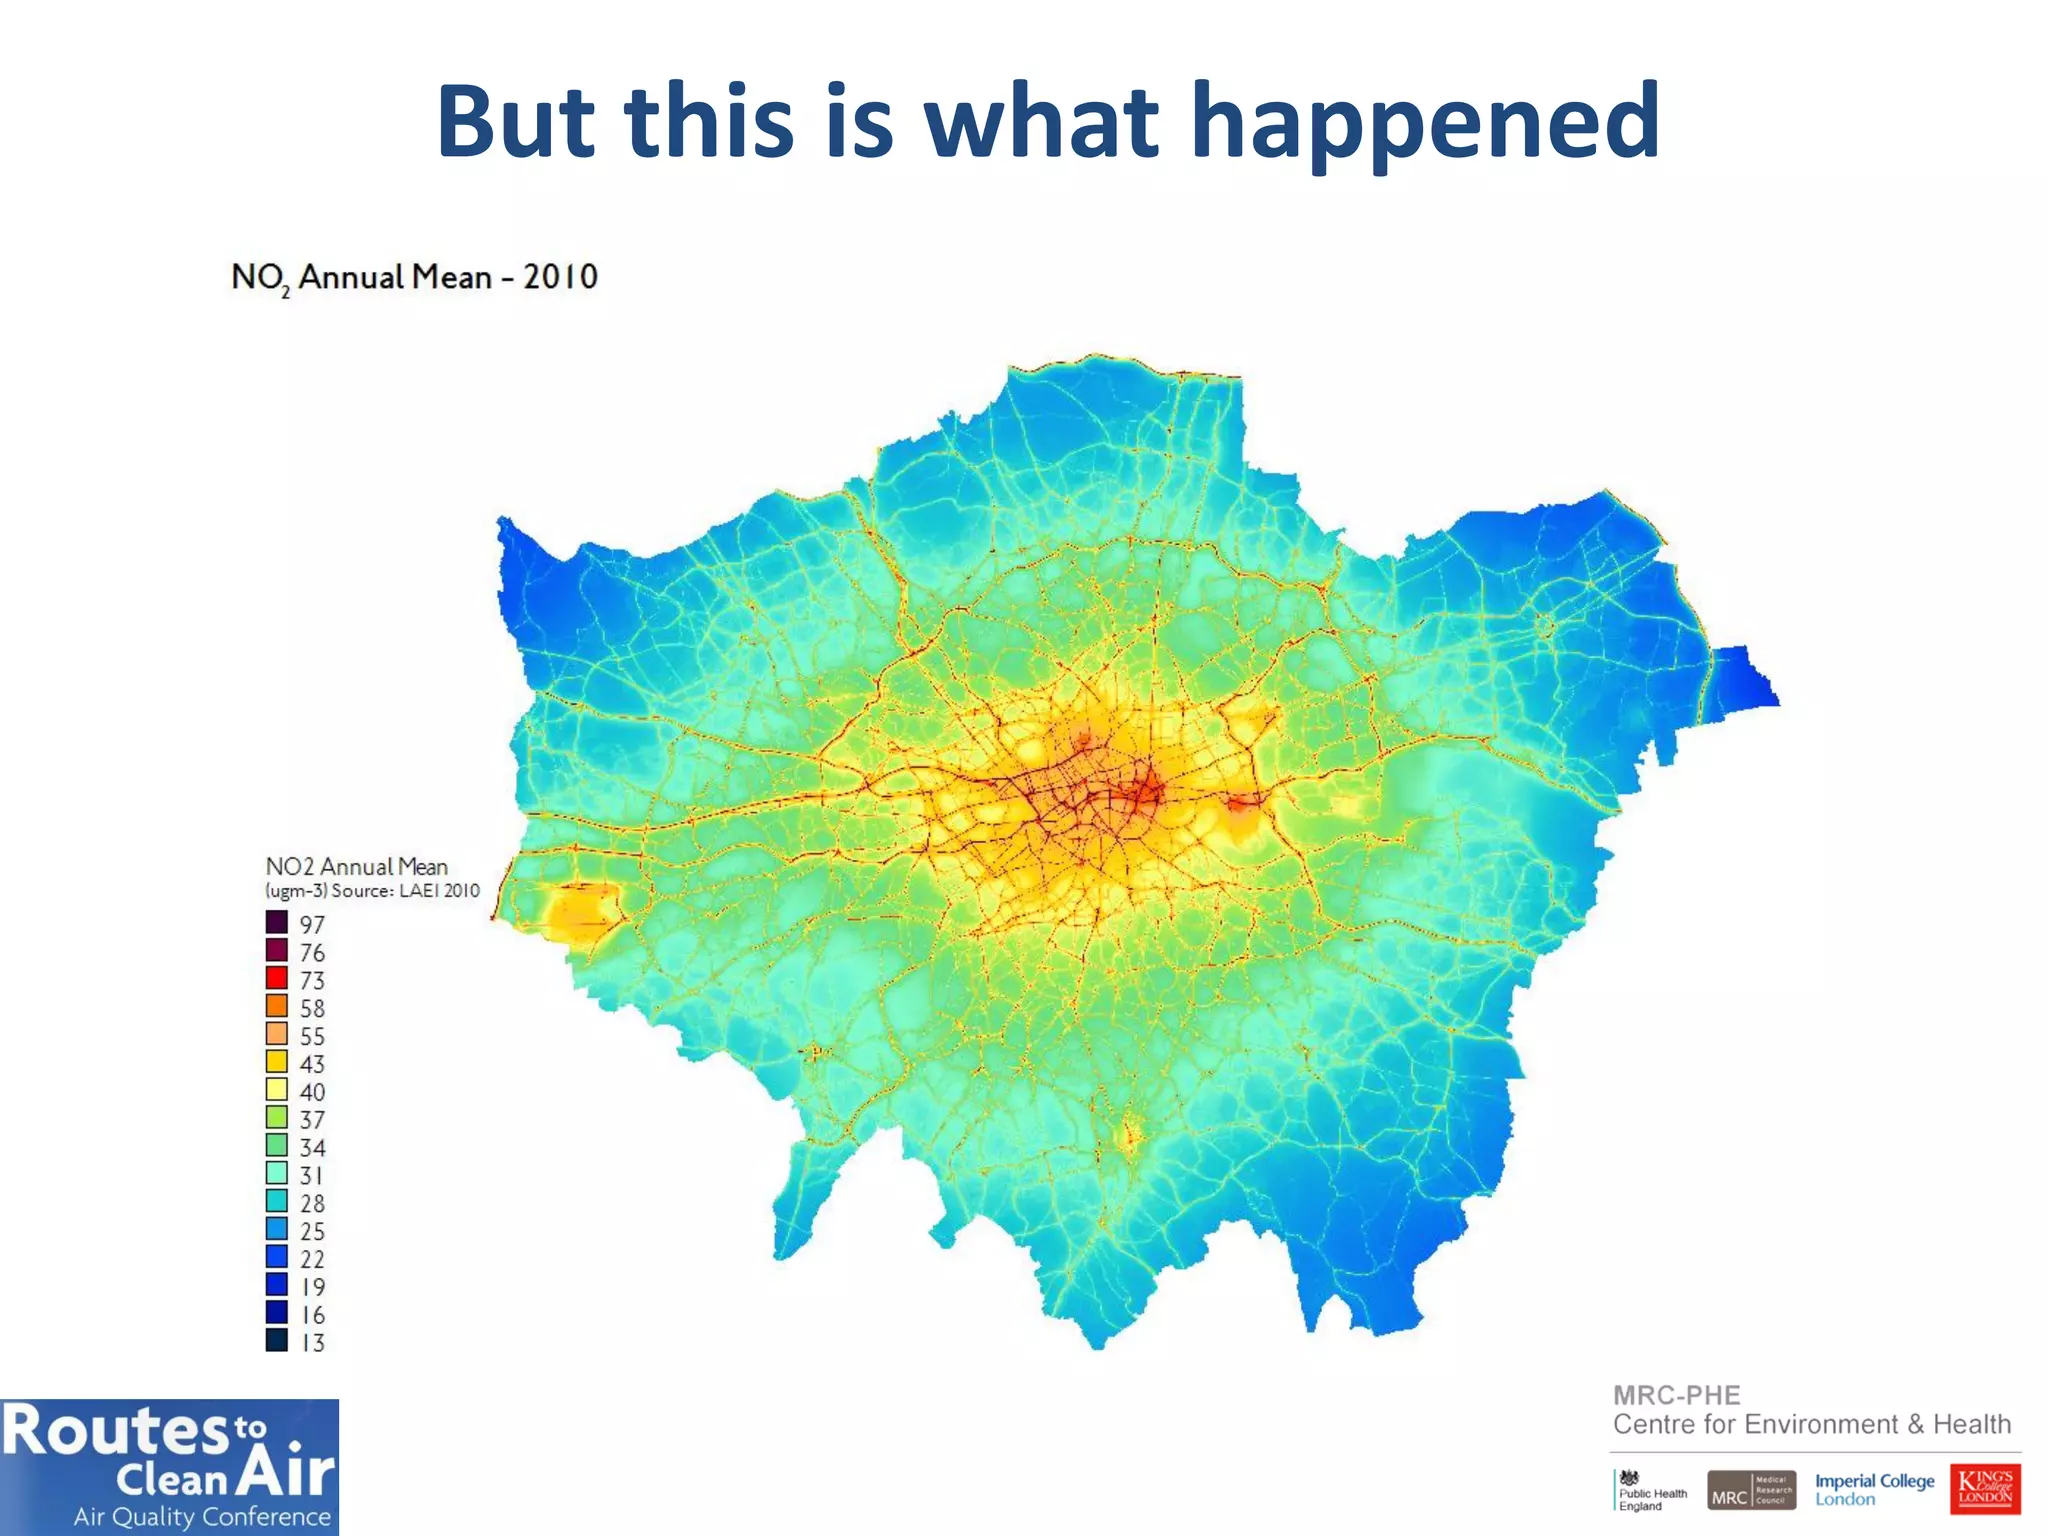
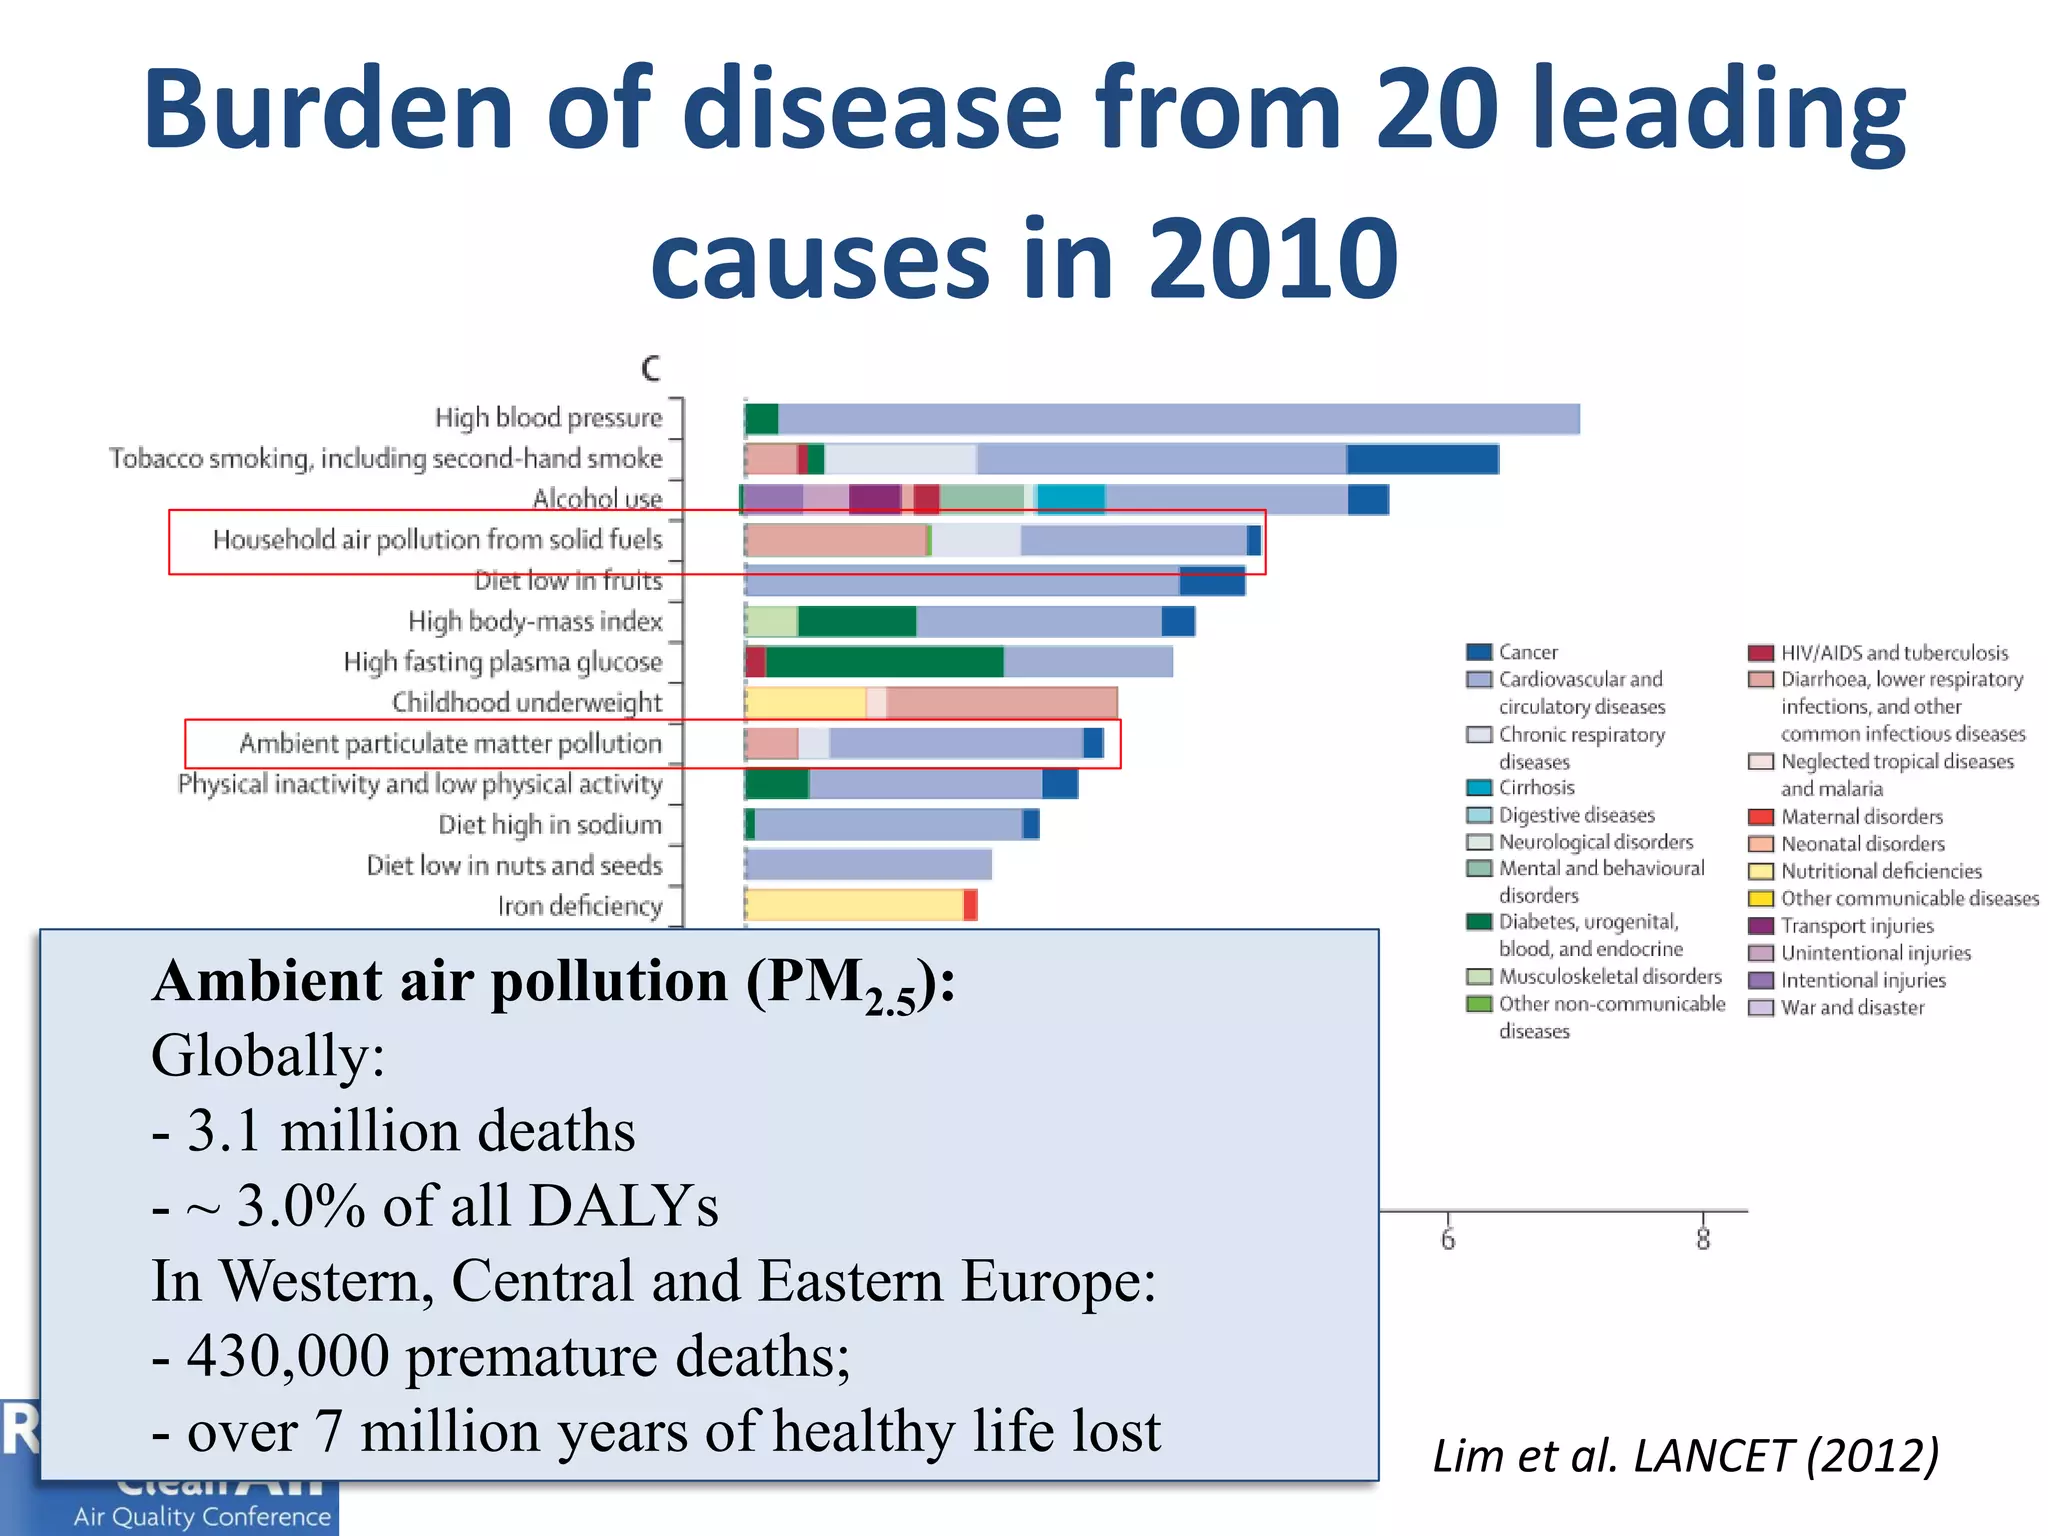
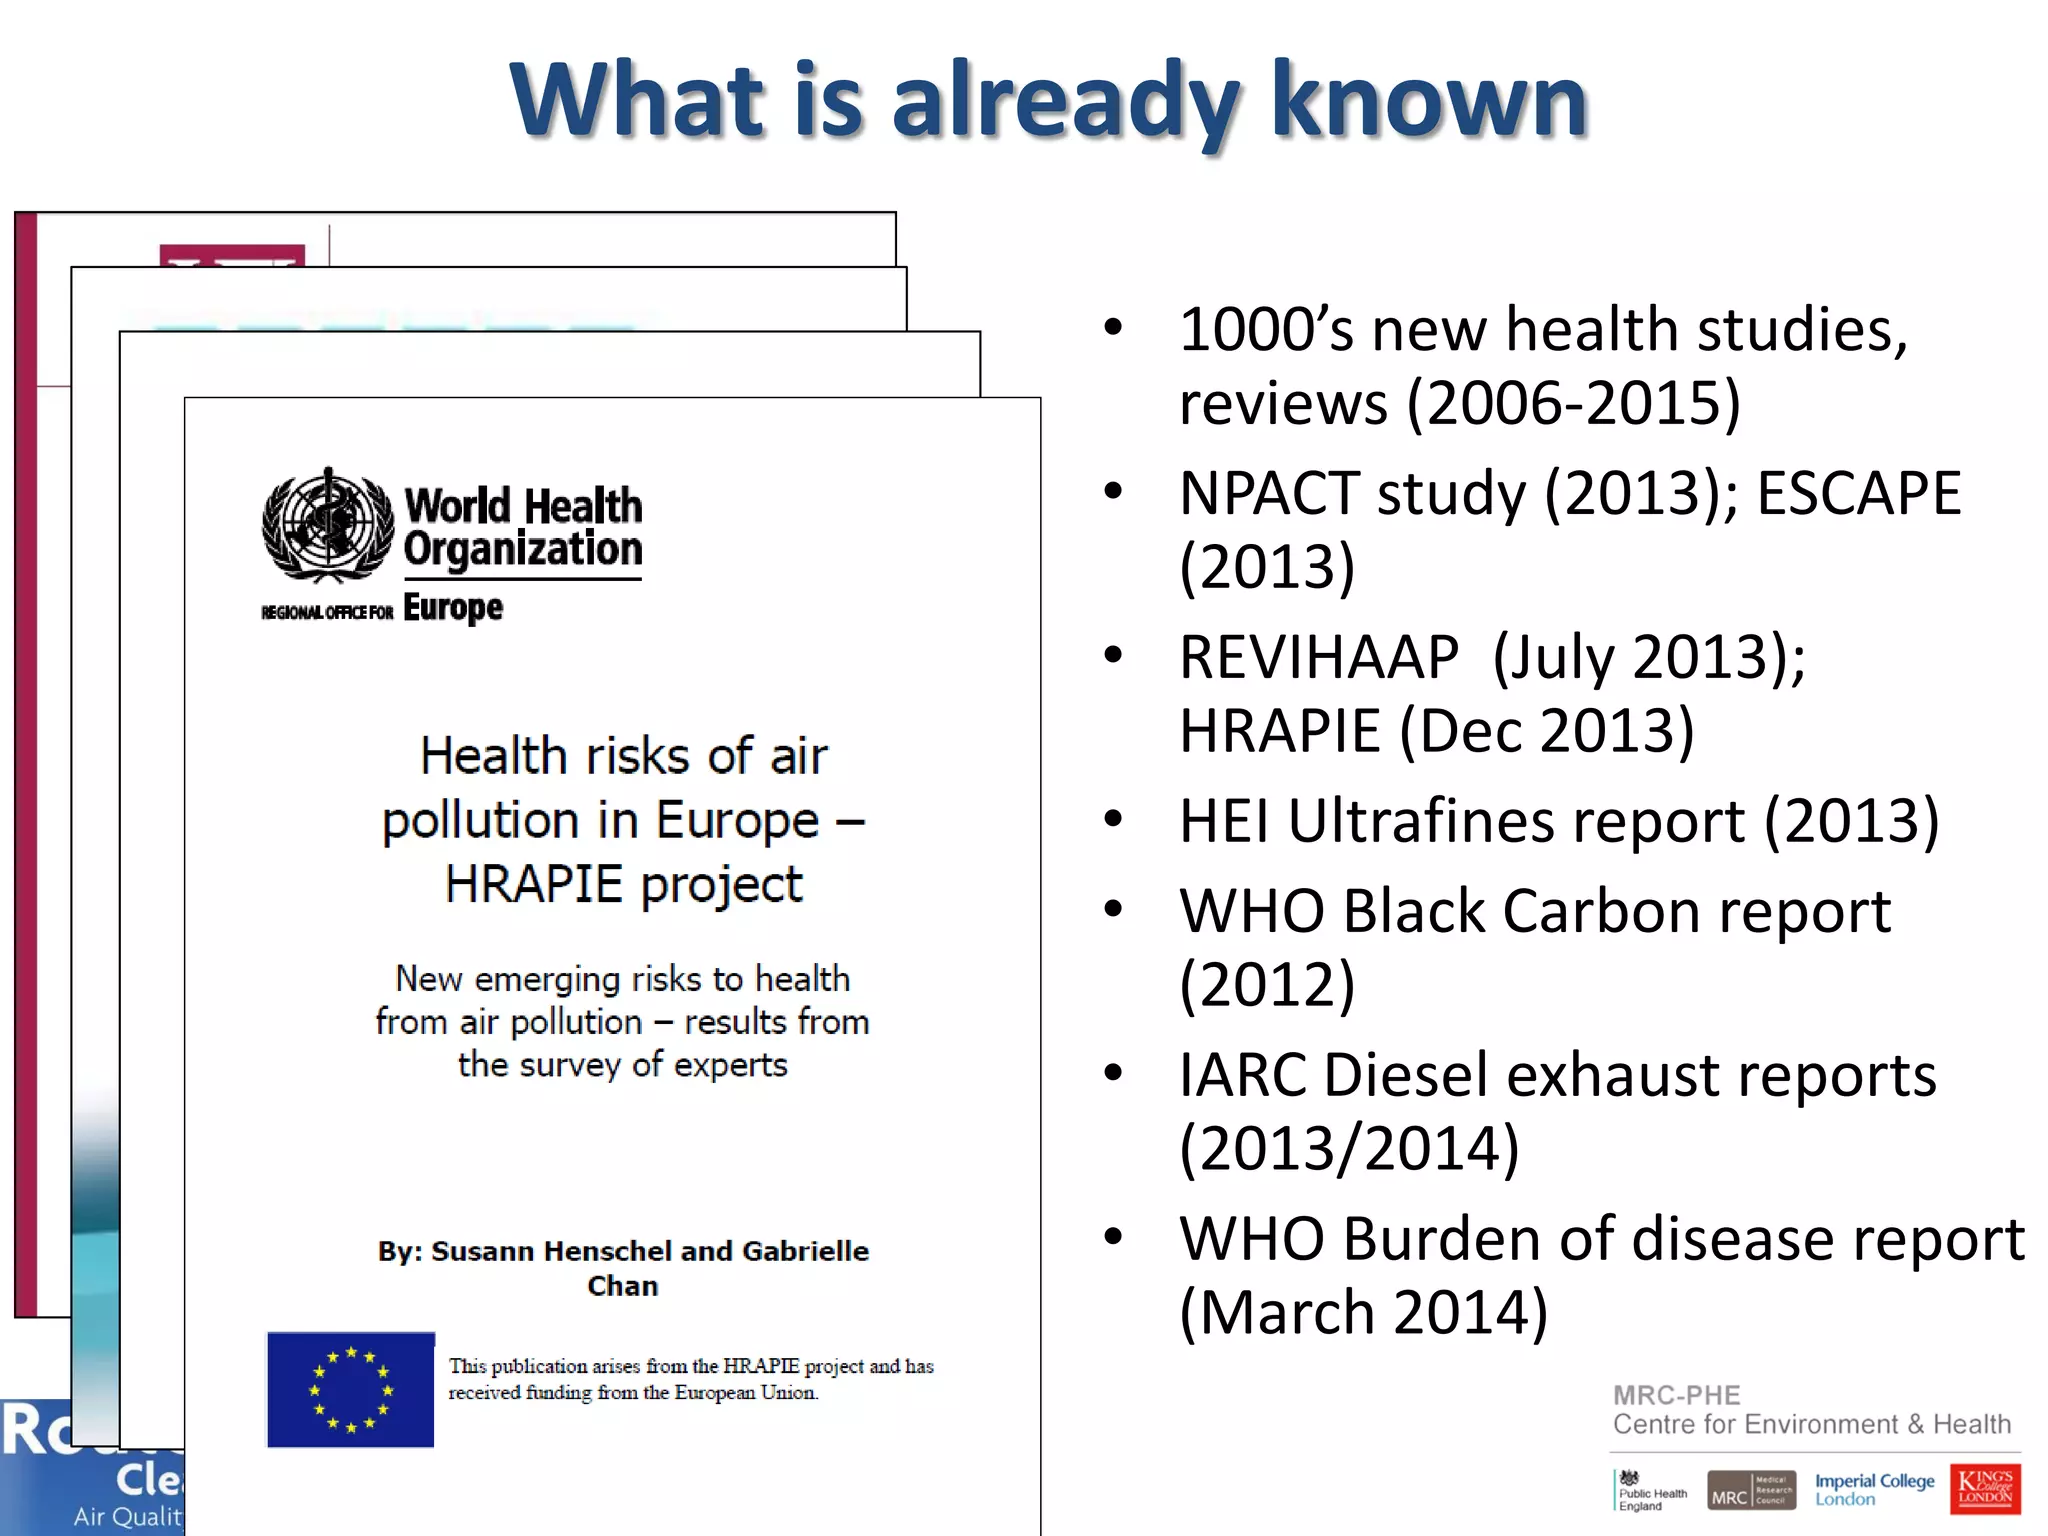
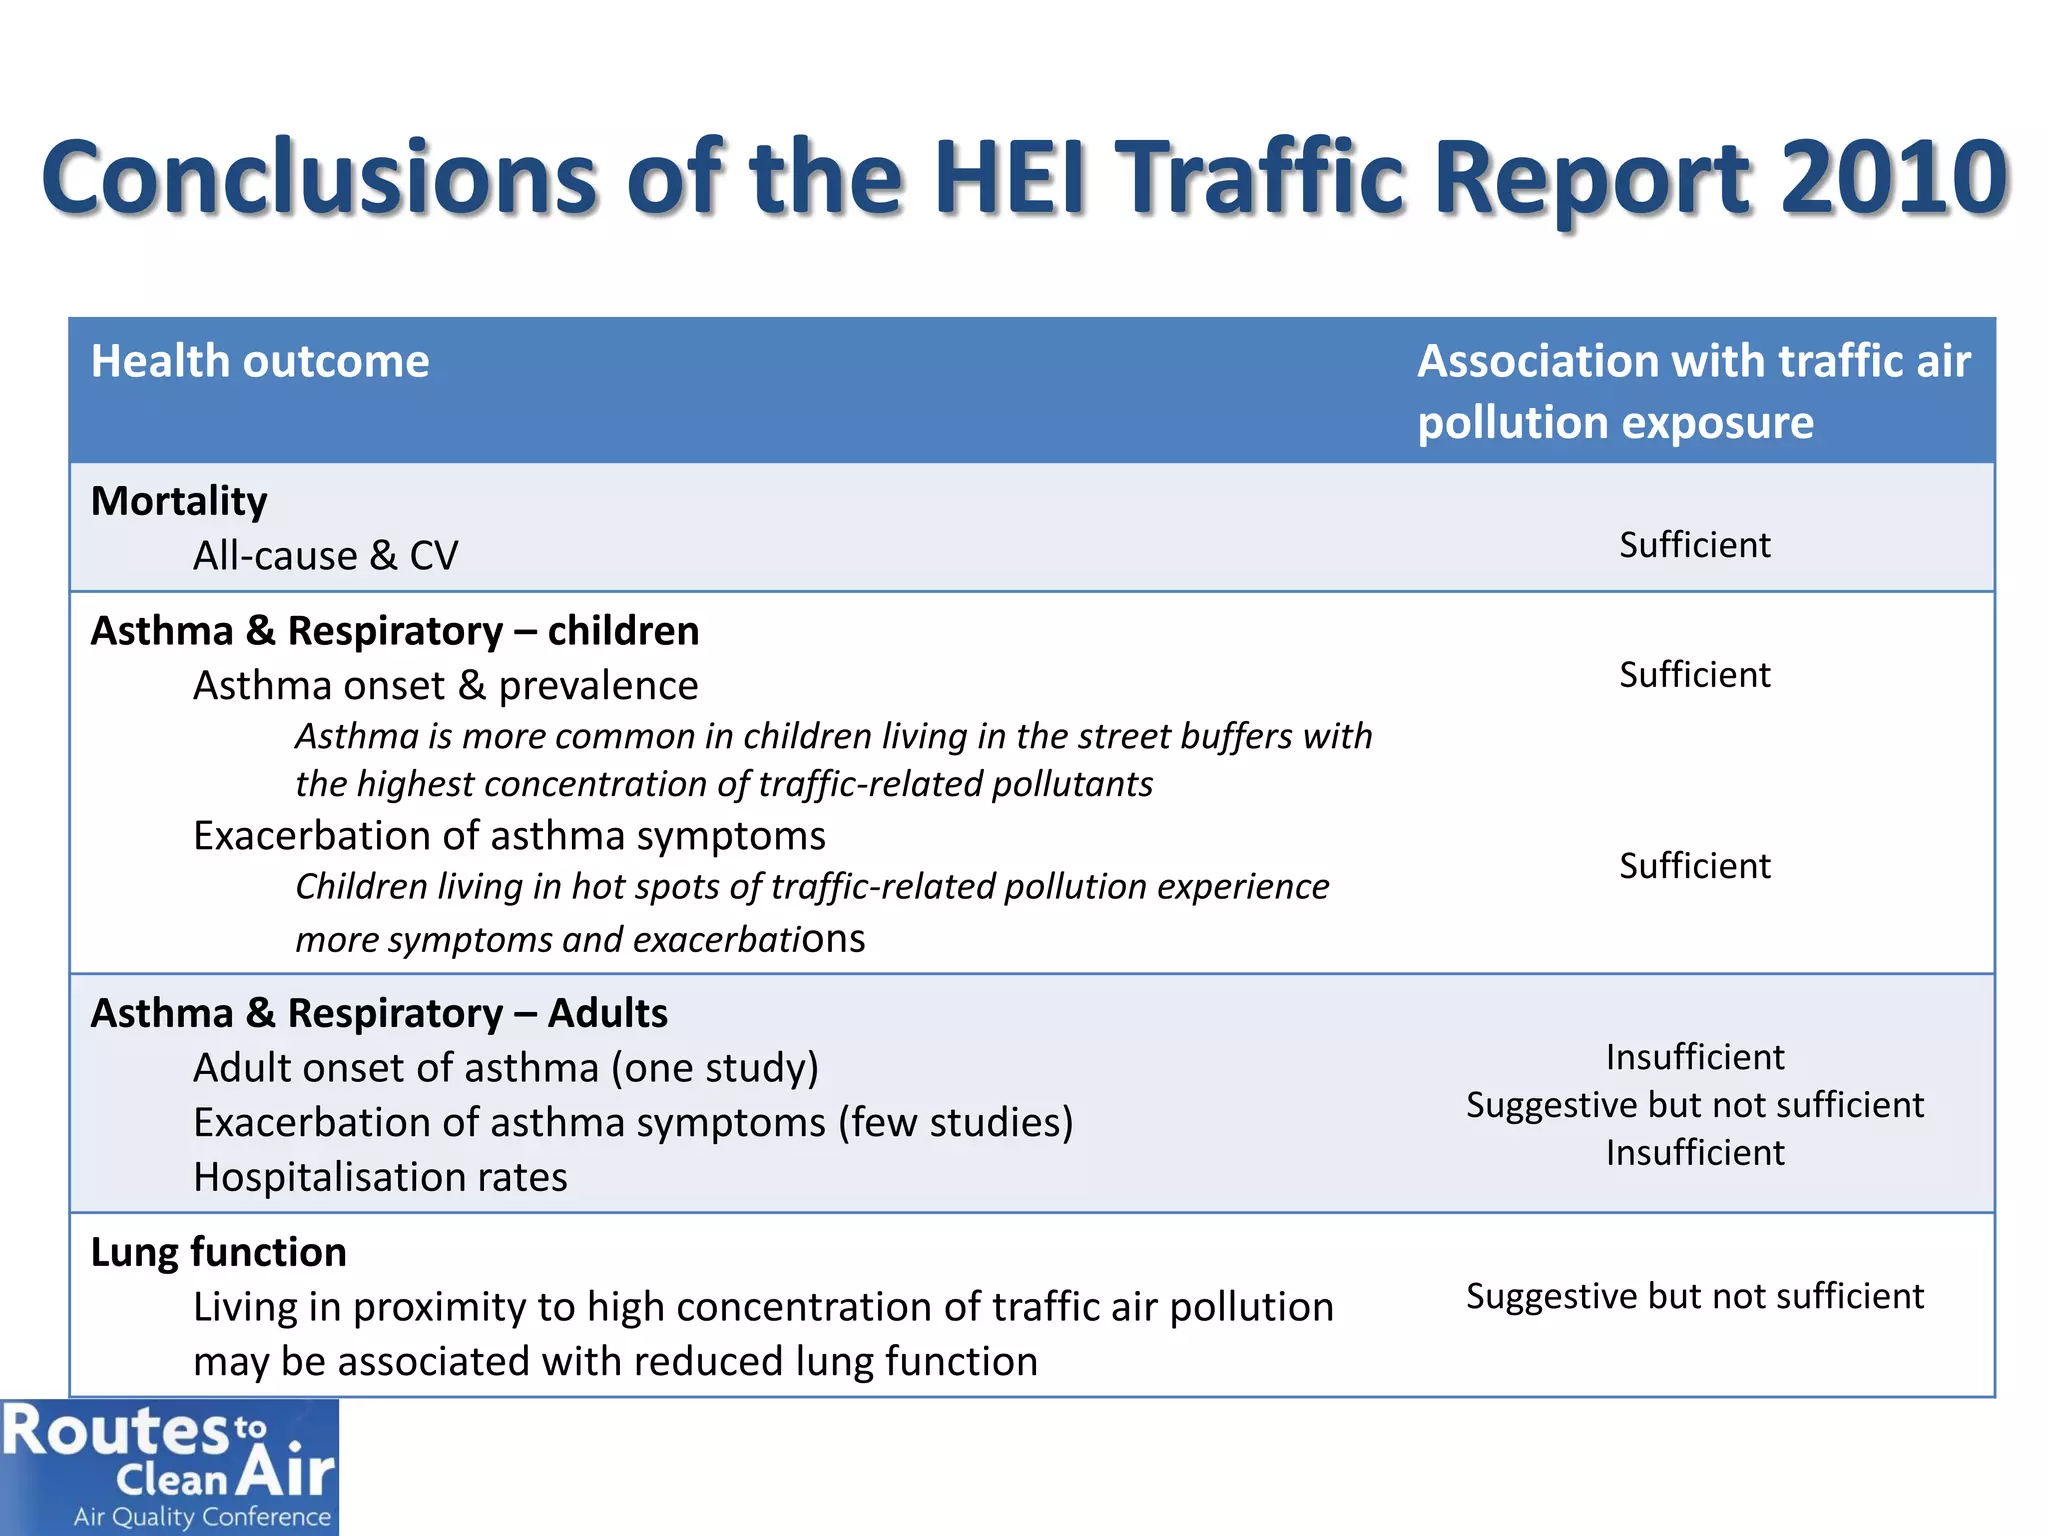
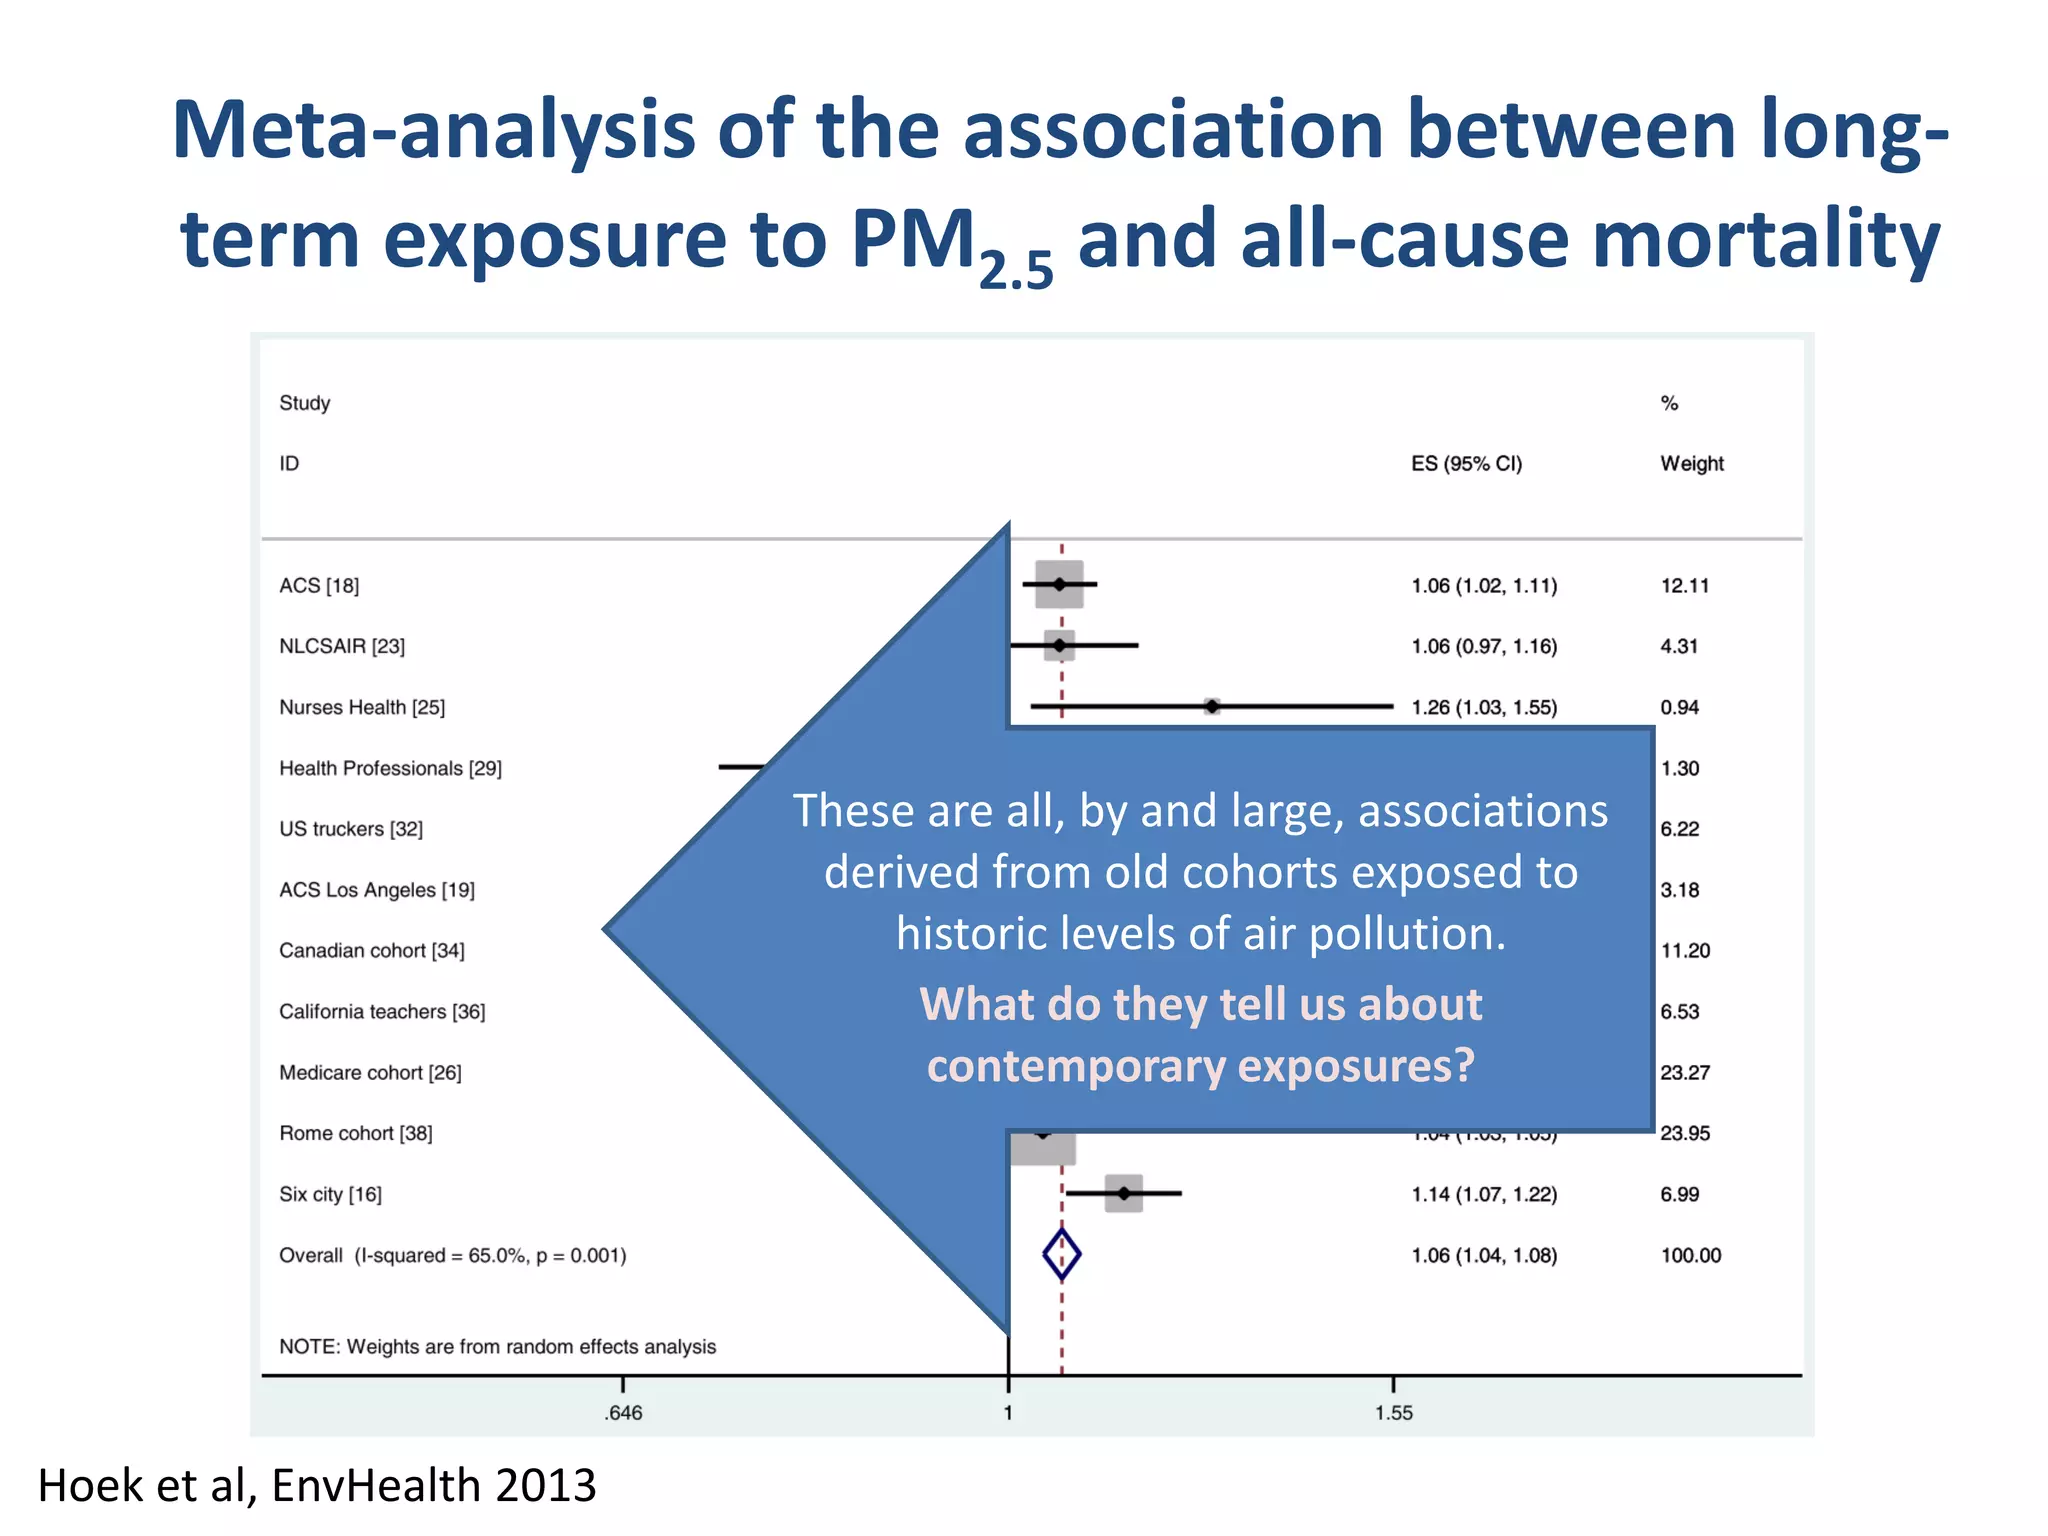
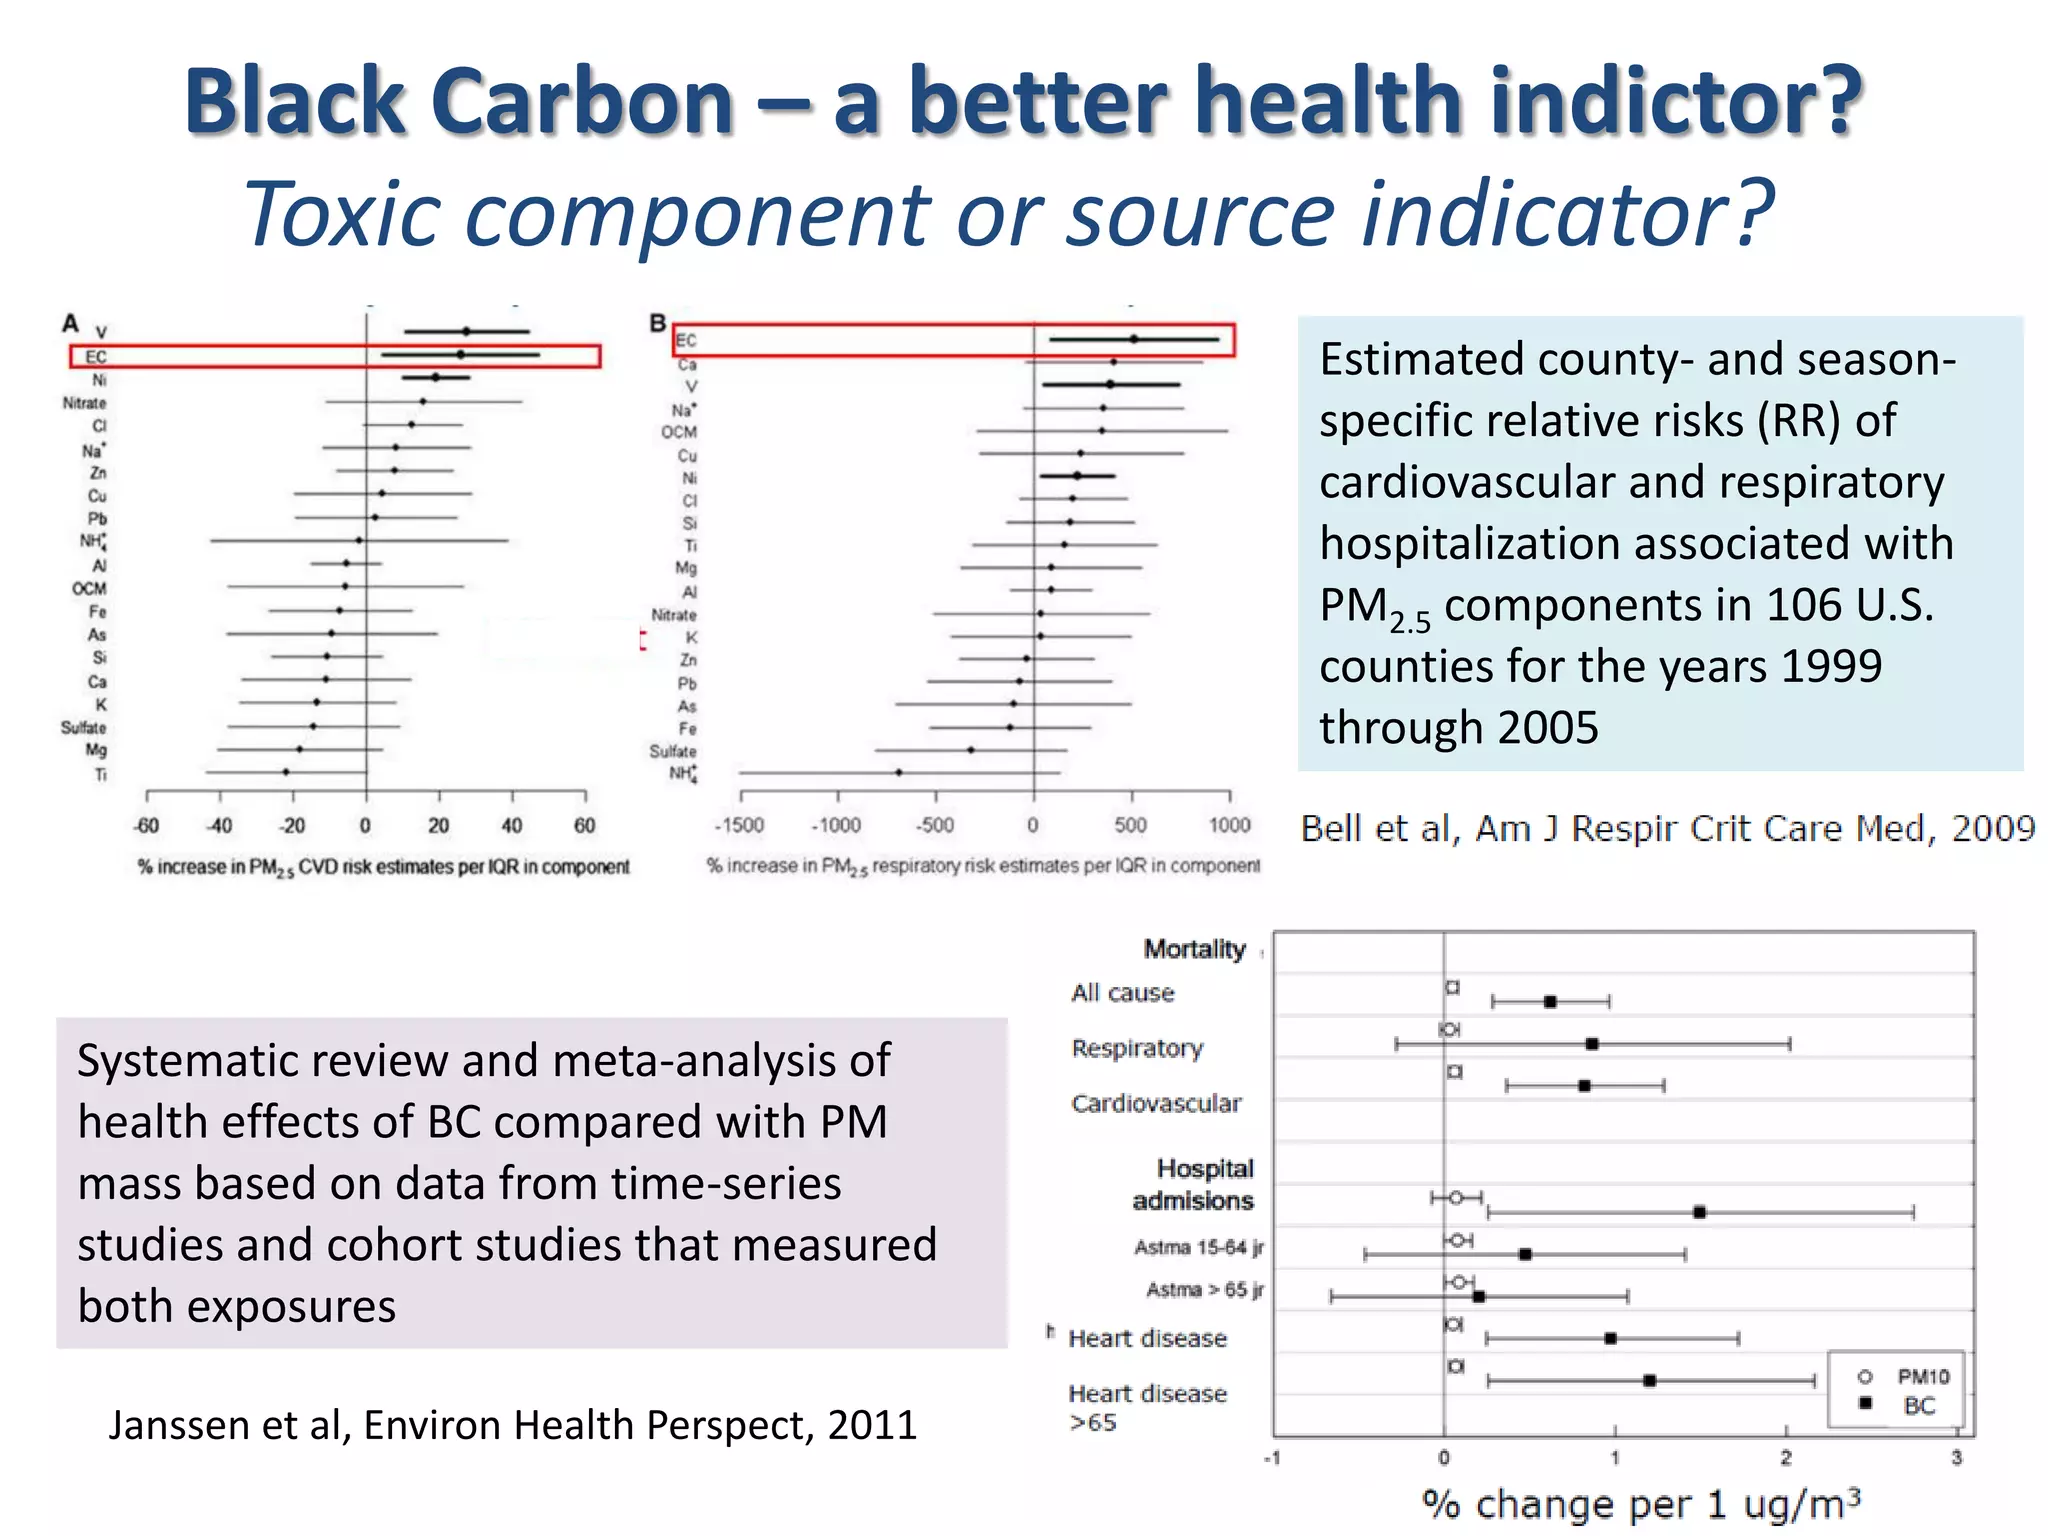
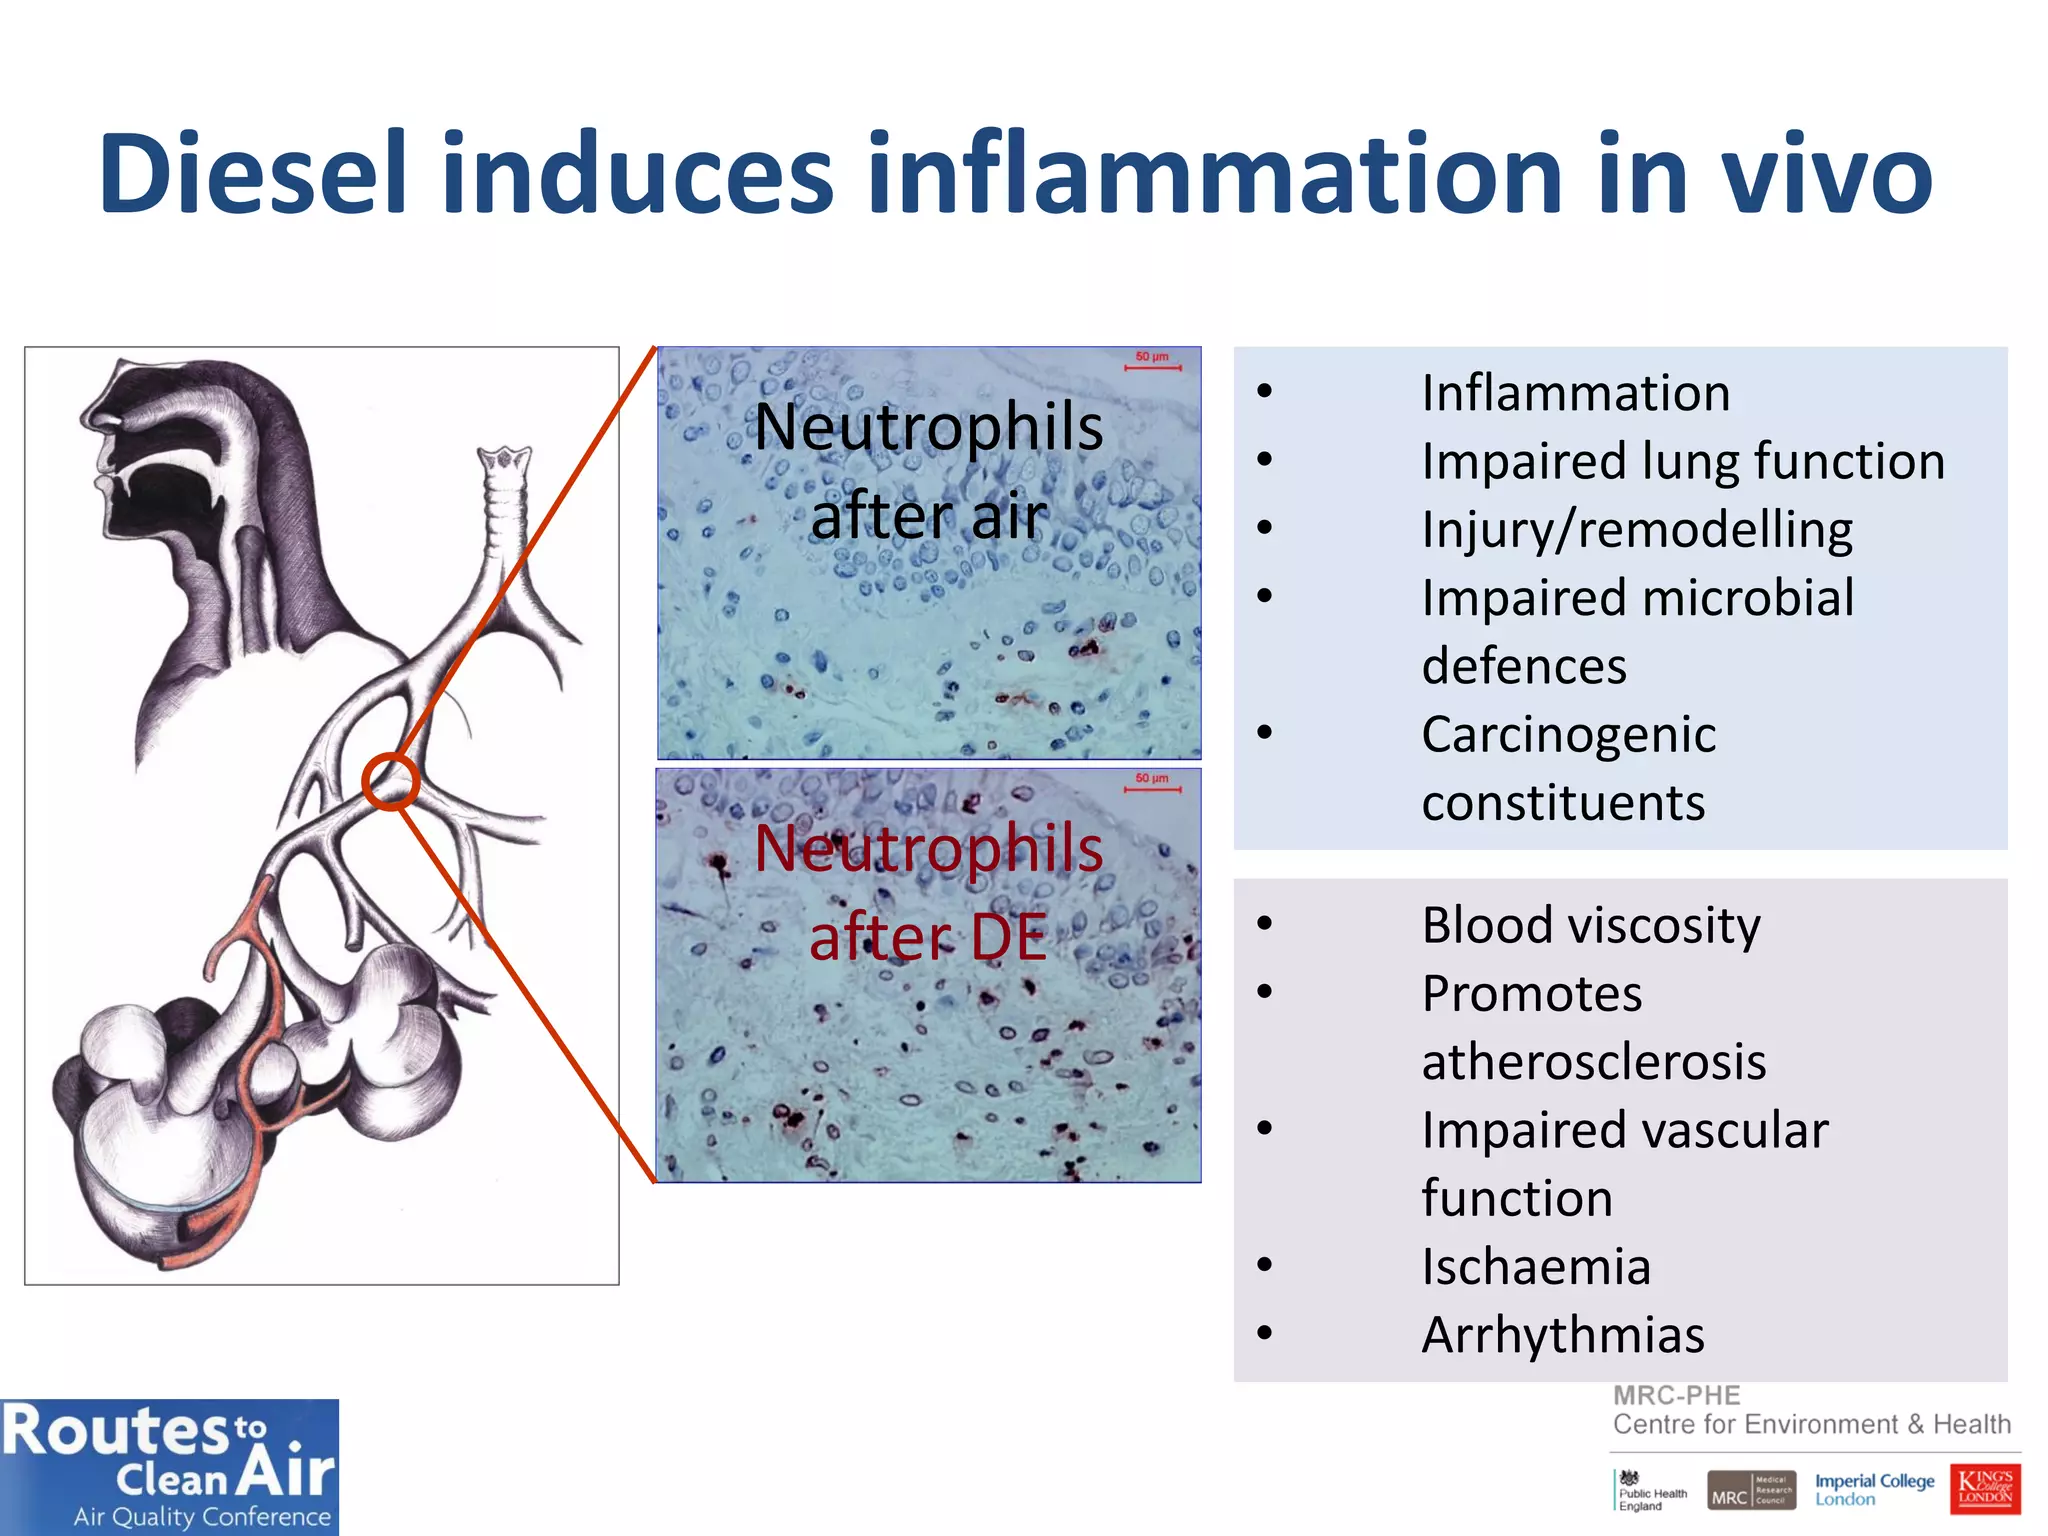
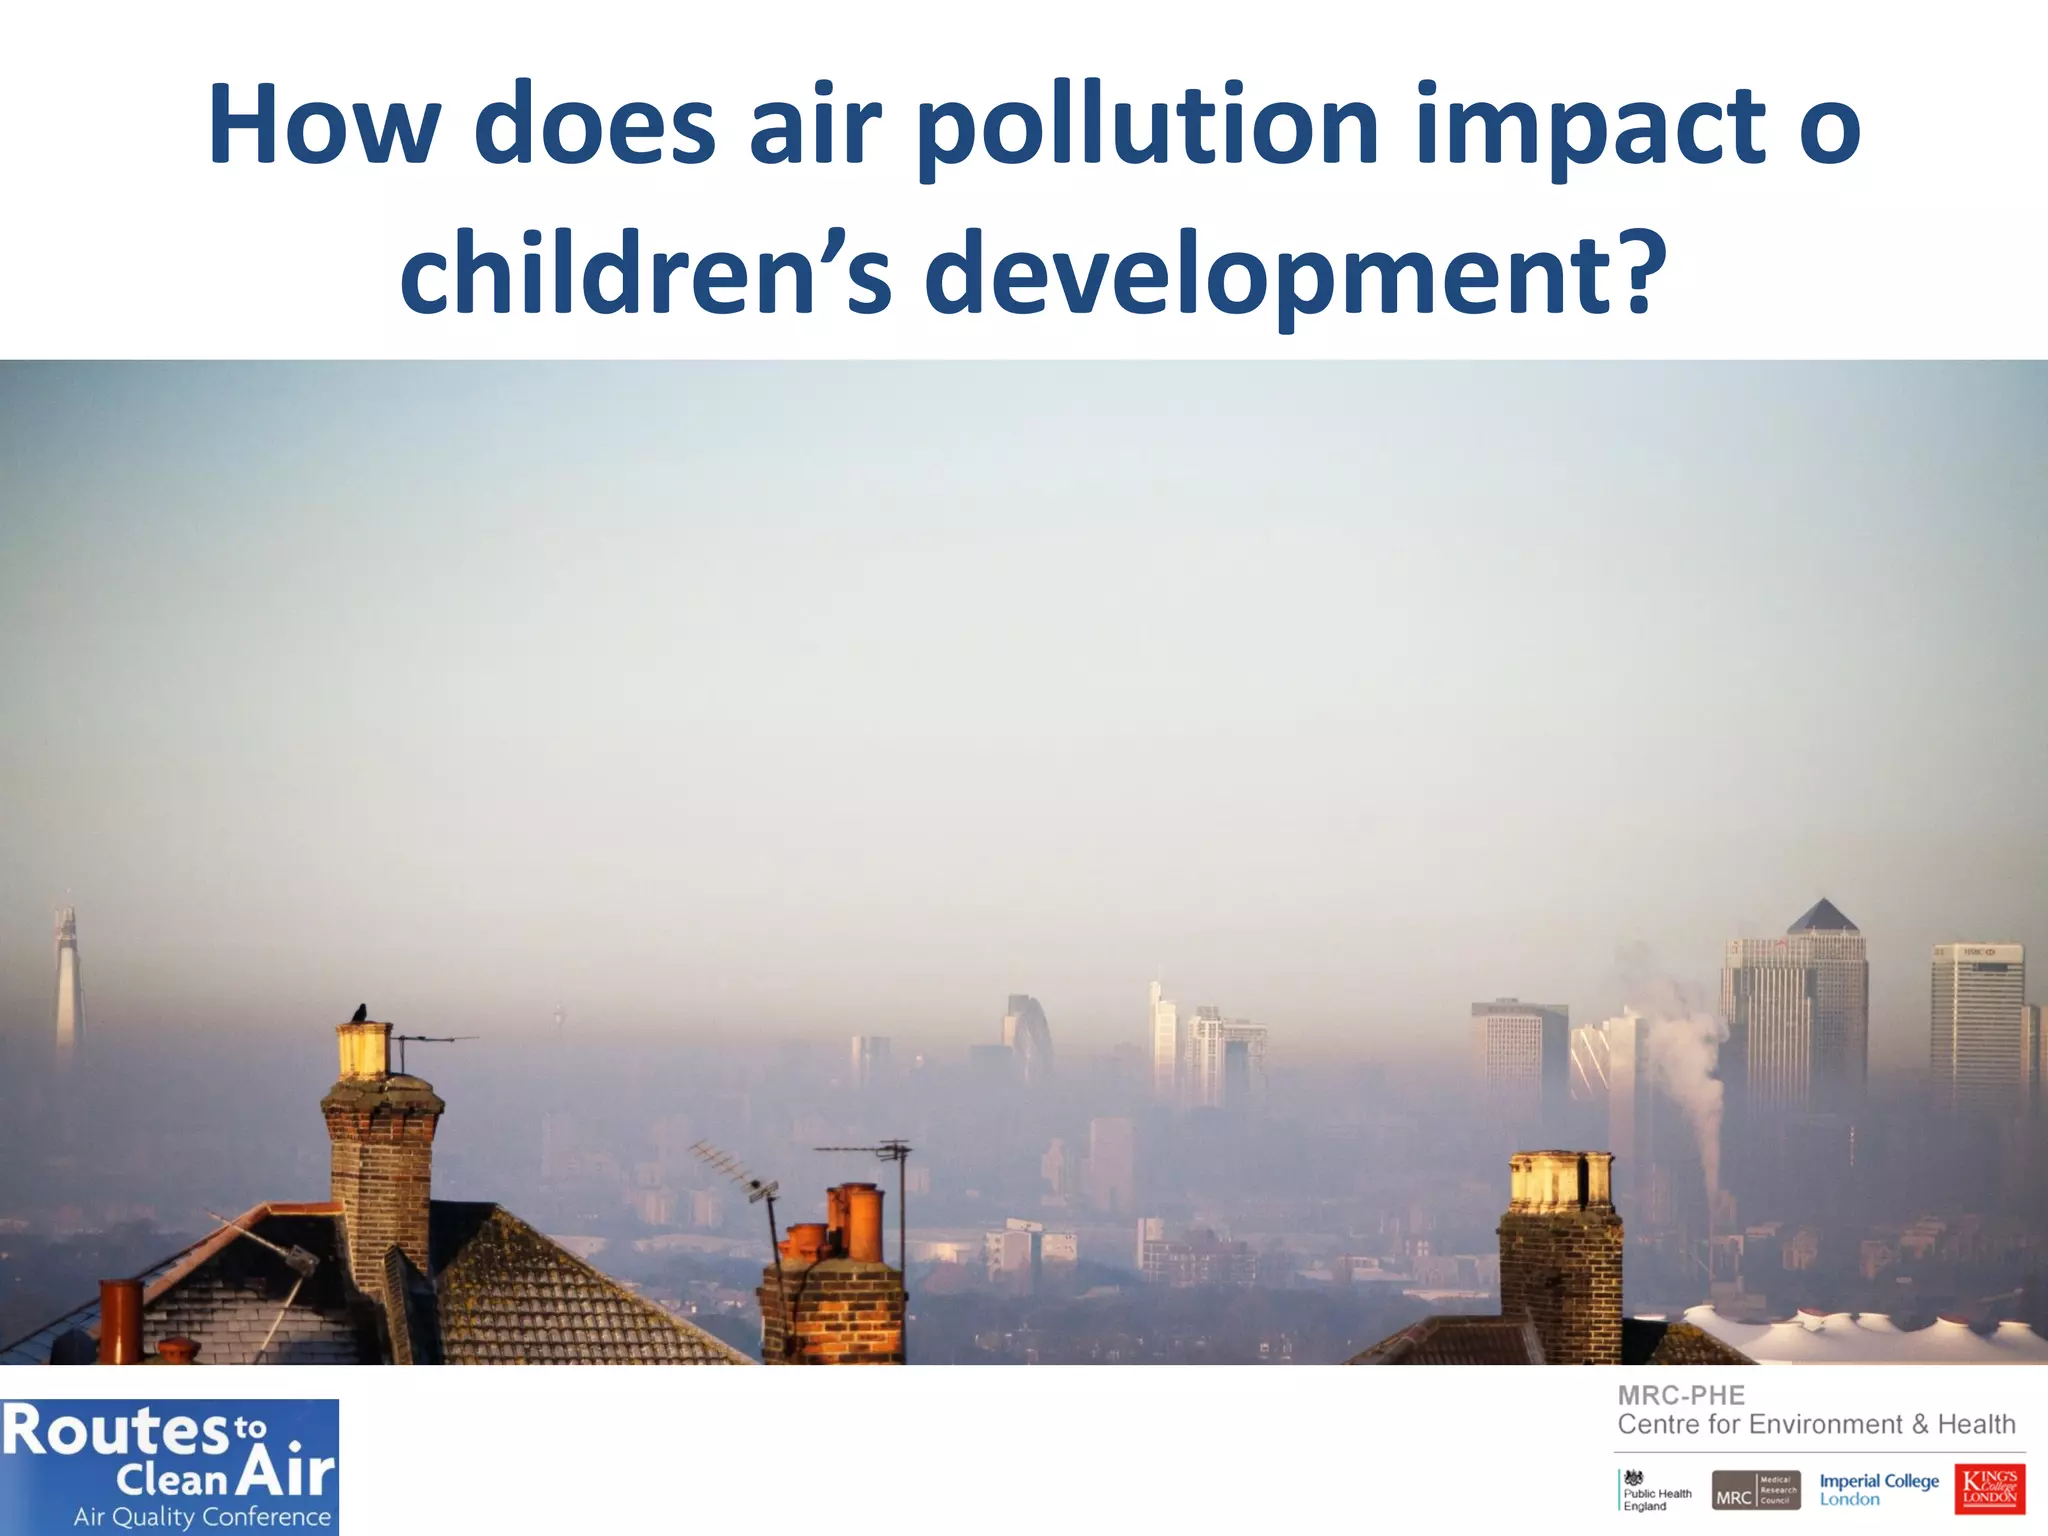
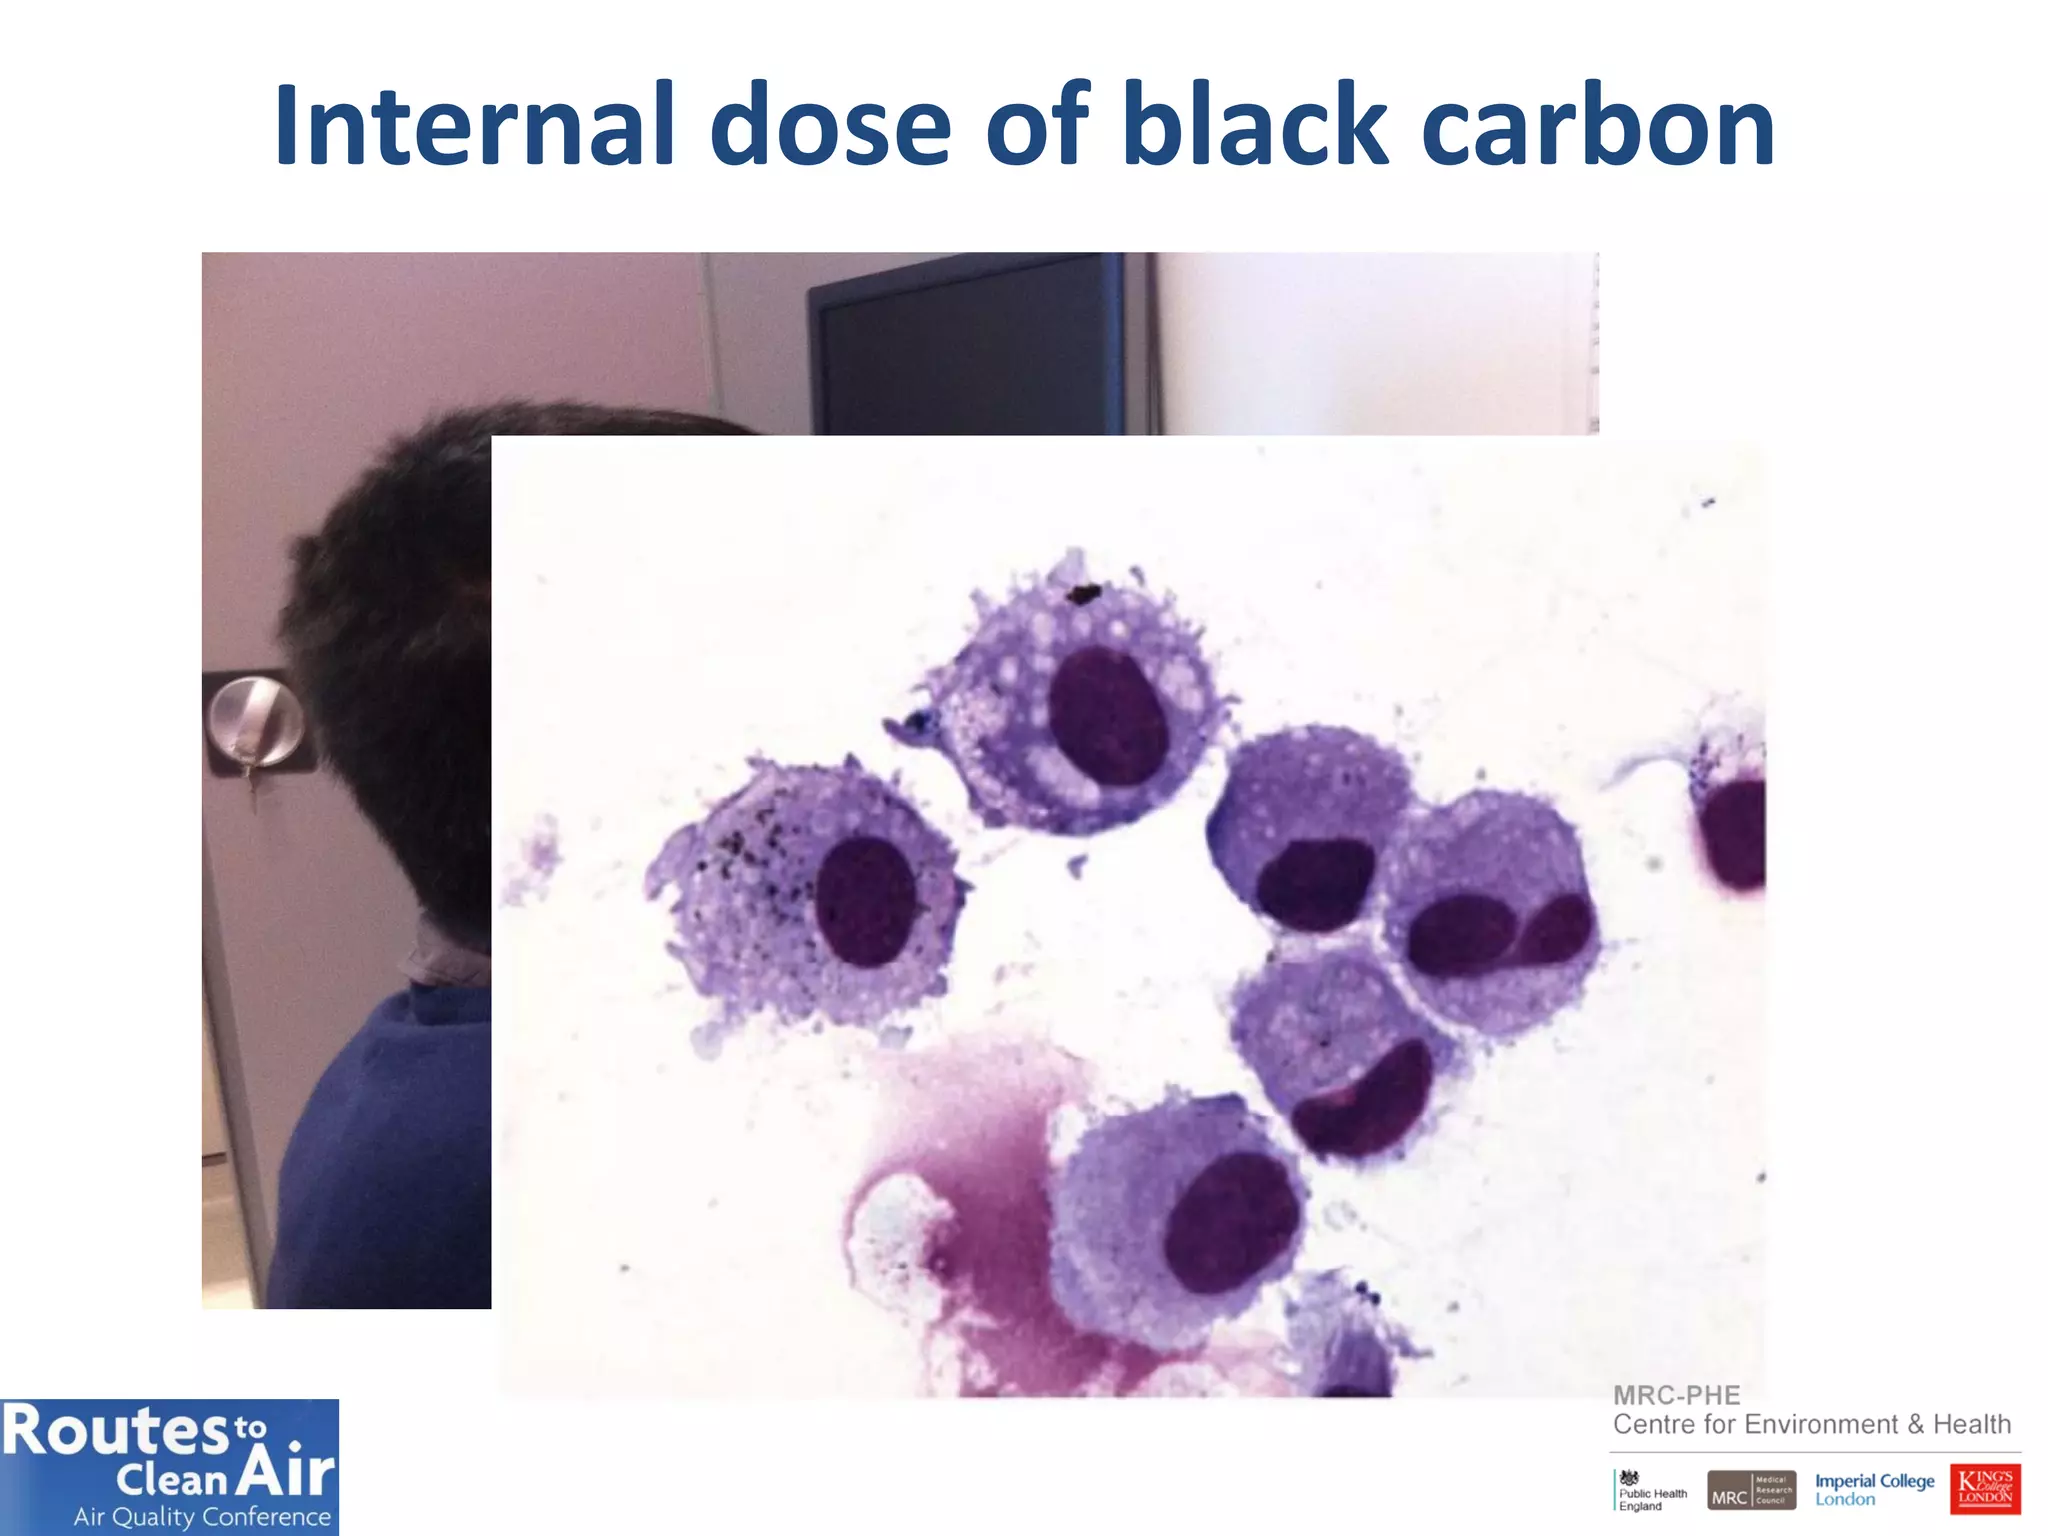
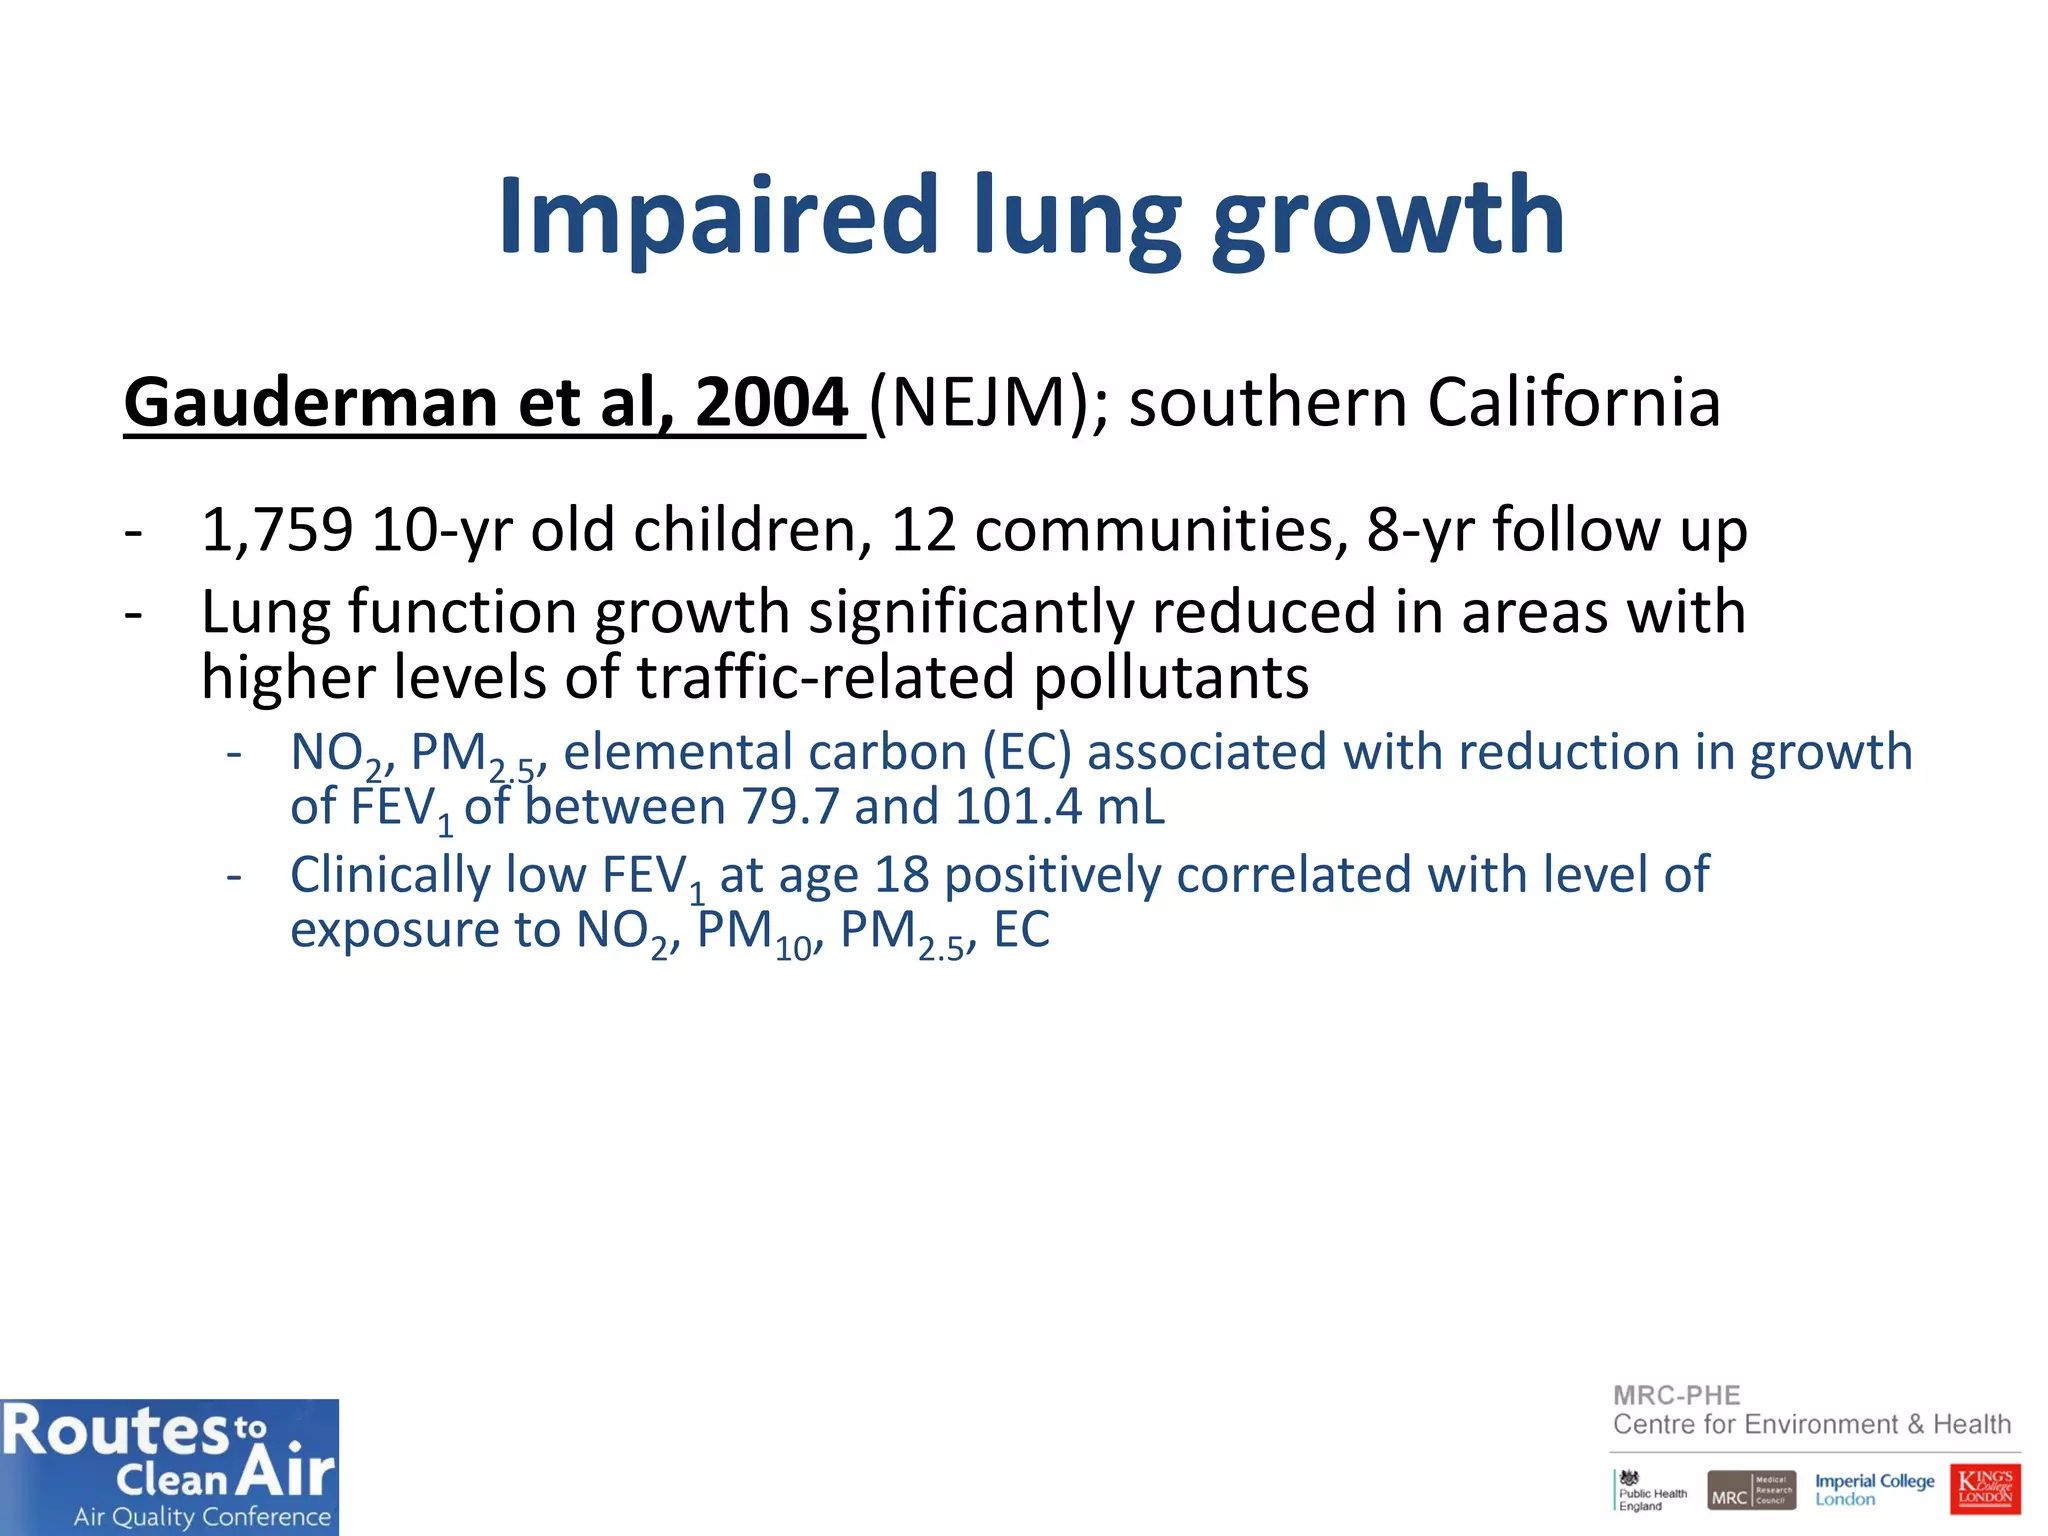
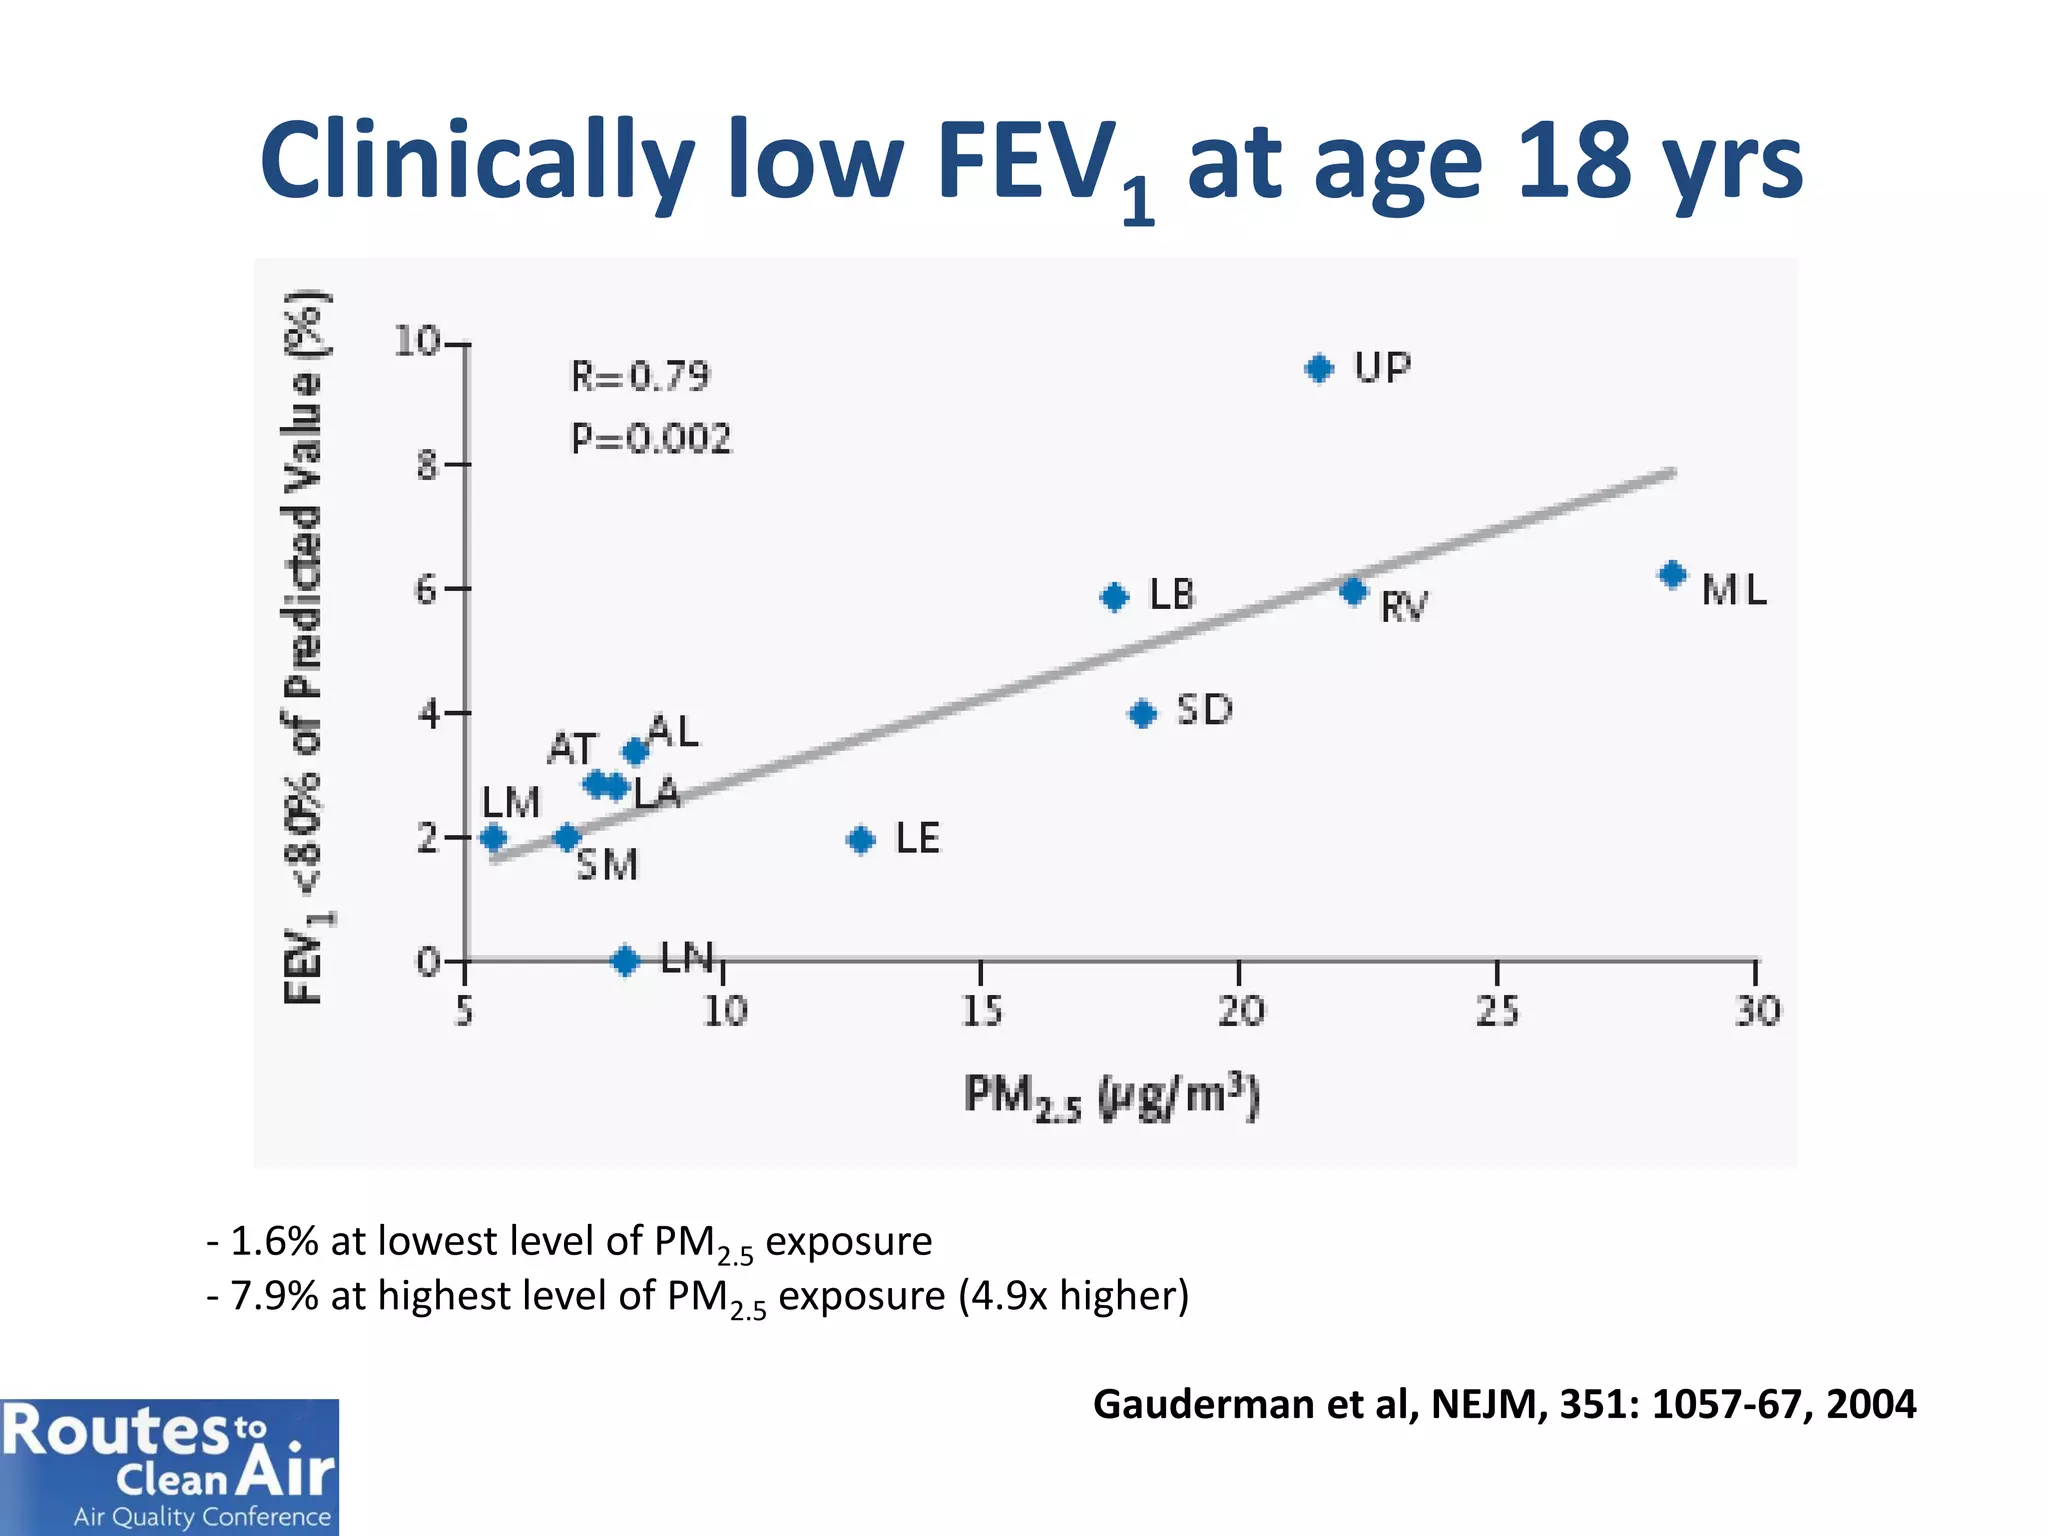
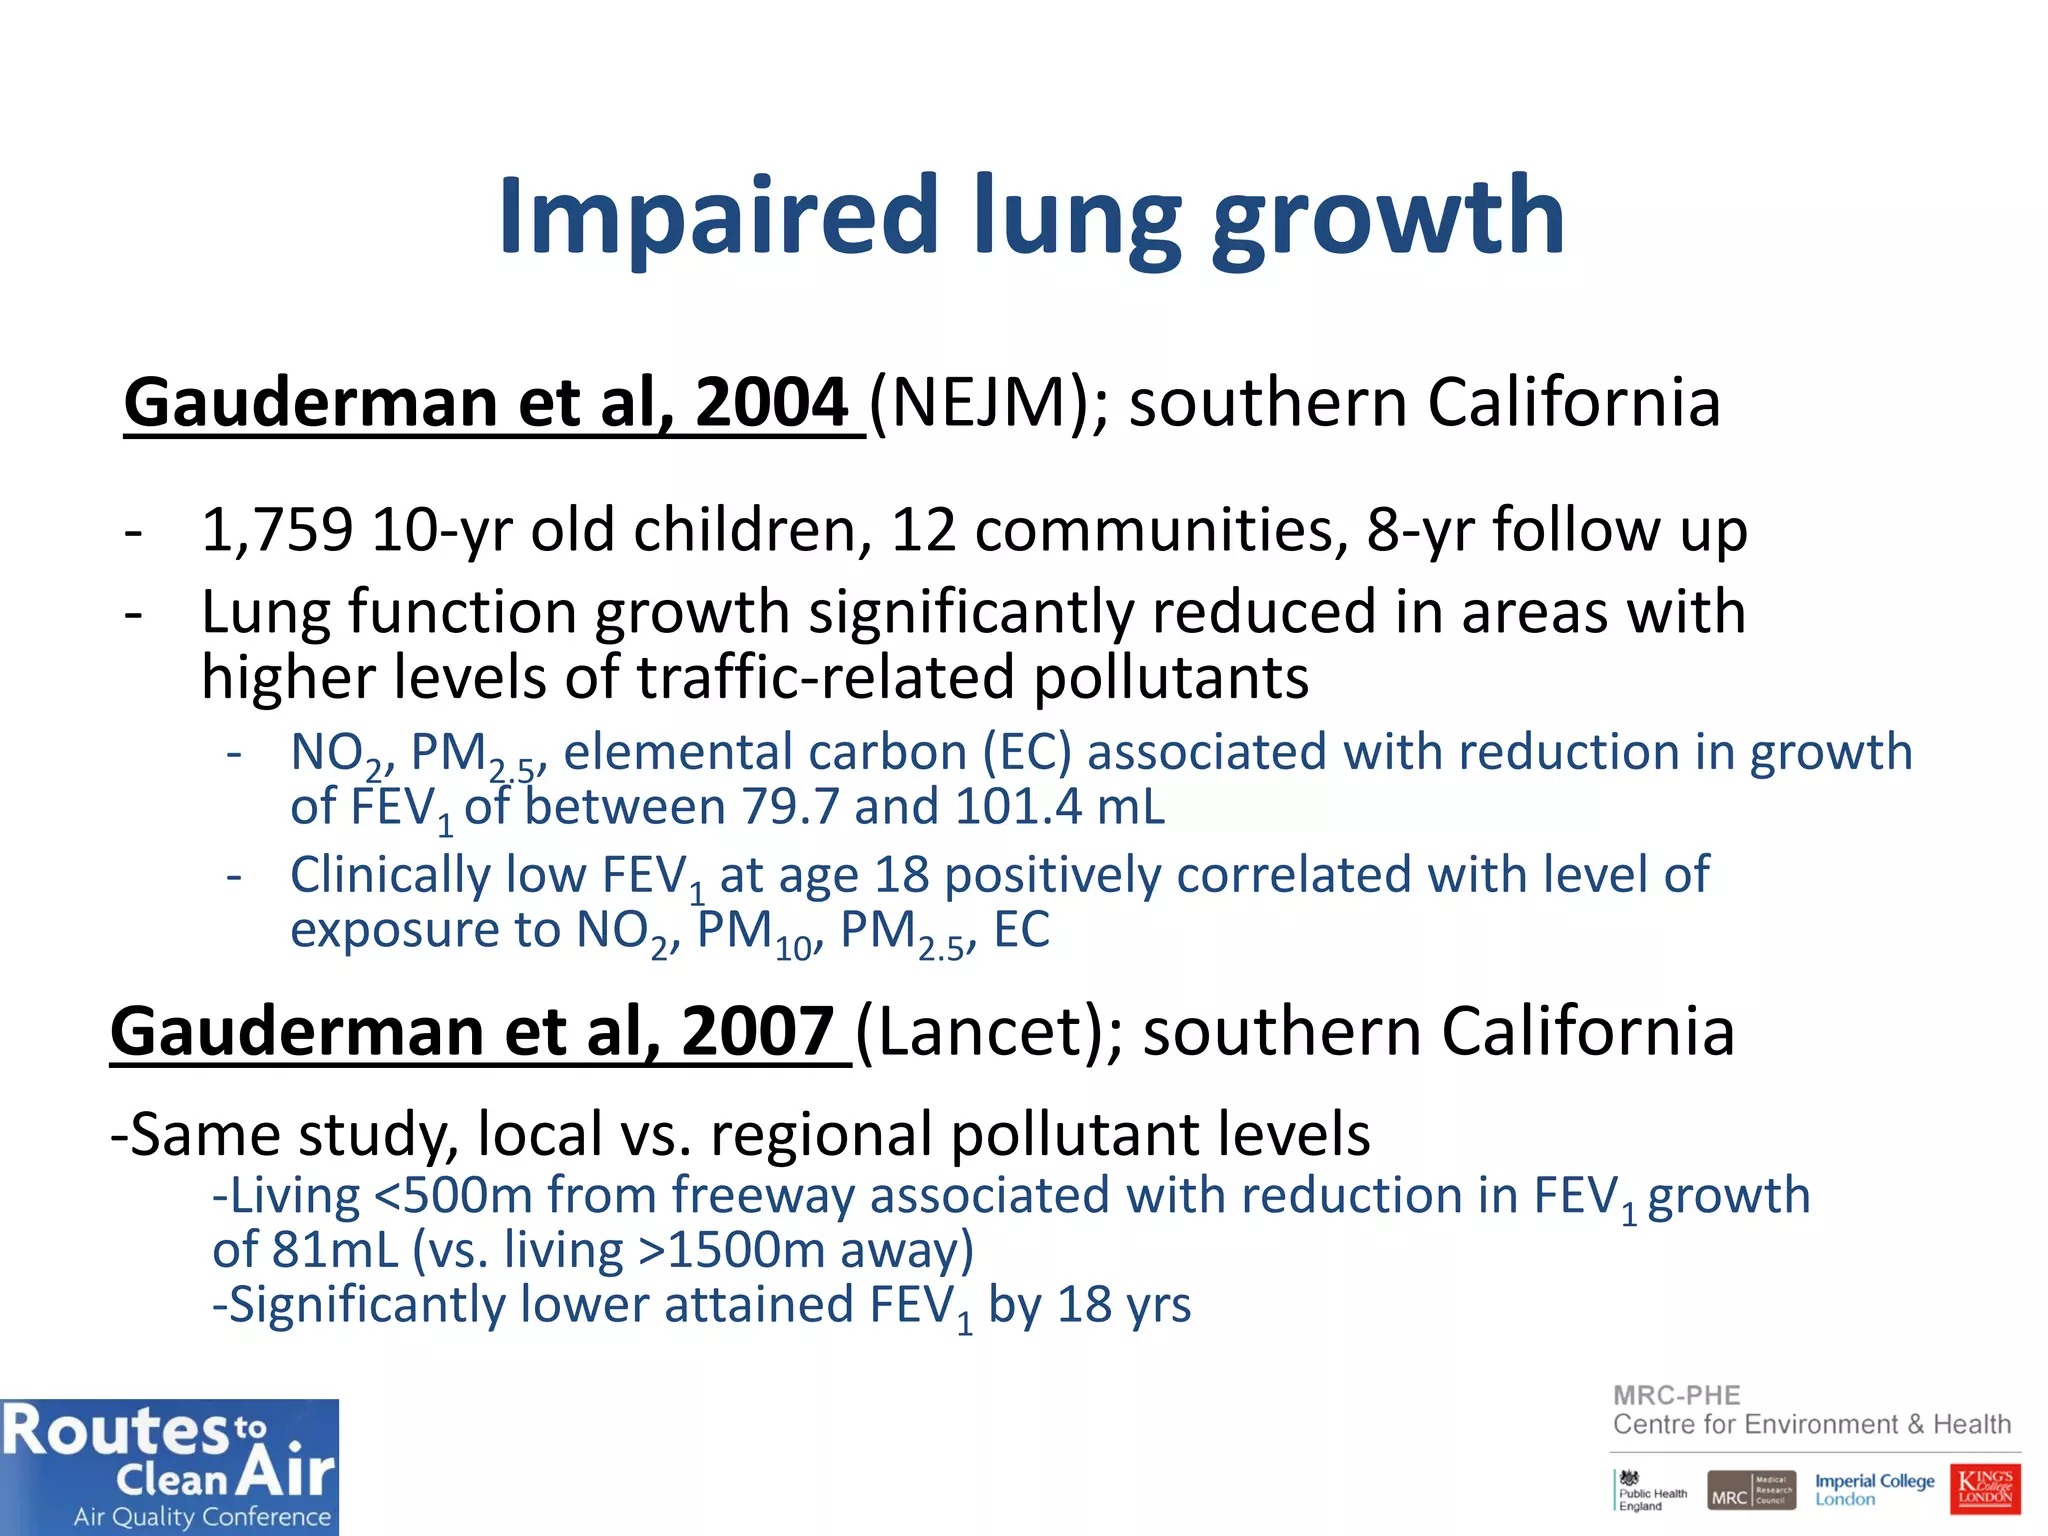
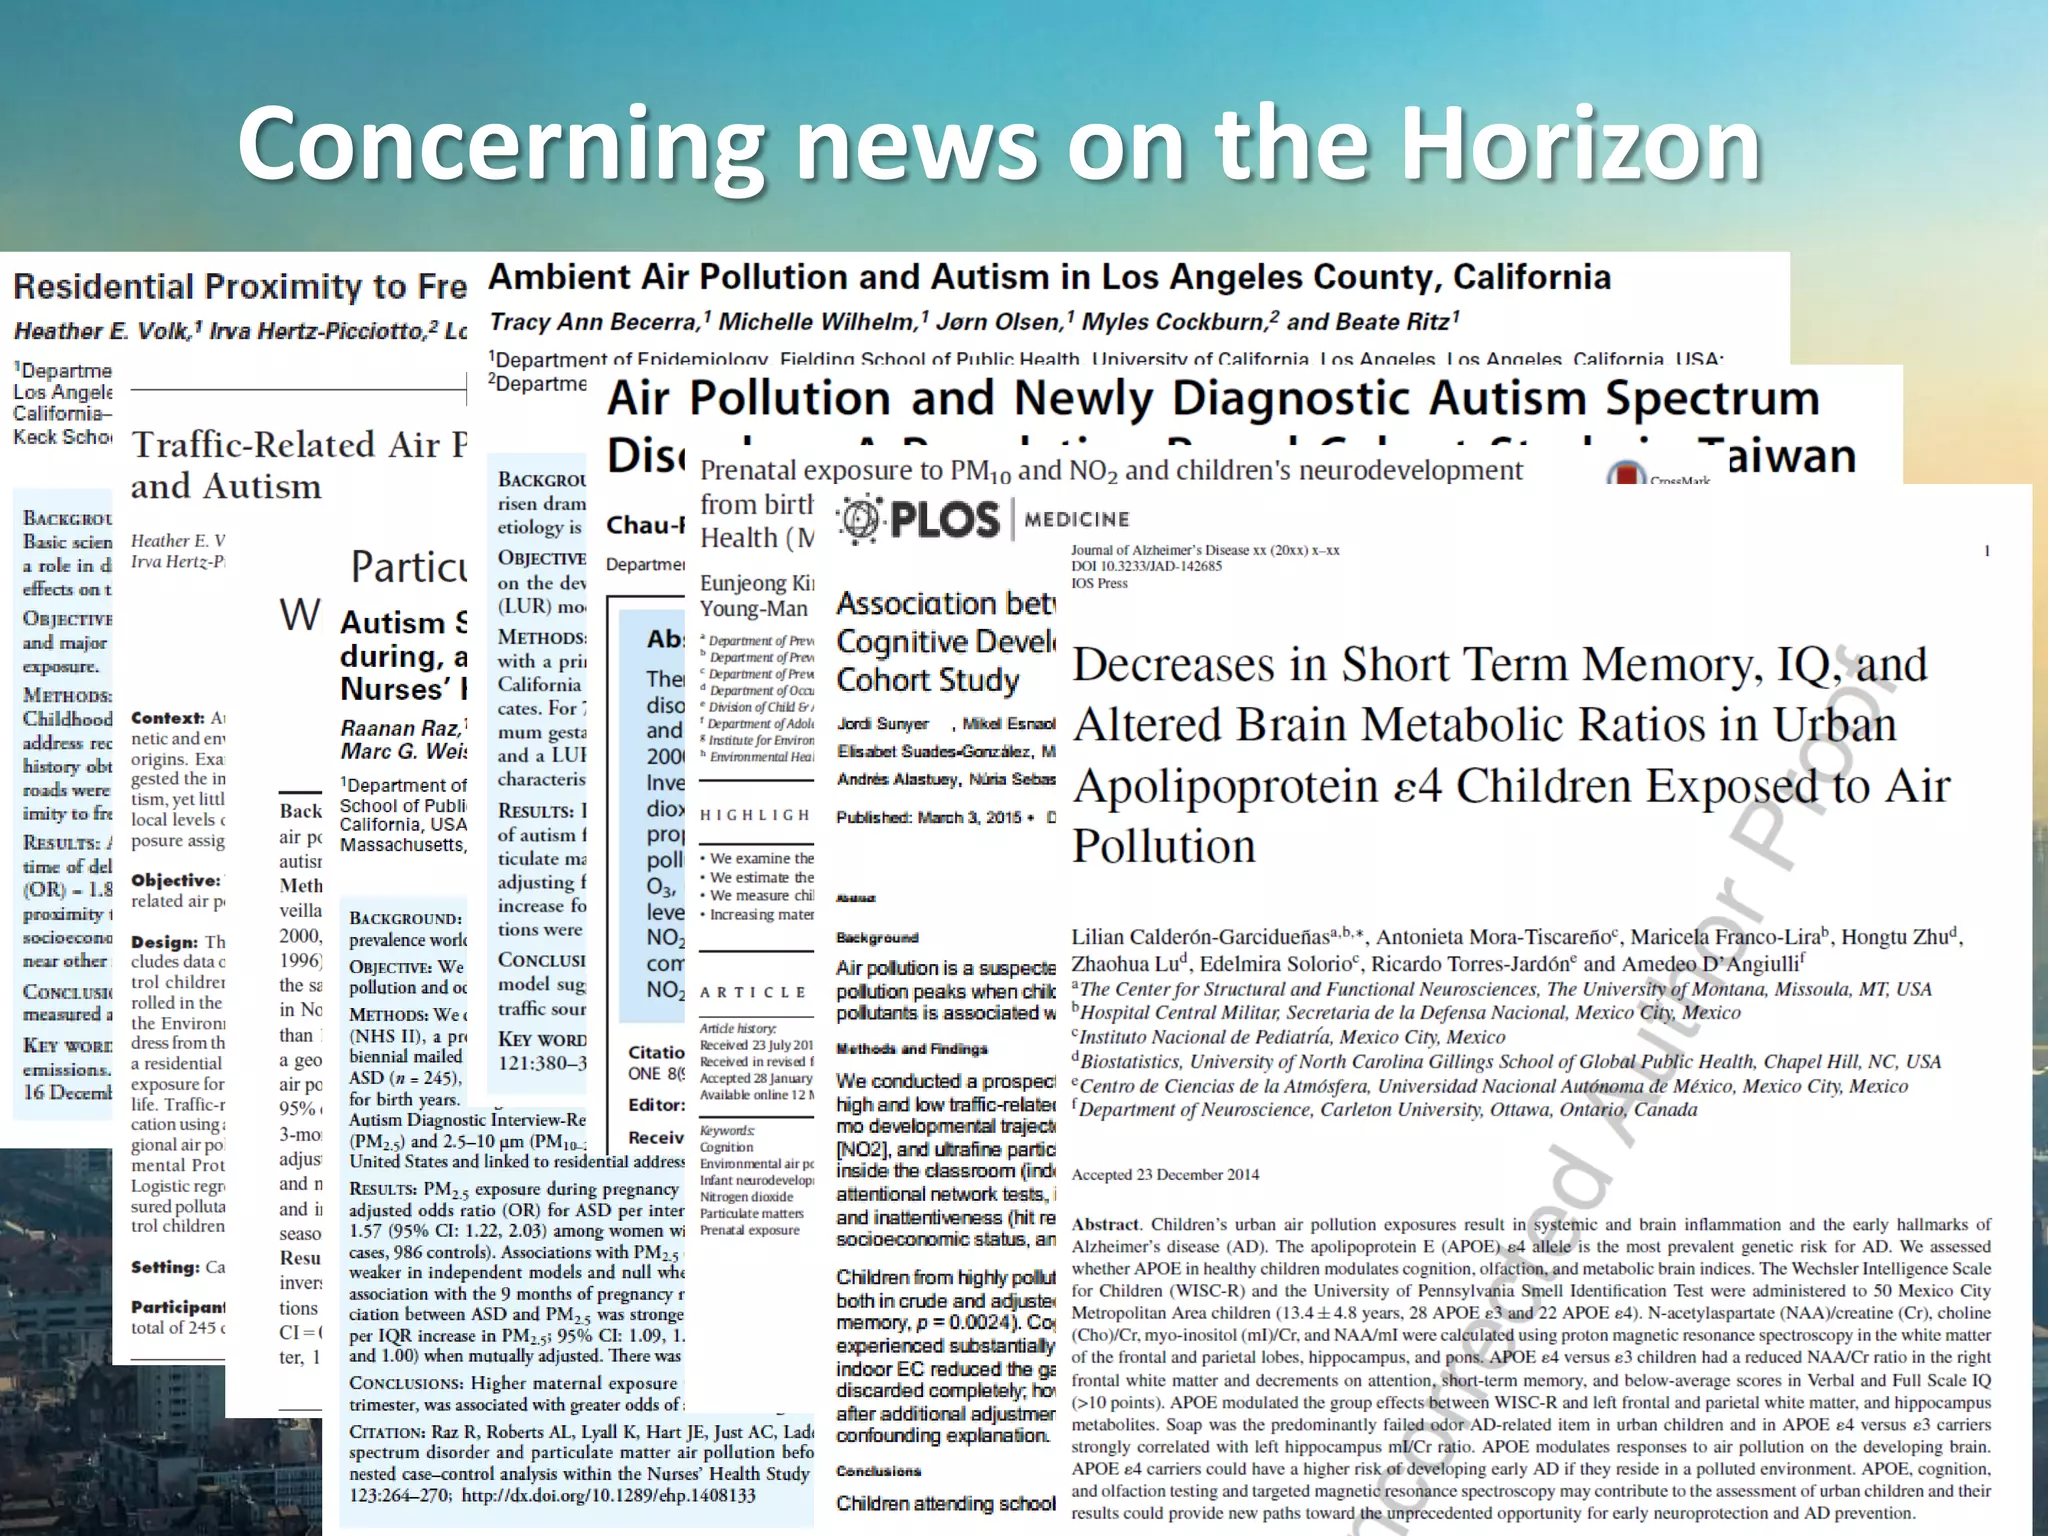
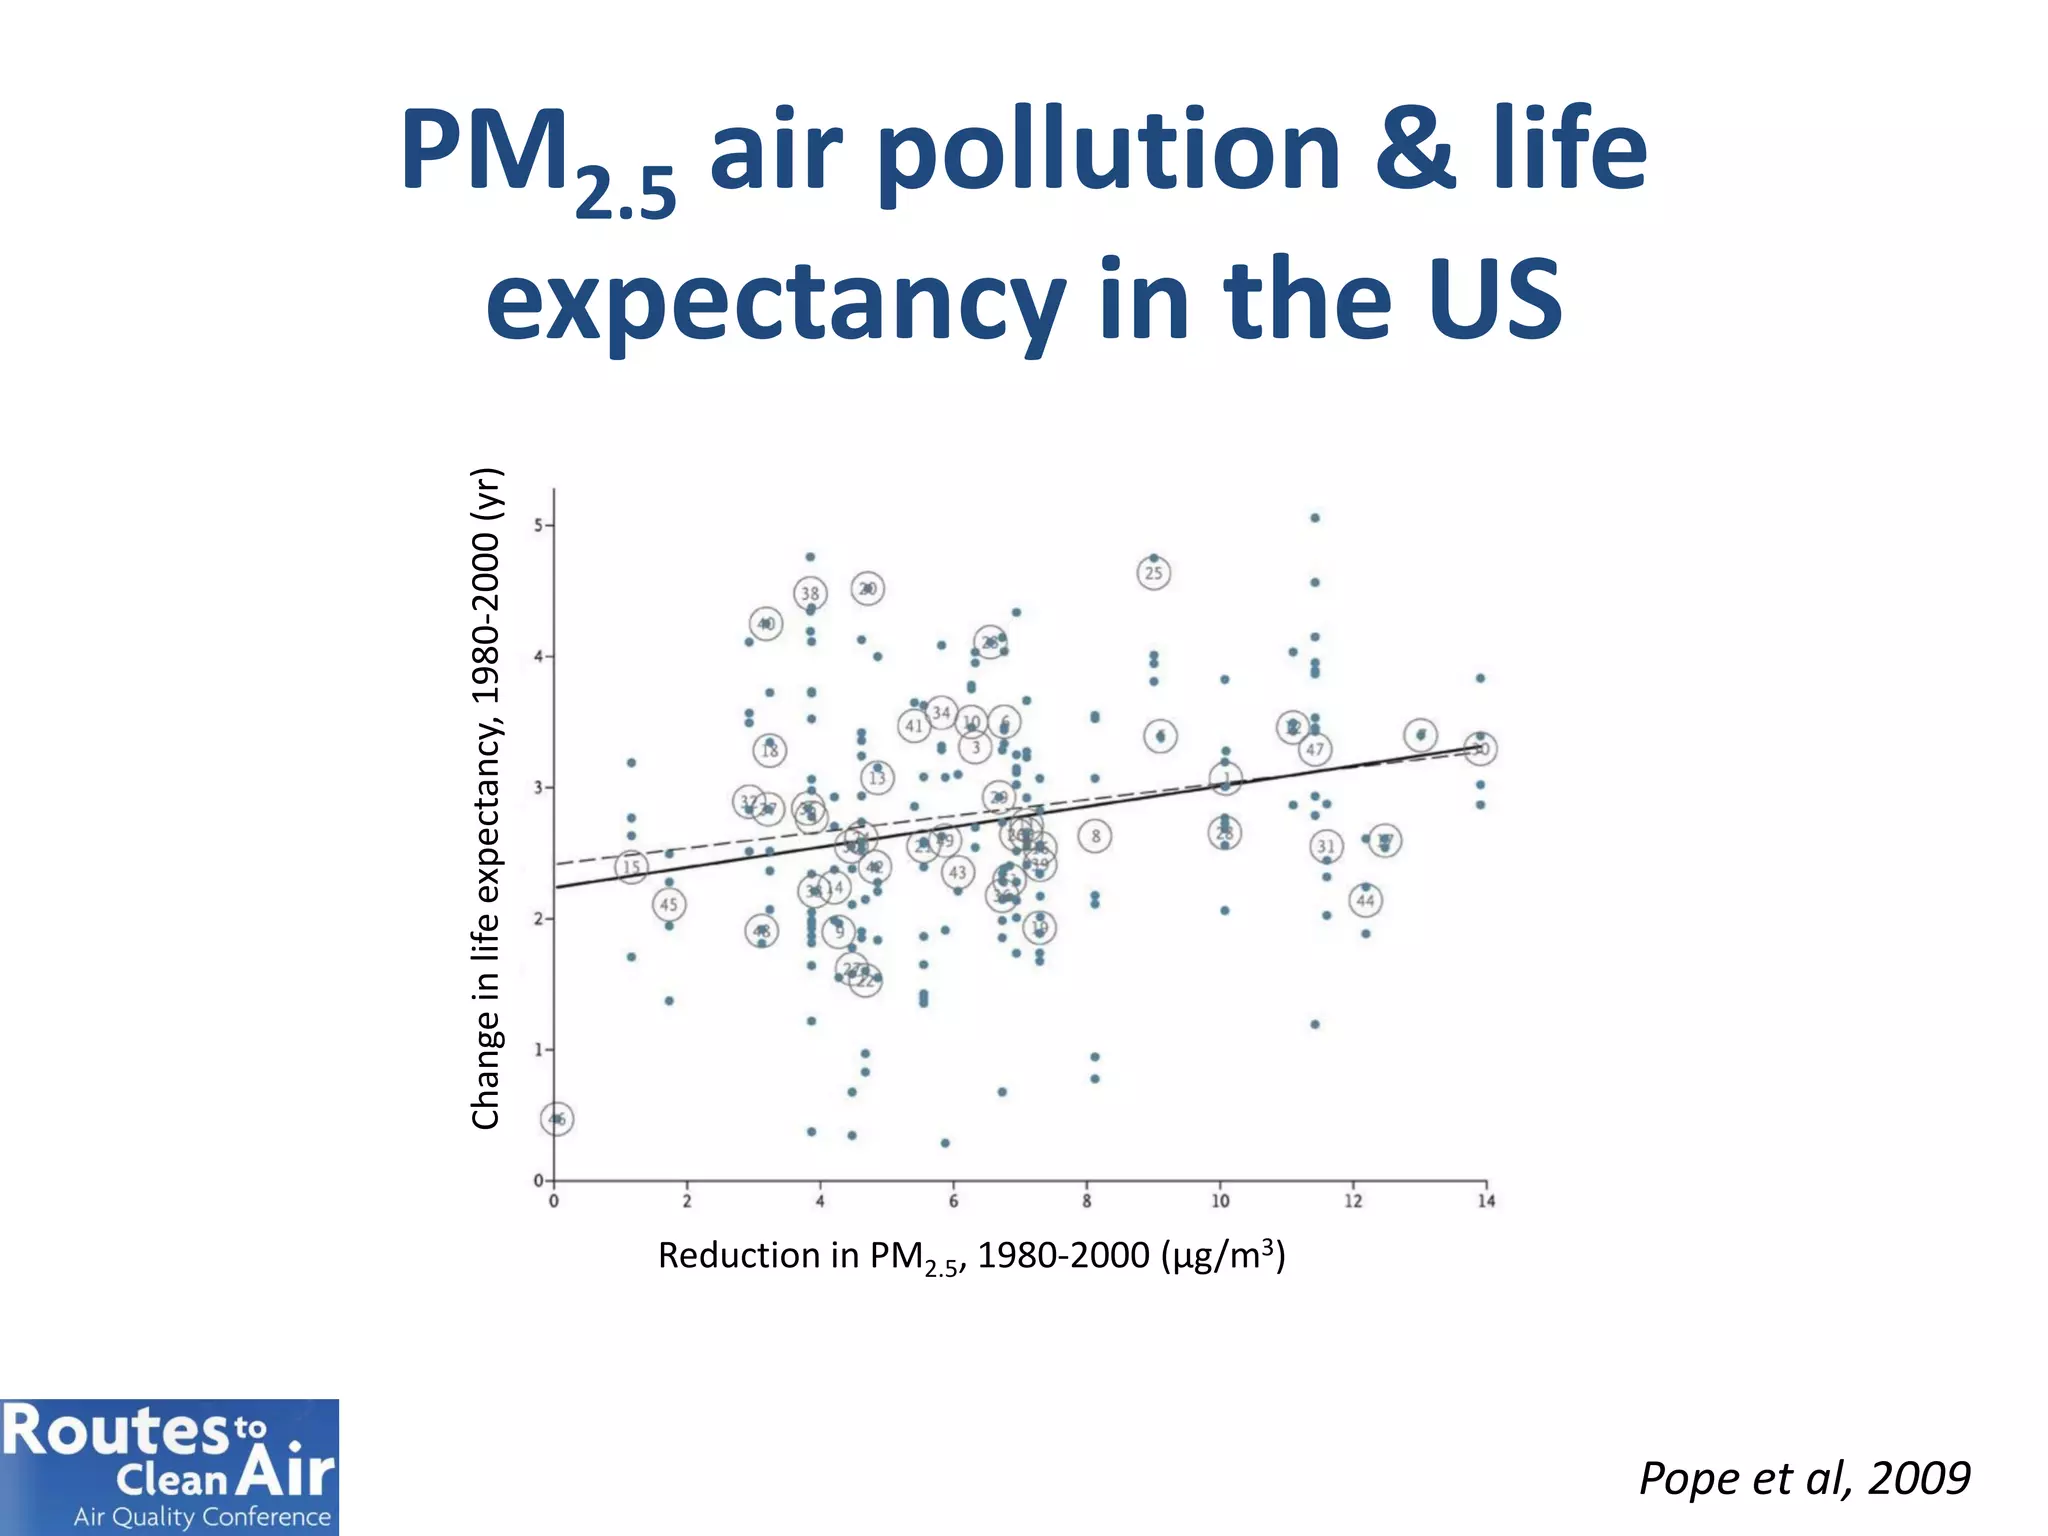
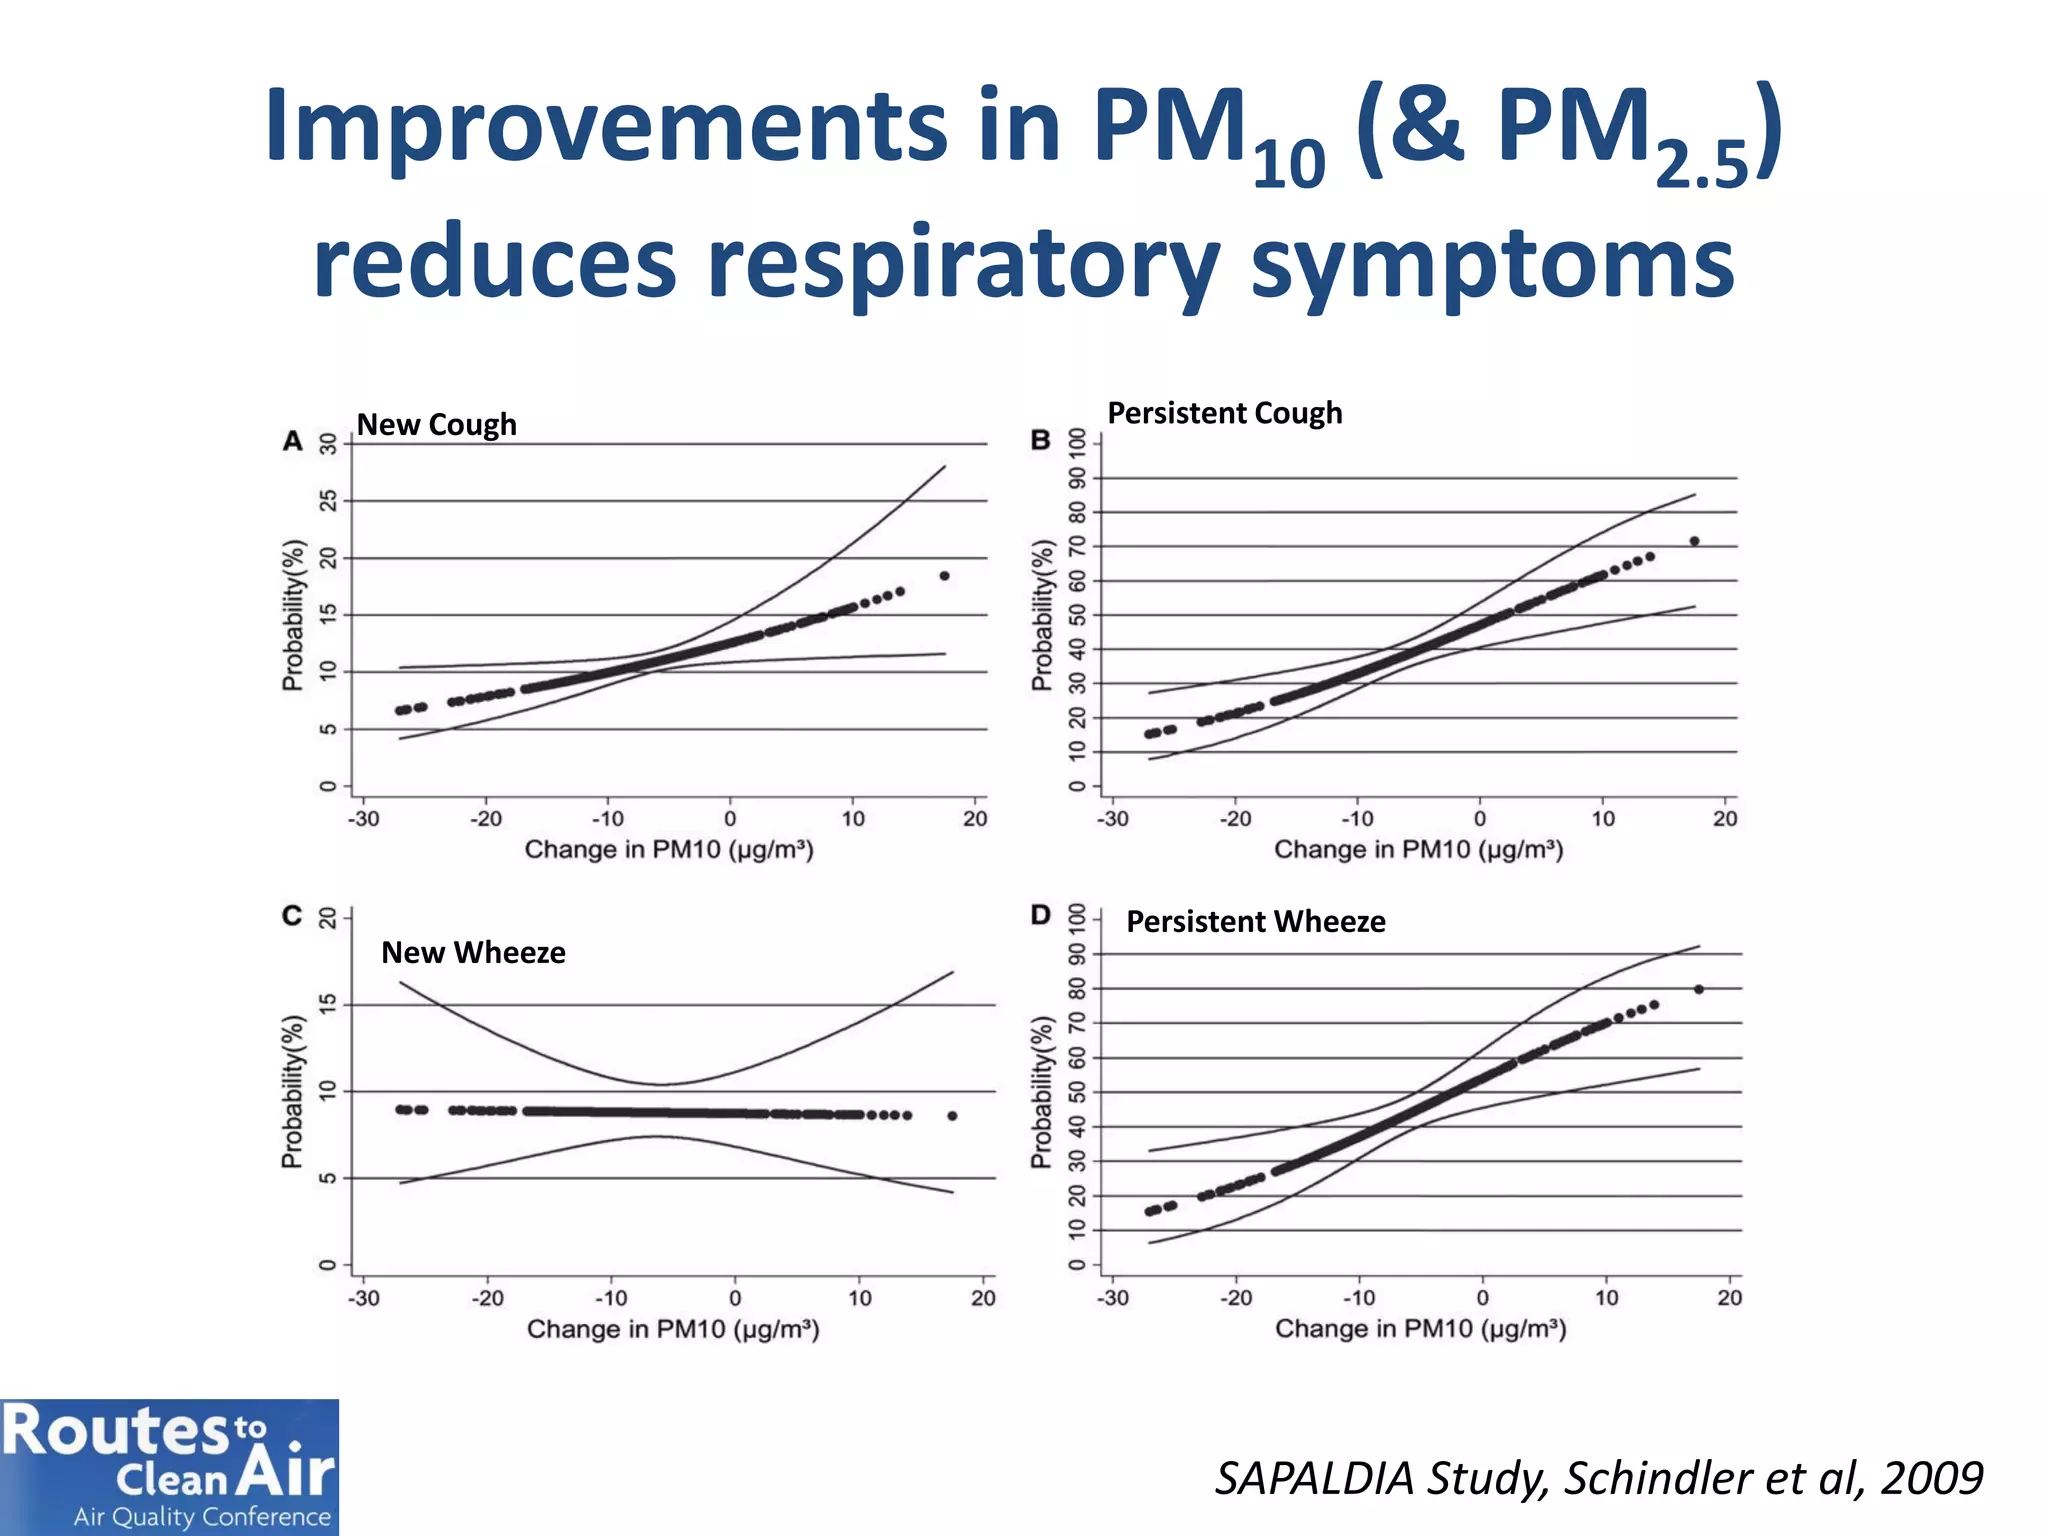
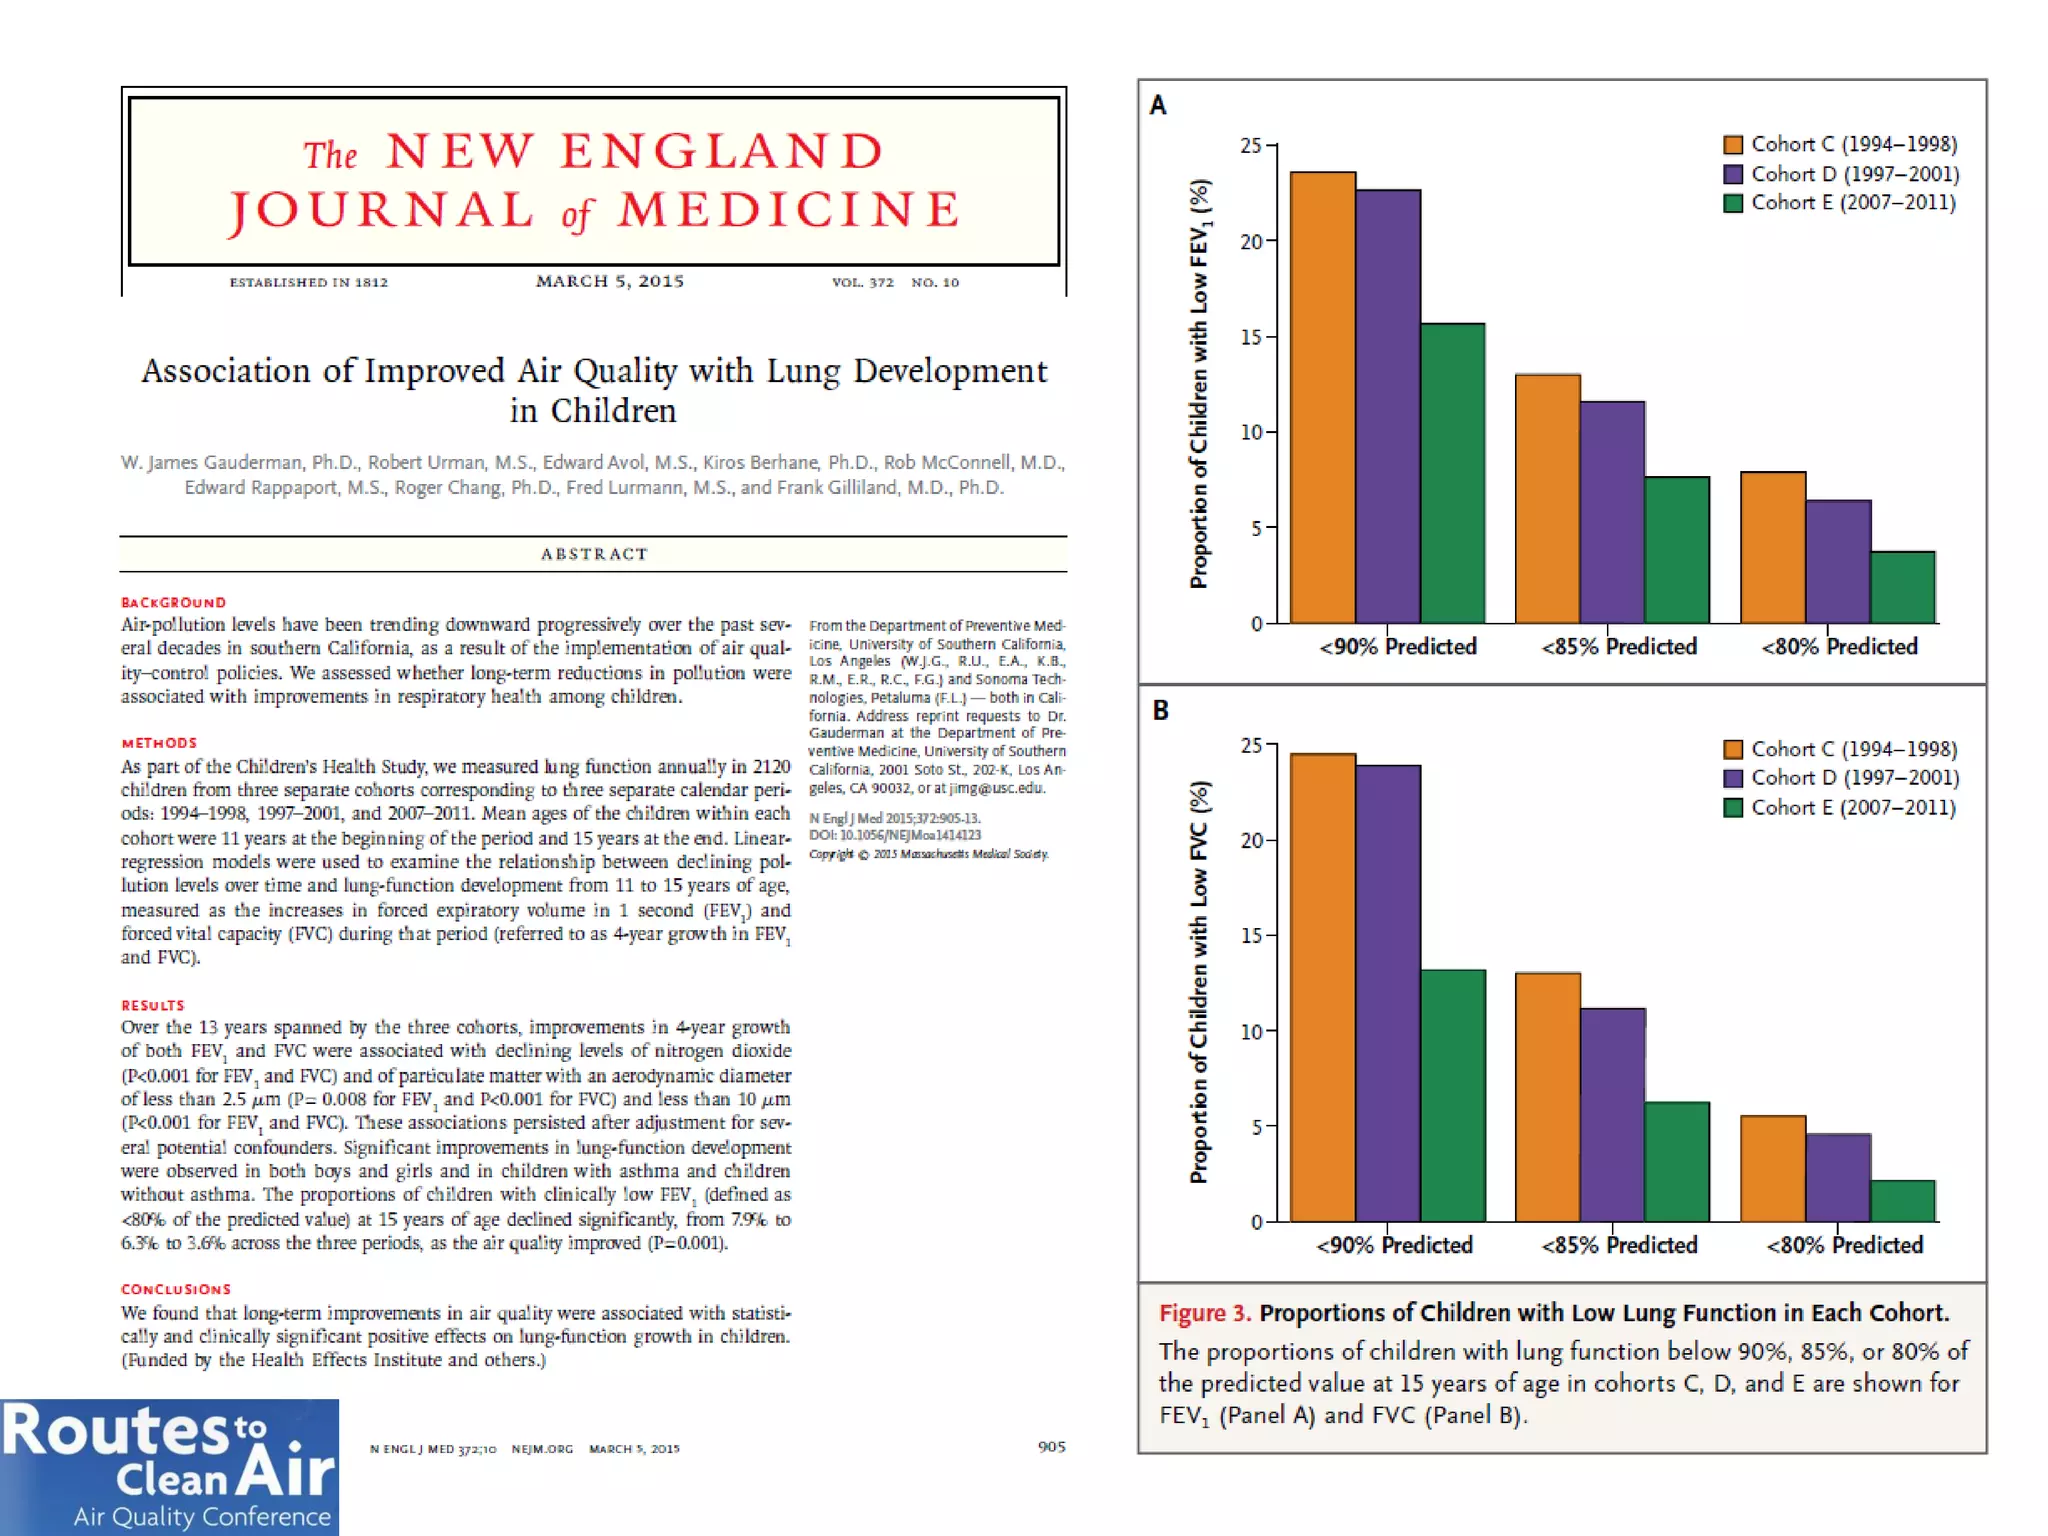
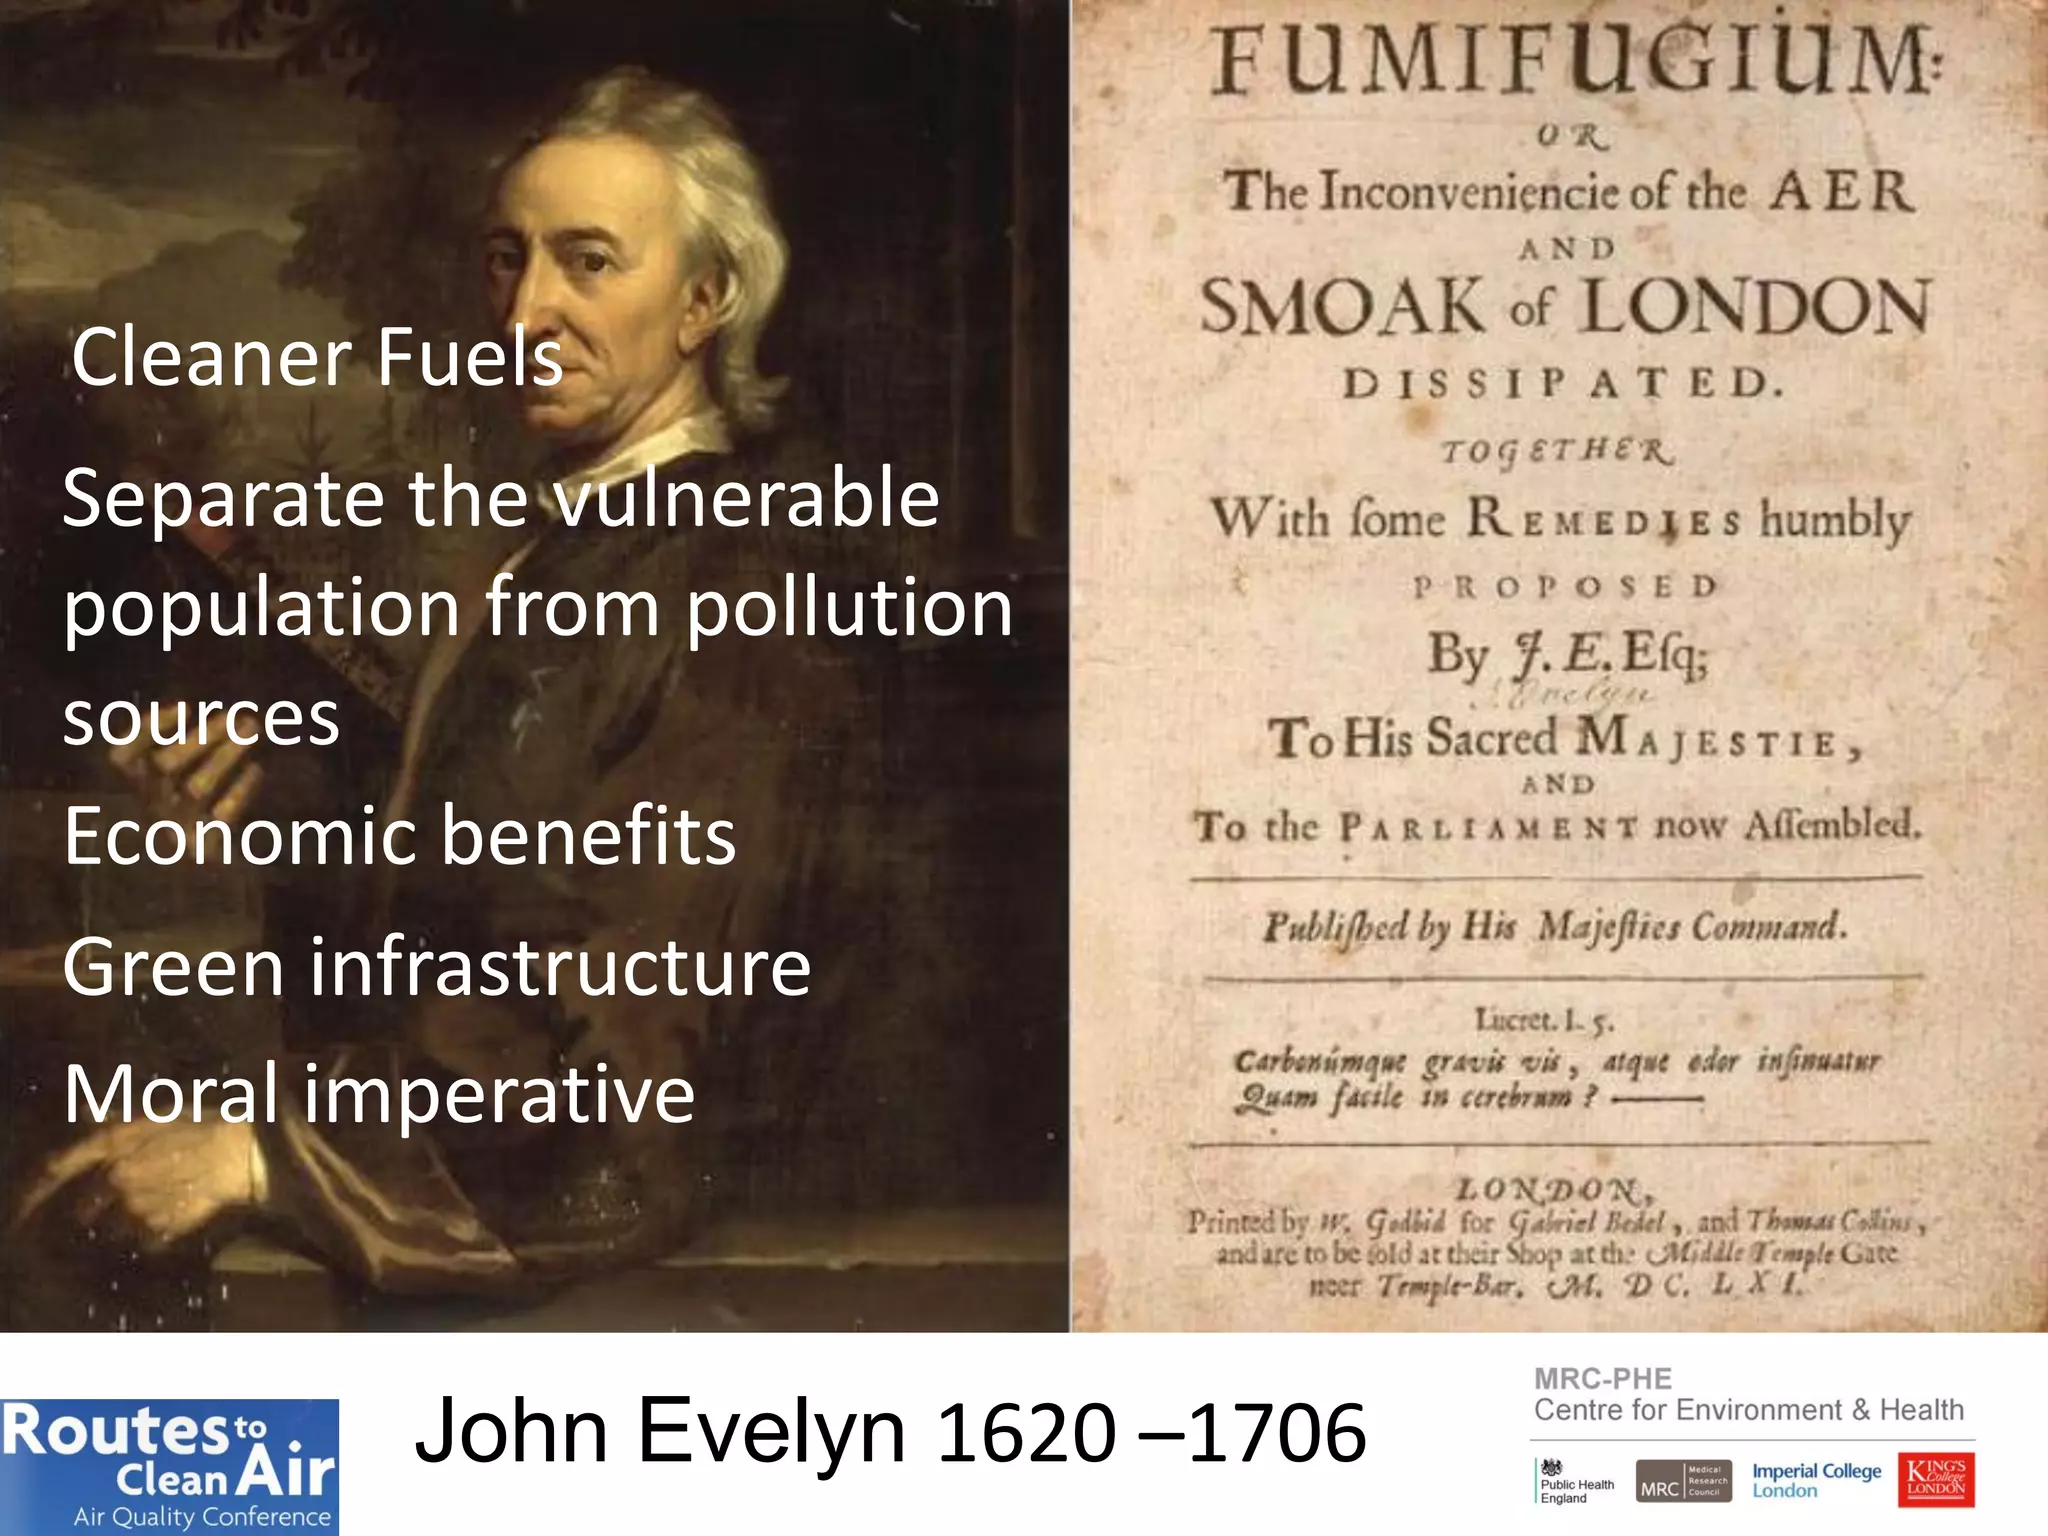
Dr Ian Mudway
Health Effects of Air
Pollution
ian.mudway@kcl.ac.uk
Additives
Nitrogen dioxides (incl. NO2),
ozone, particulate matter,
volatile organic carbon
compounds.
PM associated
chemicals
Nitrogen dioxides (incl. NO2),
ozone, particulate matter
(PNC, PM2.5, PM10, coarse PM),
organic carbon, elemental
carbon, volatile organic
carbon compounds, quinones.
PAHs, metals (Fe, Cu, Cr, V, Ni,
Sb, As, Cd, Al, etc), stable
radicals, SOA, POA, sulphate,
nitrate, NaCl.
Diesel
What’s the consequence of this?
But this is what happened
Burden of disease from 20 leading
causes in 2010
Lim et al. LANCET (2012)
Ambient air pollution (PM2.5):
Globally:
- 3.1 million deaths
- ~ 3.0% of all DALYs
In Western, Central and Eastern Europe:
- 430,000 premature deaths;
- over 7 million years of healthy life lost Lim et al. LANCET (2012)
• 1000’s new health studies,
reviews (2006-2015)
• NPACT study (2013); ESCAPE
(2013)
• REVIHAAP (July 2013);
HRAPIE (Dec 2013)
• HEI Ultrafines report (2013)
• WHO Black Carbon report
(2012)
• IARC Diesel exhaust reports
(2013/2014)
• WHO Burden of disease report
(March 2014)
What is already known
Conclusions of the HEI Traffic Report 2010
Health outcome Association with traffic air
pollution exposure
Mortality
All-cause & CV Sufficient
Asthma & Respiratory – children
Asthma onset & prevalence
Asthma is more common in children living in the street buffers with
the highest concentration of traffic-related pollutants
Exacerbation of asthma symptoms
Children living in hot spots of traffic-related pollution experience
more symptoms and exacerbations
Sufficient
Sufficient
Asthma & Respiratory – Adults
Adult onset of asthma (one study)
Exacerbation of asthma symptoms (few studies)
Hospitalisation rates
Insufficient
Suggestive but not sufficient
Insufficient
Lung function
Living in proximity to high concentration of traffic air pollution
may be associated with reduced lung function
Suggestive but not sufficient
Meta-analysis of the association between long-
term exposure to PM2.5 and all-cause mortality
Hoek et al, EnvHealth 2013
These are all, by and large, associations
derived from old cohorts exposed to
historic levels of air pollution.
What do they tell us about
contemporary exposures?
Black Carbon – a better health indictor?
Toxic component or source indicator?
Estimated county- and season-
specific relative risks (RR) of
cardiovascular and respiratory
hospitalization associated with
PM2.5 components in 106 U.S.
counties for the years 1999
through 2005
Janssen et al, Environ Health Perspect, 2011
Systematic review and meta-analysis of
health effects of BC compared with PM
mass based on data from time-series
studies and cohort studies that measured
both exposures
Controlled Diesel Exposures
Exposure to DE: PM10 300µg/m3 and filtered air for 1 hour & 100µg/m3 and filtered air for 2
hours
Diesel induces inflammation in vivo
Neutrophils
after air
Neutrophils
after DE
• Inflammation
• Impaired lung function
• Injury/remodelling
• Impaired microbial
defences
• Carcinogenic
constituents
• Blood viscosity
• Promotes
atherosclerosis
• Impaired vascular
function
• Ischaemia
• Arrhythmias
How does air pollution impact o
children’s development?
NO2 in Tower Hamlets & Hackney
Internal dose of black carbon
16
Impaired lung growth
Gauderman et al, 2004 (NEJM); southern California
- 1,759 10-yr old children, 12 communities, 8-yr follow up
- Lung function growth significantly reduced in areas with
higher levels of traffic-related pollutants
- NO2, PM2.5, elemental carbon (EC) associated with reduction in growth
of FEV1 of between 79.7 and 101.4 mL
- Clinically low FEV1 at age 18 positively correlated with level of
exposure to NO2, PM10, PM2.5, EC
Gauderman et al, NEJM, 351: 1057-67, 2004
- 1.6% at lowest level of PM2.5 exposure
- 7.9% at highest level of PM2.5 exposure (4.9x higher)
Clinically low FEV1 at age 18 yrs
18
Impaired lung growth
Gauderman et al, 2004 (NEJM); southern California
- 1,759 10-yr old children, 12 communities, 8-yr follow up
- Lung function growth significantly reduced in areas with
higher levels of traffic-related pollutants
- NO2, PM2.5, elemental carbon (EC) associated with reduction in growth
of FEV1 of between 79.7 and 101.4 mL
- Clinically low FEV1 at age 18 positively correlated with level of
exposure to NO2, PM10, PM2.5, EC
Gauderman et al, 2007 (Lancet); southern California
-Same study, local vs. regional pollutant levels
-Living <500m from freeway associated with reduction in FEV1 growth
of 81mL (vs. living >1500m away)
-Significantly lower attained FEV1 by 18 yrs
Concerning news on the Horizon
20
Causes for Optimism
PM2.5 air pollution & life
expectancy in the US
Pope et al, 2009
Reduction in PM2.5, 1980-2000 (μg/m3)
Changeinlifeexpectancy,1980-2000(yr)
Improvements in PM10 (& PM2.5)
reduces respiratory symptoms
SAPALDIA Study, Schindler et al, 2009
New Cough Persistent Cough
New Wheeze
Persistent Wheeze
John Evelyn 1620 –1706
Cleaner Fuels
Separate the vulnerable
population from pollution
sources
Economic benefits
Green infrastructure
Moral imperative
Acknowledgements
Centre for Primary Care and
Public Health, QMUL:
Chris Griffiths, Jonathan Grigg, Robert
Walton, Isobel Dundas, Stephen
Bremner, Nadine Marlin, Louise Cross,
Neeru Garg, Alex Nanzer, Yasmeen
Hanifa, Harpal Kalsi, Tom Round, Peter
Bridge, Ratna Sohanpal, Adam Briggs,
Grace Tuaf Toro, Niki Jakeways, Dev
Gadhvi, Seif Shaheen, Rossa Brugha,
Grainne Colligan, Chinedu Nwokoro,
Anna Schwappach, David McLaughlin,
Neetha Purushotham, Hannah
Smithers.
Environmental Research
Group, KCL:
Frank Kelly, Helen Wood, Jeenath
Jamaludin, Andrew Grieve, Esme
Purdie, Layla Aitlhadj, Eleanor Smith,
Erik Van Nunen, Ben Barratt, Sean
Beevers.
Umea, Sweden:
Anders Blomerg, Thomas Sandstrom,
Annelie Behndig, Sundeep Salvi
Imperial:
Paul Elliot, Mireille Toledano, Liza
Selley, Toby Athersuch

Routes to Clean Air 2015 - Dr Ian Mudway

  • 1.
    Dr Ian Mudway HealthEffects of Air Pollution ian.mudway@kcl.ac.uk
  • 3.
    Additives Nitrogen dioxides (incl.NO2), ozone, particulate matter, volatile organic carbon compounds. PM associated chemicals Nitrogen dioxides (incl. NO2), ozone, particulate matter (PNC, PM2.5, PM10, coarse PM), organic carbon, elemental carbon, volatile organic carbon compounds, quinones. PAHs, metals (Fe, Cu, Cr, V, Ni, Sb, As, Cd, Al, etc), stable radicals, SOA, POA, sulphate, nitrate, NaCl.
  • 4.
  • 5.
    But this iswhat happened
  • 6.
    Burden of diseasefrom 20 leading causes in 2010 Lim et al. LANCET (2012) Ambient air pollution (PM2.5): Globally: - 3.1 million deaths - ~ 3.0% of all DALYs In Western, Central and Eastern Europe: - 430,000 premature deaths; - over 7 million years of healthy life lost Lim et al. LANCET (2012)
  • 7.
    • 1000’s newhealth studies, reviews (2006-2015) • NPACT study (2013); ESCAPE (2013) • REVIHAAP (July 2013); HRAPIE (Dec 2013) • HEI Ultrafines report (2013) • WHO Black Carbon report (2012) • IARC Diesel exhaust reports (2013/2014) • WHO Burden of disease report (March 2014) What is already known
  • 8.
    Conclusions of theHEI Traffic Report 2010 Health outcome Association with traffic air pollution exposure Mortality All-cause & CV Sufficient Asthma & Respiratory – children Asthma onset & prevalence Asthma is more common in children living in the street buffers with the highest concentration of traffic-related pollutants Exacerbation of asthma symptoms Children living in hot spots of traffic-related pollution experience more symptoms and exacerbations Sufficient Sufficient Asthma & Respiratory – Adults Adult onset of asthma (one study) Exacerbation of asthma symptoms (few studies) Hospitalisation rates Insufficient Suggestive but not sufficient Insufficient Lung function Living in proximity to high concentration of traffic air pollution may be associated with reduced lung function Suggestive but not sufficient
  • 9.
    Meta-analysis of theassociation between long- term exposure to PM2.5 and all-cause mortality Hoek et al, EnvHealth 2013 These are all, by and large, associations derived from old cohorts exposed to historic levels of air pollution. What do they tell us about contemporary exposures?
  • 10.
    Black Carbon –a better health indictor? Toxic component or source indicator? Estimated county- and season- specific relative risks (RR) of cardiovascular and respiratory hospitalization associated with PM2.5 components in 106 U.S. counties for the years 1999 through 2005 Janssen et al, Environ Health Perspect, 2011 Systematic review and meta-analysis of health effects of BC compared with PM mass based on data from time-series studies and cohort studies that measured both exposures
  • 11.
    Controlled Diesel Exposures Exposureto DE: PM10 300µg/m3 and filtered air for 1 hour & 100µg/m3 and filtered air for 2 hours
  • 12.
    Diesel induces inflammationin vivo Neutrophils after air Neutrophils after DE • Inflammation • Impaired lung function • Injury/remodelling • Impaired microbial defences • Carcinogenic constituents • Blood viscosity • Promotes atherosclerosis • Impaired vascular function • Ischaemia • Arrhythmias
  • 13.
    How does airpollution impact o children’s development?
  • 14.
    NO2 in TowerHamlets & Hackney
  • 15.
    Internal dose ofblack carbon
  • 16.
    16 Impaired lung growth Gaudermanet al, 2004 (NEJM); southern California - 1,759 10-yr old children, 12 communities, 8-yr follow up - Lung function growth significantly reduced in areas with higher levels of traffic-related pollutants - NO2, PM2.5, elemental carbon (EC) associated with reduction in growth of FEV1 of between 79.7 and 101.4 mL - Clinically low FEV1 at age 18 positively correlated with level of exposure to NO2, PM10, PM2.5, EC
  • 17.
    Gauderman et al,NEJM, 351: 1057-67, 2004 - 1.6% at lowest level of PM2.5 exposure - 7.9% at highest level of PM2.5 exposure (4.9x higher) Clinically low FEV1 at age 18 yrs
  • 18.
    18 Impaired lung growth Gaudermanet al, 2004 (NEJM); southern California - 1,759 10-yr old children, 12 communities, 8-yr follow up - Lung function growth significantly reduced in areas with higher levels of traffic-related pollutants - NO2, PM2.5, elemental carbon (EC) associated with reduction in growth of FEV1 of between 79.7 and 101.4 mL - Clinically low FEV1 at age 18 positively correlated with level of exposure to NO2, PM10, PM2.5, EC Gauderman et al, 2007 (Lancet); southern California -Same study, local vs. regional pollutant levels -Living <500m from freeway associated with reduction in FEV1 growth of 81mL (vs. living >1500m away) -Significantly lower attained FEV1 by 18 yrs
  • 19.
    Concerning news onthe Horizon
  • 20.
  • 21.
    PM2.5 air pollution& life expectancy in the US Pope et al, 2009 Reduction in PM2.5, 1980-2000 (μg/m3) Changeinlifeexpectancy,1980-2000(yr)
  • 22.
    Improvements in PM10(& PM2.5) reduces respiratory symptoms SAPALDIA Study, Schindler et al, 2009 New Cough Persistent Cough New Wheeze Persistent Wheeze
  • 24.
    John Evelyn 1620–1706 Cleaner Fuels Separate the vulnerable population from pollution sources Economic benefits Green infrastructure Moral imperative
  • 25.
    Acknowledgements Centre for PrimaryCare and Public Health, QMUL: Chris Griffiths, Jonathan Grigg, Robert Walton, Isobel Dundas, Stephen Bremner, Nadine Marlin, Louise Cross, Neeru Garg, Alex Nanzer, Yasmeen Hanifa, Harpal Kalsi, Tom Round, Peter Bridge, Ratna Sohanpal, Adam Briggs, Grace Tuaf Toro, Niki Jakeways, Dev Gadhvi, Seif Shaheen, Rossa Brugha, Grainne Colligan, Chinedu Nwokoro, Anna Schwappach, David McLaughlin, Neetha Purushotham, Hannah Smithers. Environmental Research Group, KCL: Frank Kelly, Helen Wood, Jeenath Jamaludin, Andrew Grieve, Esme Purdie, Layla Aitlhadj, Eleanor Smith, Erik Van Nunen, Ben Barratt, Sean Beevers. Umea, Sweden: Anders Blomerg, Thomas Sandstrom, Annelie Behndig, Sundeep Salvi Imperial: Paul Elliot, Mireille Toledano, Liza Selley, Toby Athersuch