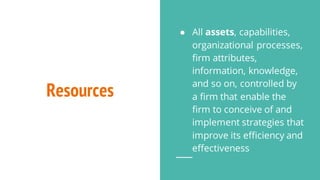
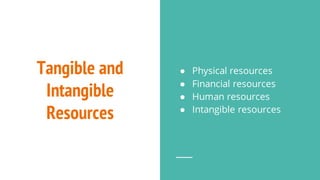
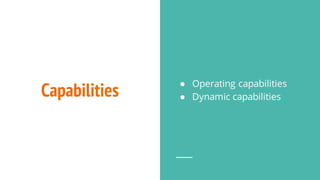
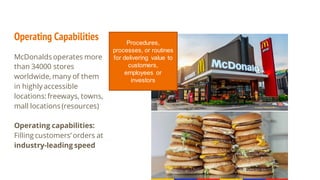
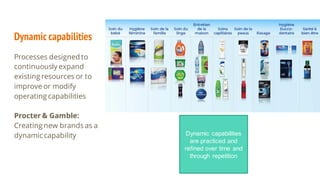
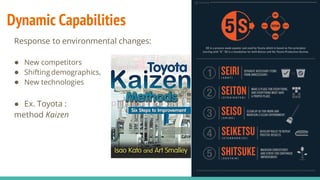
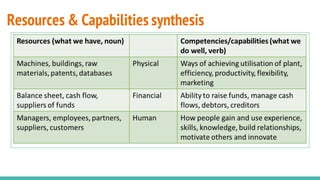
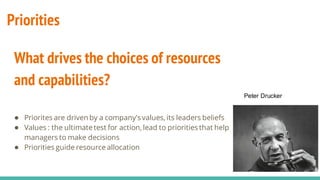
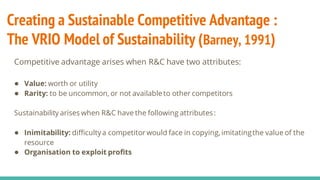
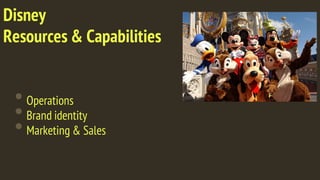
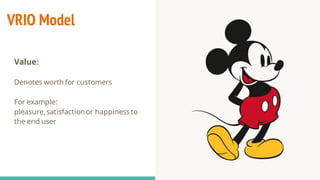
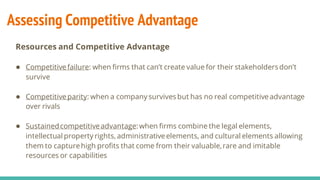
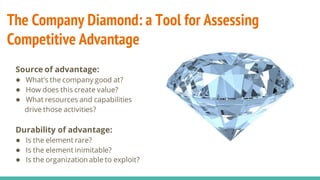
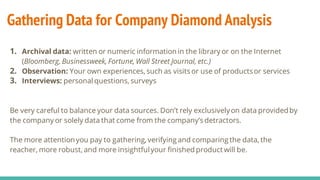
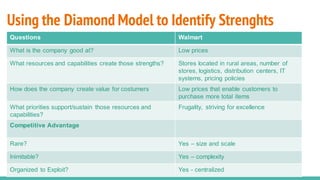
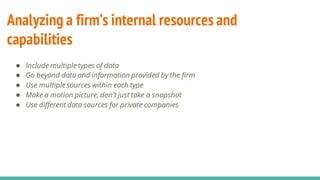
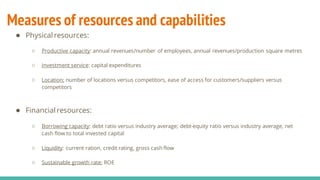
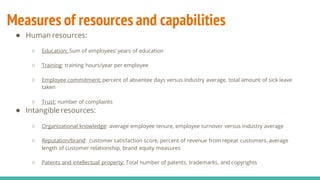
The document discusses resources and capabilities as internal abilities that allow firms to succeed. It defines resources as tangible and intangible assets that firms can use to implement strategies, and capabilities as operating routines and dynamic processes for adapting resources. Examples include McDonald's efficient operating capabilities and Toyota's continuous improvement processes. Priorities are guided by values and influence resource allocation. The VRIO model assesses if resources provide competitive advantage by being valuable, rare, inimitable, and exploitable. Firms must analyze their resources and capabilities using multiple data sources to understand strengths and competitive positions.
5. Resources
● All assets, capabilities,
organizational processes,
firm attributes,
information, knowledge,
and so on, controlled by
a firm that enable the
firm to conceive of and
implement strategies that
improve its efficiency and
effectiveness
8. Operating Capabilities
McDonalds operates more
than 34000 stores
worldwide, many of them
in highly accessible
locations:freeways, towns,
mall locations (resources)
Operating capabilities:
Filling customers’ orders at
industry-leading speed
Procedures,
processes, or routines
for delivering value to
customers,
employees or
investors
9. Dynamic capabilities
Processes designed to
continuously expand
existing resources or to
improve or modify
operating capabilities
Procter & Gamble:
Creating new brands as a
dynamic capability Dynamic capabilities
are practiced and
refined over time and
through repetition
10. Dynamic Capabilities
Response to environmental changes:
● New competitors
● Shifting demographics,
● New technologies
● Ex. Toyota :
method Kaizen
11. Dynamic Capabilities
Reinforcing competitive advantage:
● Complex connections and coordination among different internal units within the firm
● Take time to develop and require significantlearning
13. Priorities
What drives the choices of resources
and capabilities?
● Priorites are driven by a company’s values, its leaders beliefs
● Values : the ultimatetest for action, lead to priorities that help
managers to make decisions
● Priorities guide resource allocation
Peter Drucker
15. Values & Priorities at Pixar
•Steve Jobs by Pixar Studios in 1986
•Refocus on computer generated animated
movies
•Toy Story, Bug’s life, Monter’s Inc., Finding
Nemo, Cars, Up
•Values : innovation and creativity
•Innovation is sparked when creative people get
together and share ideas
•Priority : Interaction (workspace architecture
favouring creative and unplanned collaboration)
16. Values & Priorities at Pixar
Promoting interaction for
innovation and creativity
John
Lasseter –
Chief Creative
Officer
17. Creating a Sustainable Competitive Advantage :
The VRIO Model of Sustainability (Barney, 1991)
Competitive advantage arises when R&C have two attributes:
● Value: worth or utility
● Rarity: to be uncommon, or not availableto other competitors
Sustainability arises when R&C have the following attributes:
● Inimitability: difficultya competitor would face in copying, imitatingthe value of the
resource
● Organisation to exploit profits
18. Creating a Sustainable Competitive Advantage :
The VRIO Model of Sustainability
Don’t mess
with the
mouse!
21. VRIO Model
Rare:
To be uncommon, uniqueor not
available for competitors
For example:
McDonalds locations for its restaurants
22. VRIO Model
Inimitability:
The extent to which competitors cannot
easily reproduce a product by
employing equal, or equivalent, sources
of value in their own products and
services
For example, football star players
29. VRIO Model
Organized to exploit
The degree to which the legal,
administrative,and operating structure
of the firm allows it to capture the rents
generated by resources
31. Assessing Competitive Advantage
Resources and Competitive Advantage
● Competitive failure: when firms that can’t create value for their stakeholdersdon’t
survive
● Competitive parity: when a company survives but has no real competitiveadvantage
over rivals
● Sustainedcompetitiveadvantage:when firms combine the legal elements,
intellectual property rights, administrativeelements, and cultural elements allowing
them to capturehigh profits that come from their valuable,rare and imitable
resources or capabilities
32. The Company Diamond: a Tool for Assessing
Competitive Advantage
Source of advantage:
● What’s the company good at?
● How does this create value?
● What resources and capabilities
drive those activities?
Durability of advantage:
● Is the element rare?
● Is the element inimitable?
● Is the organization able to exploit?
33. Gathering Data for Company Diamond Analysis
1. Archival data: written or numeric information in the library or on the Internet
(Bloomberg, Businessweek, Fortune, Wall Street Journal, etc.)
2. Observation: Your own experiences, such as visits or use of productsor services
3. Interviews: personal questions, surveys
Be very careful to balance your data sources. Don’t rely exclusivelyon data providedby
the company or solely data that come from the company’s detractors.
The more attentionyou pay to gathering, verifying and comparing the data, the
reacher, more robust, and more insightfulyour finished product will be.
34. Using the Diamond Model to Identify Strenghts
Questions Walmart
What is the company good at? Low prices
What resources and capabilities create those strengths? Stores located in rural areas, number of
stores, logistics, distribution centers, IT
systems, pricing policies
How does the company create value for costumers Low prices that enable customers to
purchase more total items
What priorities support/sustain those resources and
capabilities?
Frugality, striving for excellence
Competitive Advantage
Rare? Yes – size and scale
Inimitable? Yes – complexity
Organized to Exploit? Yes - centralized
35. Analyzing a firm’s internal resources and
capabilities
● Include multiple types of data
● Go beyond data and information provided by the firm
● Use multiplesources within each type
● Make a motion picture, don’t just take a snapshot
● Use different data sources for private companies
36. Measures of resources and capabilities
● Physical resources:
○ Productive capacity: annual revenues/number of employees, annual revenues/production square metres
○ Investment service: capital expenditures
○ Location: number of locations versus competitors, ease of access for customers/suppliers versus
competitors
● Financial resources:
○ Borrowing capacity: debt ratio versus industry average; debt-equity ratio versus industry average, net
cash flow to total invested capital
○ Liquidity: current ration, credit rating, gross cash flow
○ Sustainable growth rate: ROE
37. Measures of resources and capabilities
● Human resources:
○ Education: Sum of employees’ years of education
○ Training: training hours/year per employee
○ Employee commitment: percent of absentee days versus industry average, total amount of sick leave
taken
○ Trust: number of complaints
● Intangible resources:
○ Organizational knowledge: average employee tenure, employee turnover versus industry average
○ Reputation/brand: customer satisfaction score, percent of revenue from repeat customers, average
length of customer relationship, brand equity measures
○ Patents and intellectual property: Total number of patents, trademarks, and copyrights
38. Measures of resources and capabilities
● Capabilities:
○ Raw material and logistics: exclusive control over raw material supplies (ownership), size and dispersion
of distribution network, distribution costs
○ R&D: revenue from products less than 5 years old, number of new products introduced annually, R&D
expenditures
○ Product design: design awards, presence of unique design features versus industry competitors
○ Manufacturing: average plant size versus industry average, manufacturing costs/total sales, unique plant
layouts, designs or workflows versus competitors
○ Technology: sophistication of website versus close competitors
○ Financing: cash flow position versus industry average, earnings before interest, taxes depreciation and
amortization (EBITDA) versus industry average
○ Sales and marketing: advertising expenses versus industry average, advertising awards won, breadth and
depth of product line versus competitors
40. This training material is part of the FogGuru project that has received funding from the European Union’s
Horizon 2020 research and innovation programme under the Marie Skłodowska-Curie grant agreement No
765452. The information and views set out in this material are those of the author(s) and do not necessarily
reflect the official opinion of the European Union. Neither the European Union institutions and bodies nor any
person acting on their behalf may be held responsible for the use which may be made of the information
contained therein.