1) The document describes steps to prepare data in Microsoft Excel for analysis in IBM SPSS. It involves changing sex variables from text to numeric, exporting the Excel file to a text file for SPSS, and opening the file in SPSS.
2) Descriptive statistics are calculated in SPSS, including measures of central tendency, variability, and normality. Percentiles and z-scores are also computed.
3) Further computations include p-values using z-scores and percentile ranks. The outputs are examined and files are saved.
How to use SPSS (Statistical Package for Social Science) data. This software program is extensively used for Social Science data analysis. However it is also used by managers, scholars and Engineers also. In this document how to use SPSS for data analysis is explained step by step.
How to use SPSS (Statistical Package for Social Science) data. This software program is extensively used for Social Science data analysis. However it is also used by managers, scholars and Engineers also. In this document how to use SPSS for data analysis is explained step by step.
DBM380 v14Create a DatabaseDBM380 v14Page 2 of 2Create a D.docxedwardmarivel
DBM/380 v14
Create a Database
DBM/380 v14
Page 2 of 2Create a Database
The following assignment is based on the business scenario for which you created both an entity-relationship diagram and a normalized database design in Week 2.
For this assignment, you will create multiple related tables that match your normalized database design. In other words, you will implement a physical design (an actual, usable database) based on a logical design.
Refer to the linked W3Schools.com articles “SQL CREATE TABLE Statement,” “SQL PRIMARY KEY Constraint,” “SQL FOREIGN KEY Constraint,” and “SQL INSERT INTO Statement” for help in completing this assignment.
Note: In the industry, even the most carefully thought out database designs can contain mistakes. Feel free to correct in your tables any mistakes you notice in your normalized database design. Also, note that in Microsoft® Access®, you follow the steps below to launch the SQL editor:
Figure 1. To create a SQL query in Microsoft® Access®, begin by clicking the CREATE tab.
To Complete This Assignment:
1. Use the CREATE TABLE statement to create each table in your design. Note that a table in a RDMS corresponds to an entity in an entity-relationship diagram. Recommended tables for this assignment are CUSTOMER, ORDER, ORDER_DETAIL, PRODUCT, EMPLOYEE, and STORE.
2. As part of each CREATE TABLE statement, define all of the columns, or fields, that you want each particular table to contain. Give them short, meaningful names and include constraints; that is, describe what type of data each column (field) is allowed to hold and any other constraints, such as size, range, or uniqueness.
3. Note that any field you marked as a unique identifier in your normalized database design is a key field. Key fields must be described as both UNIQUE and NOT NULL, which means a value must exist for each record and that value must be unique across all records.
4. After you have created all six tables, including relationships between the tables as appropriate (matching the primary key in one table to a foreign key in another table), use the INSERT INTO statement to insert 10 records into each of your tables. You will need to make up the data you insert into your tables. For example, to insert one record into the CUSTOMER table, you will need to invent a customer number, a customer name, and so on—one value for each of the fields you defined for the CUSTOMER table—to insert into the table.
5. To ensure that your INSERT INTO statements succeeded in populating your tables, use the SELECT statement described in Ch. 7, “Introduction to Structured Query Language,” in Database Systems: Design, Implementation, and Management.to retrieve the records you inserted. For example, to see all 10 records you inserted into the CUSTOMER table, you might apply the following SQL statement: SELECT * FROM CUSTOMER;
After you have created all six tables and populated ten records in each table, submit to the Assignment Files tab the database containin.
At the end of this Lesson (Part 1) the students should be able to know the following
Introduction
Data Entry
Variable and Value Label
Entering Data
File management
Descriptive statistics
Editing and modifying the data
In this tutorial, we discuss how to do a regression analysis in Excel. I will teach you how to activate the regression analysis feature, what are the functions and methods we can use to do a regression analysis in Excel and most importantly, how to interpret the regression analysis results. Source: https://tinytutes.com/tutorials/regression-analysis-in-excel/
Using microsoft excel for weibull analysisMelvin Carter
A simple introduction to reliability analysis of components. Though this lacks explanations of the calculated steps it shows how simple analysis can be. Note that it only addresses the Weibull distribution. It does share how to look elsewhere if the Weibull shape parameter is not near the ideal three(3).
Since the instructions for the final project are standardized and .docxedgar6wallace88877
Since the instructions for the final project are standardized and provided by the department, I thought you might appreciate some pointers and key areas of focus to help you navigate this project! Use this in conjunction with your syllabus instructions, which contain detailed content instructions.
Read the syllabus instructions VERY carefully, pay attention to the requirements embedded in the sentences. In fact, I would construct each heading and subheading (YES, use APA formatted subheadings) according to the required areas listed in your instructions. Here are some formatting directions for subheadings and a rough example for organization of your project with subheadings.
APA Headings Level Formatting Guidelines:
1 Centered, Boldface, Uppercase and Lowercase
2 Left-aligned, Boldface, Uppercase and Lowercase Heading
3 Indented, boldface, lowercase heading with a period. Begin body text after the period.
4 Indented, boldface, italicized, lowercase heading with a period. Begin body text after the period.
5 Indented, italicized, lowercase heading with a period. Begin body text after the period.
Example:
1st page is the TITLE PAGE with Running head- refer to APA guidelines
See how I used proper capitalization for my running head?
Running head: GENDER TRAINING IN THE WORKPLACE
2nd page and remaining pages... The body of your project training program and report. Look up APA formatting: double space entire body, font 12-Times New Roman, 1” margins all sides. Make sure you use proper APA citations in the text (McCarty, 2016) and that those resources are listed on the reference page, including the journal and website citations that you chose.
Introduction and Identification of Problems (1st level)
Participant Name and Problem #1
(You will do this 12 times) (2nd level subheading, left justified, paragraph begins
next line after heading-double space. I will not double space the rest of this example to save space, but don’t forget to do it! Make sure you check your settings to be a true double space-nothing less and nothing more)
Training Program: Session One (8 of these)
Session One Title (2nd level)
Gender and Hostility in the Workplace
Objectives (2nd level)
The goal of this course is to
· define gender,
· define hostility,
· identify areas of hostility…(You can use bullets and or level three subheadings to list/organize).
Problem (2nd level)
State the participants problem(s) you will address with this session
Journal articles and websites
Journal. List one or more peer review (ACADEMIC) article(s) that is relevant to the issue/problem using an APA formatted reference.
Website. List one website that is relevant to the issue/problem and put into APA formatted reference.
Activity
Create and describe an activity that will promote discussion and understanding among the participants.
Activity breakdown. (3rd level subheading). Start text after period. You might want to use this 3rd level subheadin.
How to Create Map Views in the Odoo 17 ERPCeline George
The map views are useful for providing a geographical representation of data. They allow users to visualize and analyze the data in a more intuitive manner.
The Roman Empire A Historical Colossus.pdfkaushalkr1407
The Roman Empire, a vast and enduring power, stands as one of history's most remarkable civilizations, leaving an indelible imprint on the world. It emerged from the Roman Republic, transitioning into an imperial powerhouse under the leadership of Augustus Caesar in 27 BCE. This transformation marked the beginning of an era defined by unprecedented territorial expansion, architectural marvels, and profound cultural influence.
The empire's roots lie in the city of Rome, founded, according to legend, by Romulus in 753 BCE. Over centuries, Rome evolved from a small settlement to a formidable republic, characterized by a complex political system with elected officials and checks on power. However, internal strife, class conflicts, and military ambitions paved the way for the end of the Republic. Julius Caesar’s dictatorship and subsequent assassination in 44 BCE created a power vacuum, leading to a civil war. Octavian, later Augustus, emerged victorious, heralding the Roman Empire’s birth.
Under Augustus, the empire experienced the Pax Romana, a 200-year period of relative peace and stability. Augustus reformed the military, established efficient administrative systems, and initiated grand construction projects. The empire's borders expanded, encompassing territories from Britain to Egypt and from Spain to the Euphrates. Roman legions, renowned for their discipline and engineering prowess, secured and maintained these vast territories, building roads, fortifications, and cities that facilitated control and integration.
The Roman Empire’s society was hierarchical, with a rigid class system. At the top were the patricians, wealthy elites who held significant political power. Below them were the plebeians, free citizens with limited political influence, and the vast numbers of slaves who formed the backbone of the economy. The family unit was central, governed by the paterfamilias, the male head who held absolute authority.
Culturally, the Romans were eclectic, absorbing and adapting elements from the civilizations they encountered, particularly the Greeks. Roman art, literature, and philosophy reflected this synthesis, creating a rich cultural tapestry. Latin, the Roman language, became the lingua franca of the Western world, influencing numerous modern languages.
Roman architecture and engineering achievements were monumental. They perfected the arch, vault, and dome, constructing enduring structures like the Colosseum, Pantheon, and aqueducts. These engineering marvels not only showcased Roman ingenuity but also served practical purposes, from public entertainment to water supply.
Read| The latest issue of The Challenger is here! We are thrilled to announce that our school paper has qualified for the NATIONAL SCHOOLS PRESS CONFERENCE (NSPC) 2024. Thank you for your unwavering support and trust. Dive into the stories that made us stand out!
Model Attribute Check Company Auto PropertyCeline George
In Odoo, the multi-company feature allows you to manage multiple companies within a single Odoo database instance. Each company can have its own configurations while still sharing common resources such as products, customers, and suppliers.
Synthetic Fiber Construction in lab .pptxPavel ( NSTU)
Synthetic fiber production is a fascinating and complex field that blends chemistry, engineering, and environmental science. By understanding these aspects, students can gain a comprehensive view of synthetic fiber production, its impact on society and the environment, and the potential for future innovations. Synthetic fibers play a crucial role in modern society, impacting various aspects of daily life, industry, and the environment. ynthetic fibers are integral to modern life, offering a range of benefits from cost-effectiveness and versatility to innovative applications and performance characteristics. While they pose environmental challenges, ongoing research and development aim to create more sustainable and eco-friendly alternatives. Understanding the importance of synthetic fibers helps in appreciating their role in the economy, industry, and daily life, while also emphasizing the need for sustainable practices and innovation.
Operation “Blue Star” is the only event in the history of Independent India where the state went into war with its own people. Even after about 40 years it is not clear if it was culmination of states anger over people of the region, a political game of power or start of dictatorial chapter in the democratic setup.
The people of Punjab felt alienated from main stream due to denial of their just demands during a long democratic struggle since independence. As it happen all over the word, it led to militant struggle with great loss of lives of military, police and civilian personnel. Killing of Indira Gandhi and massacre of innocent Sikhs in Delhi and other India cities was also associated with this movement.
1. Workshop in Creating Normative Group
Seminar – Workshop 1
In these exercises, you will be using the Microsoft Excel and IBM SPSS softwares. In the
first few steps, you will be preparing the data for SPSS using Microsoft Excel.
A. Opening the Spreadsheets containing the Data
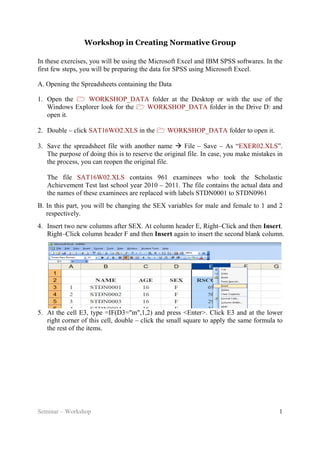
1. Open the WORKSHOP_DATA folder at the Desktop or with the use of the
Windows Explorer look for the WORKSHOP_DATA folder in the Drive D: and
open it.
2. Double – click SAT16WO2.XLS in the WORKSHOP_DATA folder to open it.
3. Save the spreadsheet file with another name File – Save – As “EXER02.XLS”.
The purpose of doing this is to reserve the original file. In case, you make mistakes in
the process, you can reopen the original file.
The file SAT16W02.XLS contains 961 examinees who took the Scholastic
Achievement Test last school year 2010 – 2011. The file contains the actual data and
the names of these examinees are replaced with labels STDN0001 to STDN0961
B. In this part, you will be changing the SEX variables for male and female to 1 and 2
respectively.
4. Insert two new columns after SEX. At column header E, Right–Click and then Insert.
Right–Click column header F and then Insert again to insert the second blank column.
5. At the cell E3, type =IF(D3="m",1,2) and press <Enter>. Click E3 and at the lower
right corner of this cell, double – click the small square to apply the same formula to
the rest of the items.
2. Workshop in Creating Normative Group
Seminar – Workshop 2
6. Highlight the range E3:E963, and then Right–click Copy. Click F3, and then Right
–Click Paste Special, choose Values under the Paste section. Click OK.
The numbers pasted on column F are simply values that do not include a formula.
3. Workshop in Creating Normative Group
Seminar – Workshop 3
7. Transfer the title “SEX” from D2 to F2. Delete the columns D and E. Click the
column headers D and E, Right – Click and choose Delete. Save your file.
The letters M and F are now replaced with 1 and 2, respectively.
C. In this part, you will be exporting the data from Microsoft Excel to IBM SPSS
8. Click File Save As. The File – Save As Dialog Appears. In the ‘Save as Type’
section, select ‘Text (Tab delimited)’. Filename is still ‘EXER02’. Then click Save.
9. Click the Yes button.
4. Workshop in Creating Normative Group
Seminar – Workshop 4
10. Click File Exit and then click No button.
11.Open IBM SPSS 16.0 or different version. If the opening window appears, just click
the Cancel button.
12.Click File Read Text Data.
5. Workshop in Creating Normative Group
Seminar – Workshop 5
13. The Open Data dialog box appears. Go the WORKSHOP_DATA folder and
look for ‘EXER02.TXT’ and then click the Open button.
14.The Text Import Wizard appears. Click Next in ‘Step 1 of 6’ window.
15.Click ‘Yes’ to answer the question “Are the variable names included at the top of
your file?. Then, click next.
6. Workshop in Creating Normative Group
Seminar – Workshop 6
16. Click Next on ‘Step 3 of 6’ to ‘Step 5 of 6’. Finally, click ‘Finish’ on ‘Step 6 of 6’.
17. Save your file as ‘EXER02.SAV.
D. In this part, you will obtain the Central Tendency and Variability of the raw scores of
the 961 examinees using IBM SPSS. This part will summarize the given data set. The
measures of central tendency and variability are critical components of other statistical
procedures.
18. Currently, the file ‘EXER02.SAV’ is open in IBM SPSS, from the ANALYZE menu
choose DESCRIPTIVE STATISTICS then choose FREQUENCIES.
19. Select the RSCORE variable and move it to the VARIABLE(S) box by clicking the
right arrow . Uncheck the box that says DISPLAY FREQUENCY TABLES.
7. Workshop in Creating Normative Group
Seminar – Workshop 7
Click on the STATISTICS button. Under CENTRAL TENDENCY check MODE,
MEDIAN, and MEAN. Under DISPERSION check RANGE, STANDARD
DEVIATION. Check SKEWNESS and KURTOSIS under DISTRIBUTION section,
and then click CONTINUE button.
20. Click CHARTS…, select HISTOGRAM and WITH NORMAL CURVE. Click the
CONTINUE button. Then click OK button.
21. View the output, and then save the viewer file as ‘EXER0201”. These are the
information you can see in the output.
8. Workshop in Creating Normative Group
Seminar – Workshop 8
Percentile Scores
Percentiles of the raw scores in
the “Cumulative Percent” column.
The SPSS output shows that Skewness (=
0.327) and Kurtosis (= –0.488) is less than + / –
1.0
This implies that RSCORE is normally
distributed, meaning Z–Scores can be used to
estimate the probability value.
Statistics data also shows:
Standard Deviation of 12.264
Mean of 42.91
E. In this part, you will obtain the Percentile scores of the 961 raw scores. This is the
second way of obtaining the percentile scores.
9. Workshop in Creating Normative Group
Seminar – Workshop 9
22. Sort the data set. Click DATA and SORT CASES. Move the RSCORE variable into
the SORT BY box. The SORT ORDER is ASCENDING. Then click OK.
Then you can see, the RSCORE values are sorted from lowest down to highest value.
23. Next, rank the RSCORE values by clicking TRANSFORM > RANK CASES. Move
the RSCORE into the VARIABLE box and then click OK. An additional column
“RRSCORE” is added showing the rank of the values in RSCORE.
You can set the decimal places to 0 of the values in column RRSCORE, by clicking
the VARIABLE VIEW tab. Save your file.
24. Then, compute the percentile by clicking TRANSFORM > COMPUTE VARIABLE.
Type “PRCNTL_SC” in the TARGET VARIABLE box. “PRCNTL_SC” will be the
label of the additional column. Select RRSCORE in the box and then click RIGHT
ARROW to move the variable RRSCORE into the NUMERIC EXPRESSION box.
10. Workshop in Creating Normative Group
Seminar – Workshop 10
Complete the whole expression by typing the remaining items. In this expression, we
subtract 0.5 from RRSCORE divided by the total cases of 961 and multiplied the
whole computation by 100. Then click OK.
You can adjust the number of decimal
places again. Just go to the
VARIABLE VIEW tab and edit the
PRCNTL_SC properties.
F. In this part, you will compute the Z–Scores which can be used to estimate the
probability value (p–value). You will also use the Z–Scores to compute the percentile
ranks.
((RRSCORE – 0.5)/961)* 100
11. Workshop in Creating Normative Group
Seminar – Workshop 11
Z–Scores are a transformation of individual raw scores into a standard form, where
the transformation is based on knowledge about the standardization sample’s mean
and standard deviation.
The formula for computing Z–scores is the individual raw score (X) minus the mean of
the scores obtained by the standardization sample (M), divided by the standard
deviation of scores obtained by the standardization sample (sd). Z–scores have a mean
of 0 and a standard deviation of 1. (BROCK, 2012).
Standard scores tell you how many standard deviation units above or below the mean
a value falls. A score that is one standard deviation below the mean has a Z–score of –
1. A score that is at the mean would have a Z–score of 0 and a score above the mean
will have a Z–score of +1.
25. To derive the Z–scores of RSCORE, click ANALYZE > DESCRIPTIVE
STATISTICS > DESCRIPTIVES. Click SAVE STANDARDIZED VALUES AS
VARIABLES. Move RSCORE into the VARIABLE box and click OK.
An additional column labeled “ZRSCORE” is shown.
The Histogram Section
26.Next, we can generate the HISTOGRAM of the Z–scores. Click GRAPHS >
LEGACY DIALOGS > HISTOGRAM. Select ZRSCORE and move it to
VARIABLE box at the right. Click DISPLAY NORMAL CURVE. Click OK.
12. Workshop in Creating Normative Group
Seminar – Workshop 12
The histogram of the raw scores using Z–scores.
The p – value Section.
27. To compute the p–value using the Z–scores. Click TRANSFORM > COMPUTE
VARIABLE. Type “P_ZSCORE” in the TARGET VARIABLE box. Select “CDF &
NONCENTRAL CDF” from the FUNCTION GROUP box. Select “CDFNORM”
function from the FUNCTIONS AND SPECIAL VARIABLES box. Click the up
arrow , select “ZSCORE (RSCORE) [ZRS..” from the variable box and click the
right arrow to replace the ? inside the function CDFNORM(?). Click OK.
Follow what is shown in the diagram.
13. Workshop in Creating Normative Group
Seminar – Workshop 13
The column labeled “P_ZSCORE” is added. This column contains the p–values for
the RSCORES.
The Percentile Rank Section
28. Click TRANSFORM > COMPUTE. Type “PRCTLRANK” in the TARGET
VARIABLE box. Select “CDF & NONCENTRAL CDF” from the FUNCTION
GROUP box. Select “CDF.NORMAL” function from the FUNCTIONS AND
SPECIAL VARIABLES box. Click the up arrow , select “ZSCORE (RSCORE)
[ZRS..” from the variable box and click the right arrow to replace the first “?”
inside the function CDF.NORMAL(?,?,?). Type “0” for the second “?” represents the
mean and type “1” for the third “?” representing standard deviation. Click OK.
CDF.NORMAL(ZSCORE,0,1)
14. Workshop in Creating Normative Group
Seminar – Workshop 14
The column labeled “PRCTLRANK” is added. This column contains the percentile
ranks of RSCORE.
Then SAVE your work.
References:
Brock, S. E. Descriptive Statistics and Psychological Testing. California State
University, Sacramento. Retrieved April 05, 2012.
Cohen, R. J., & Swerdlik, M. E. (2005). Psychological Testing and Assessment:
An Introduction to Tests and Measurement. (6th
Edition.) McGraw–Hill.
Zucker, S. (2003, December). Fundamentals of Standardized Testing. Retrieved
April 06, 2012 from http://www.hemweb.com.
15. Workshop in Creating Normative Group
Seminar – Workshop 15
Contents of SAT16WO2.XLS: