Download as PDF, PPTX

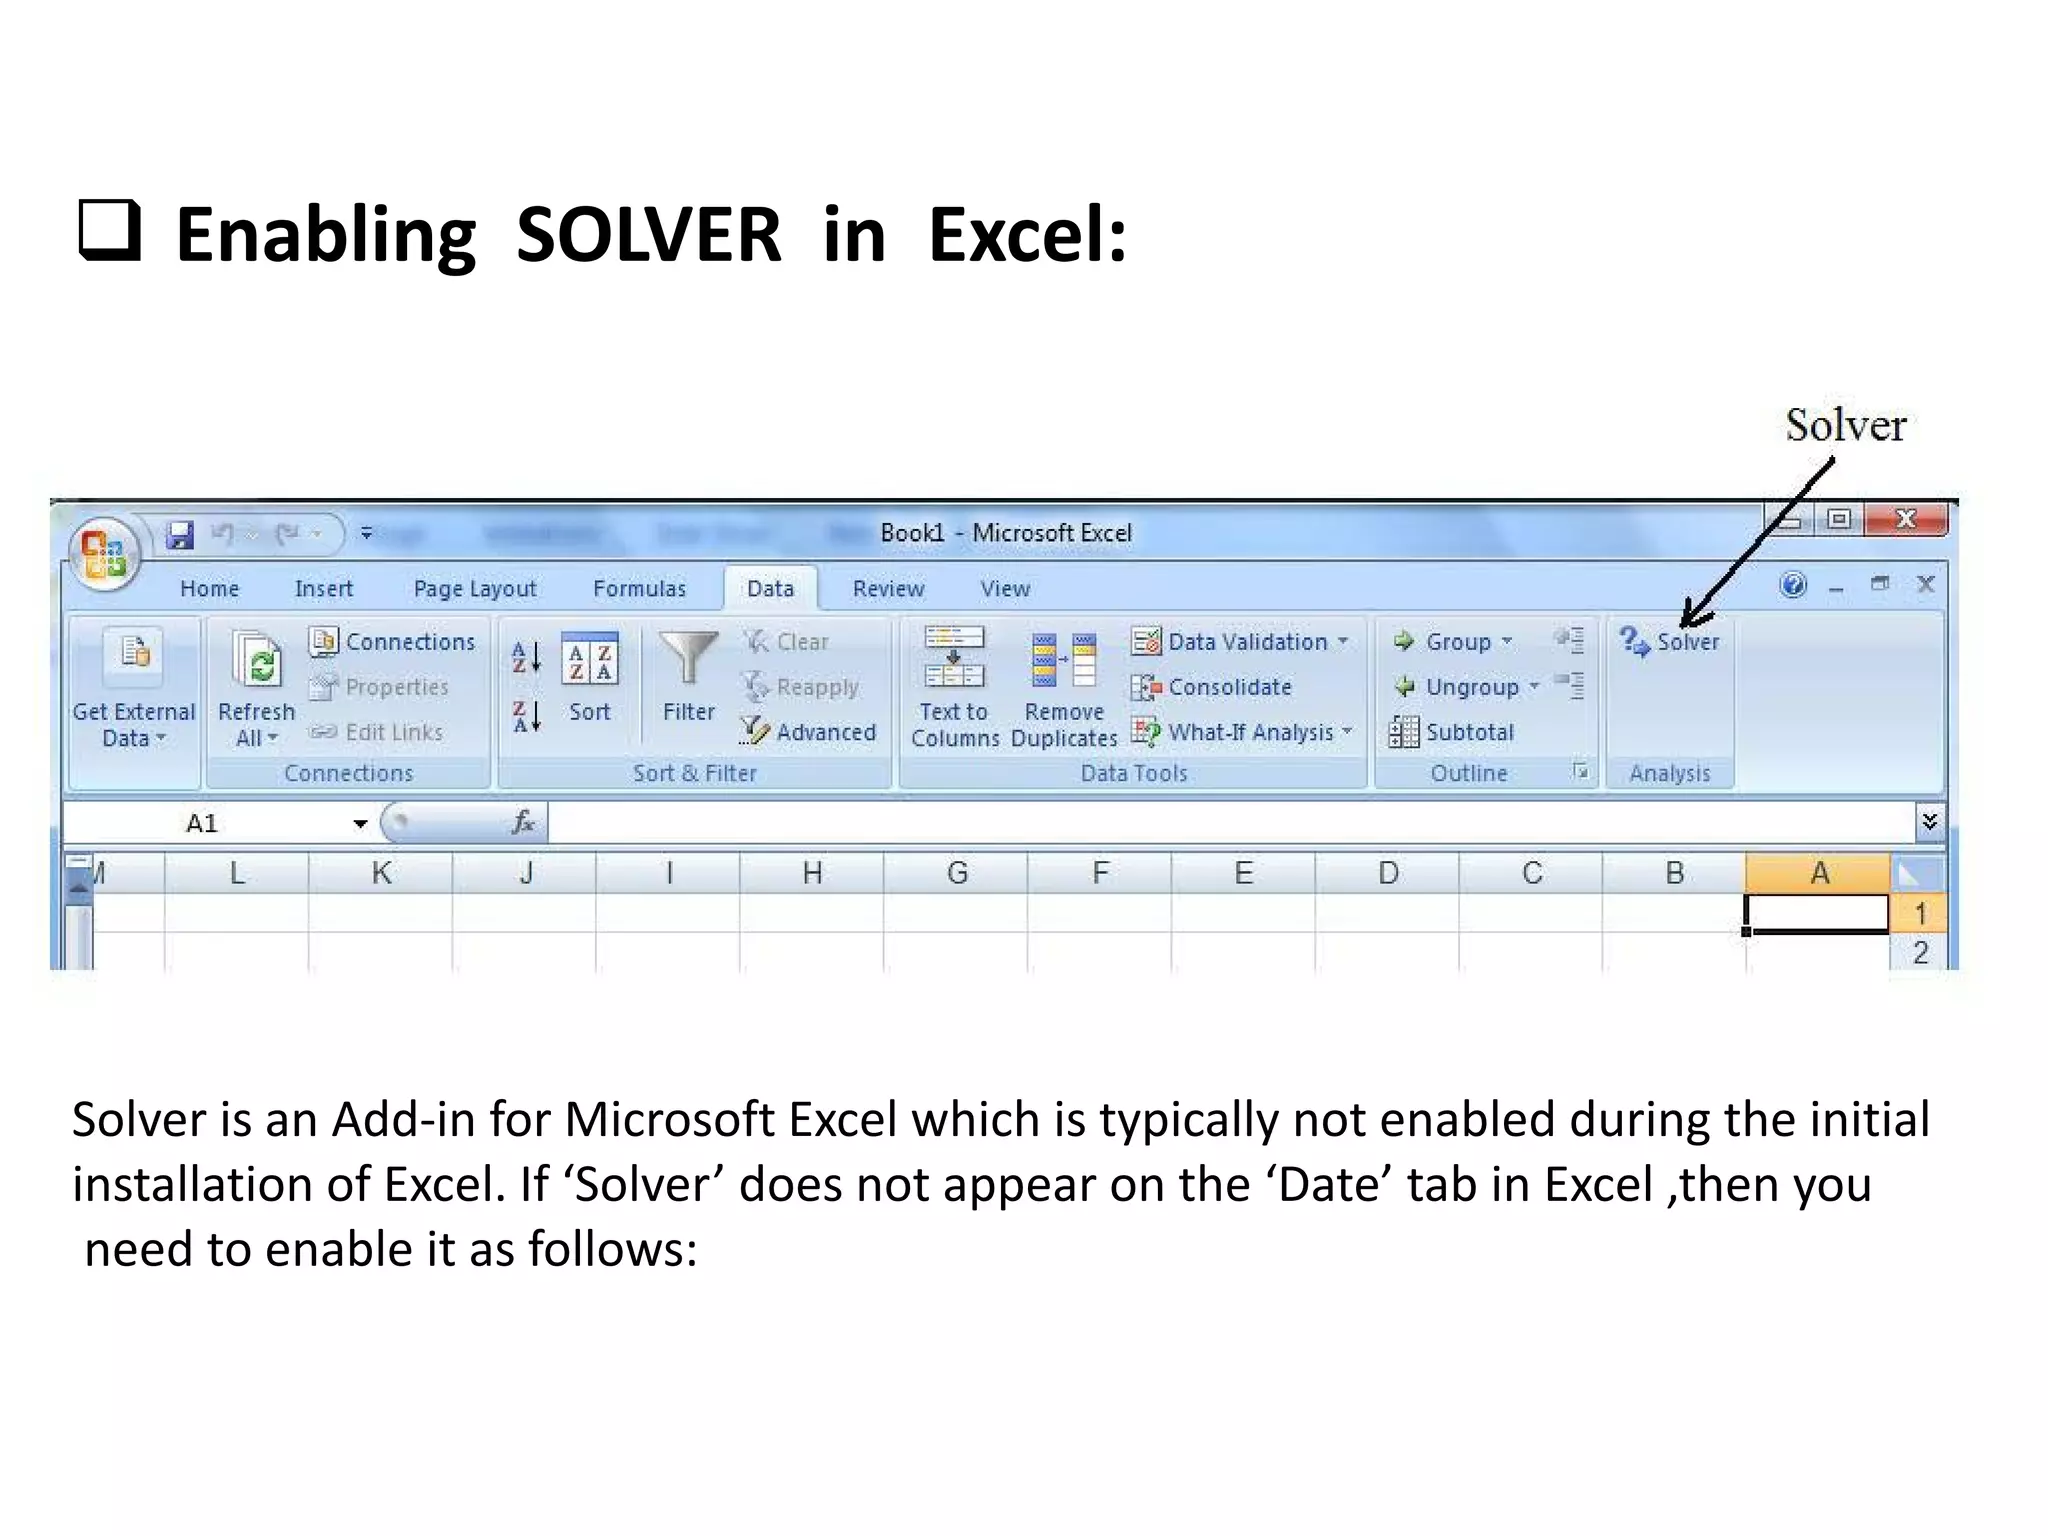


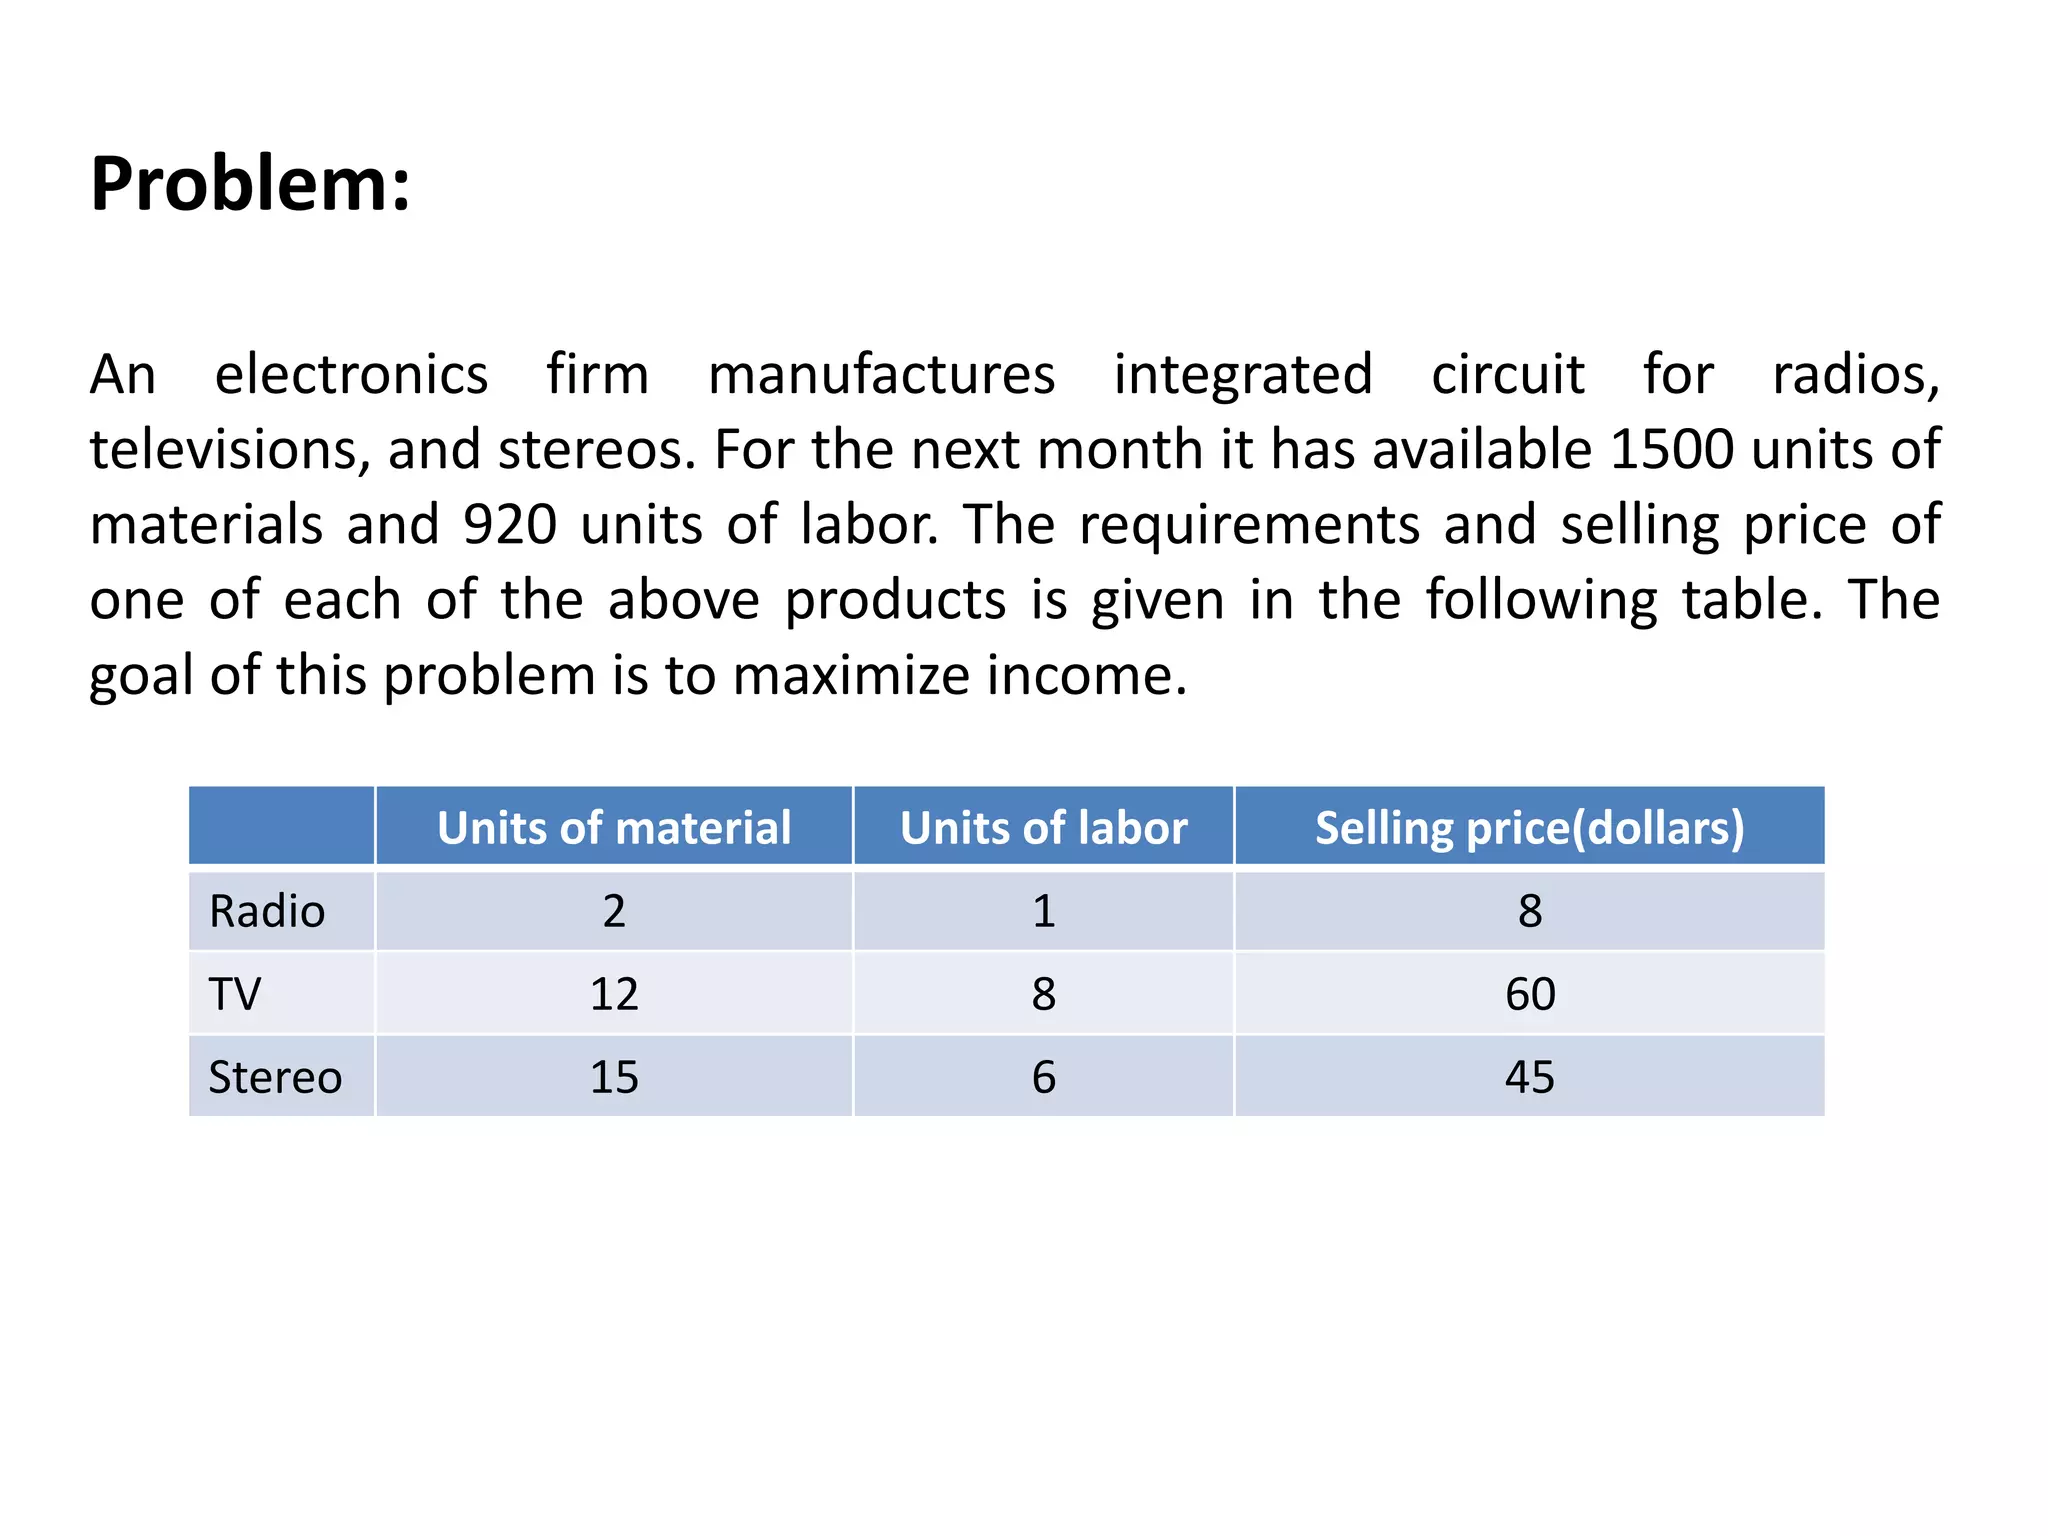
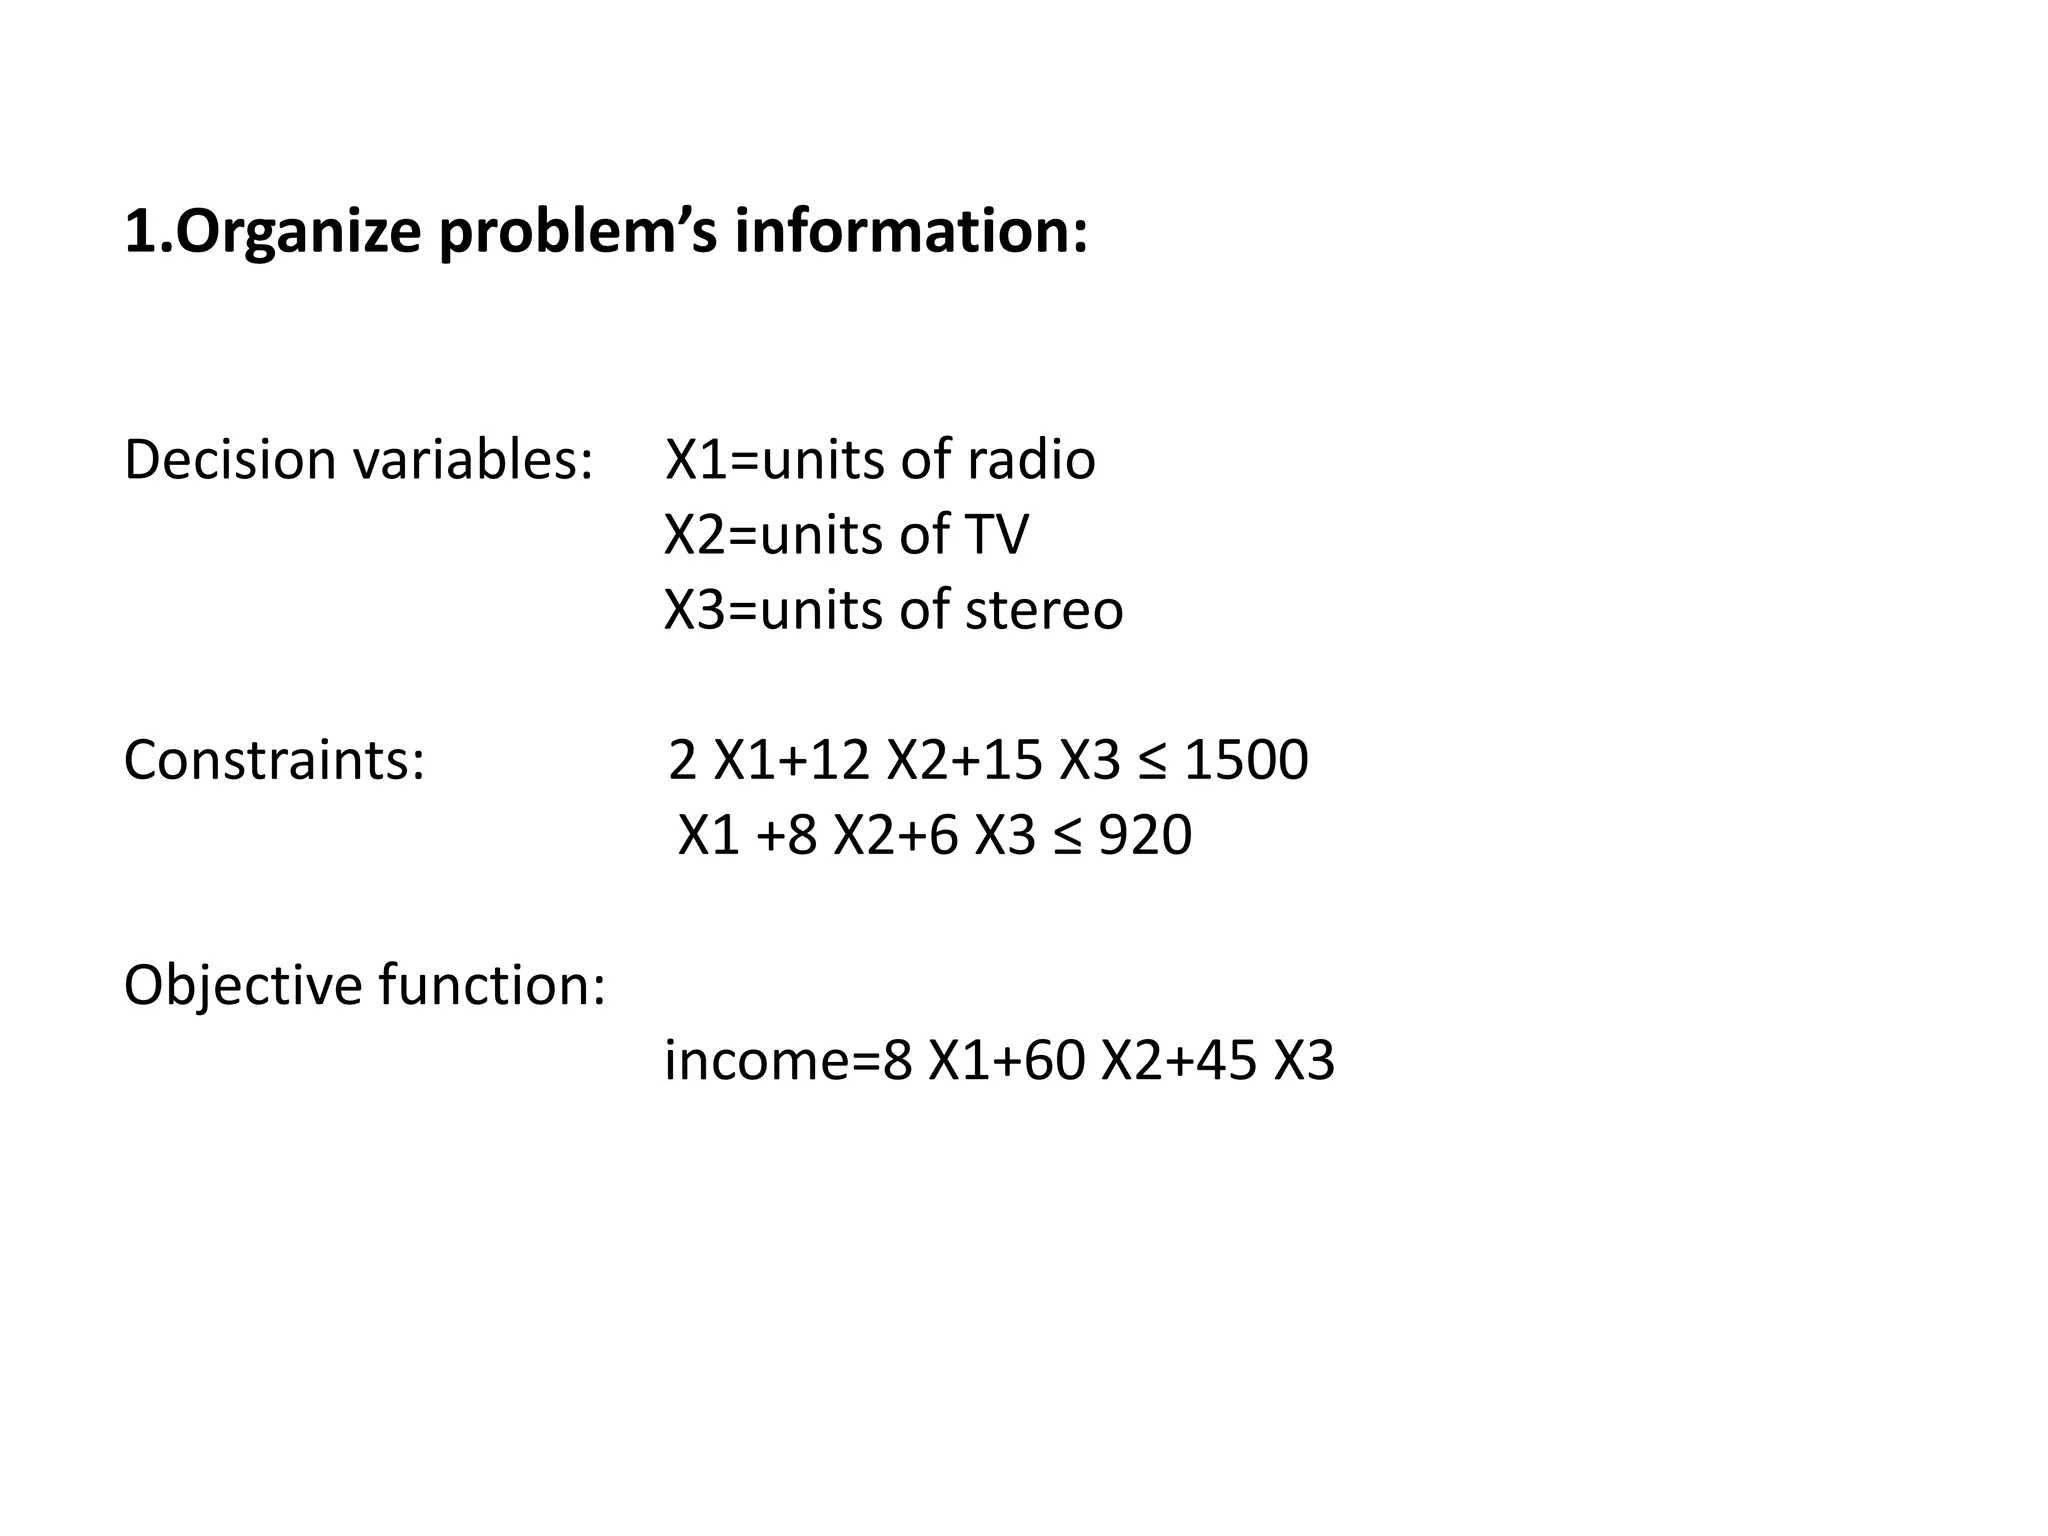
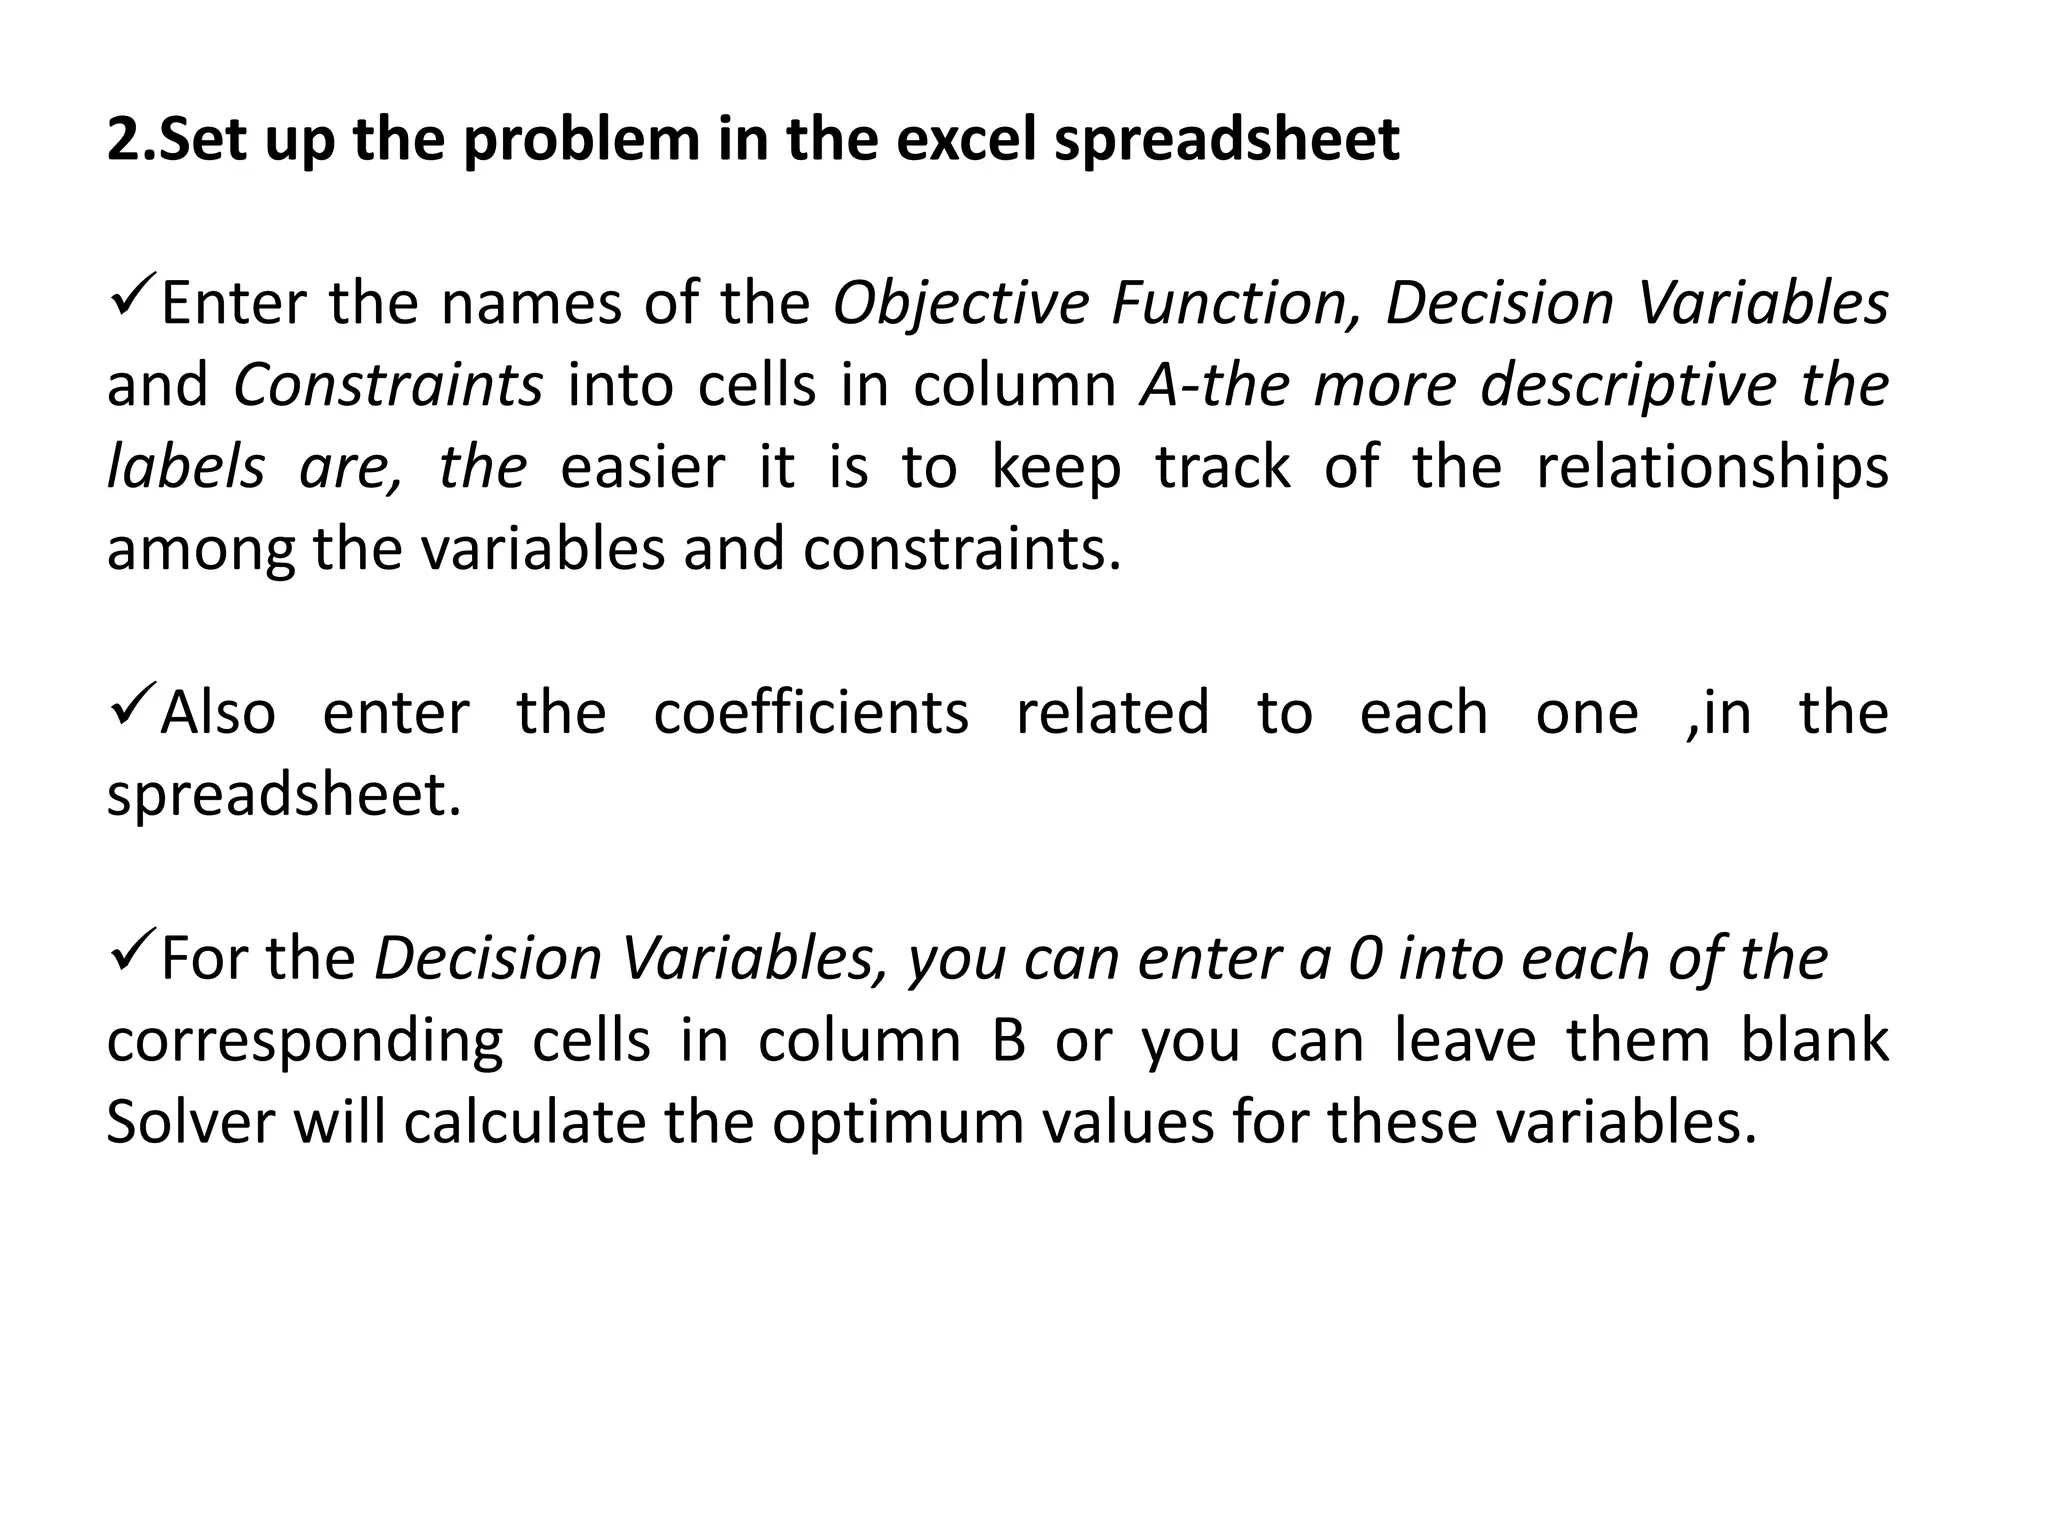
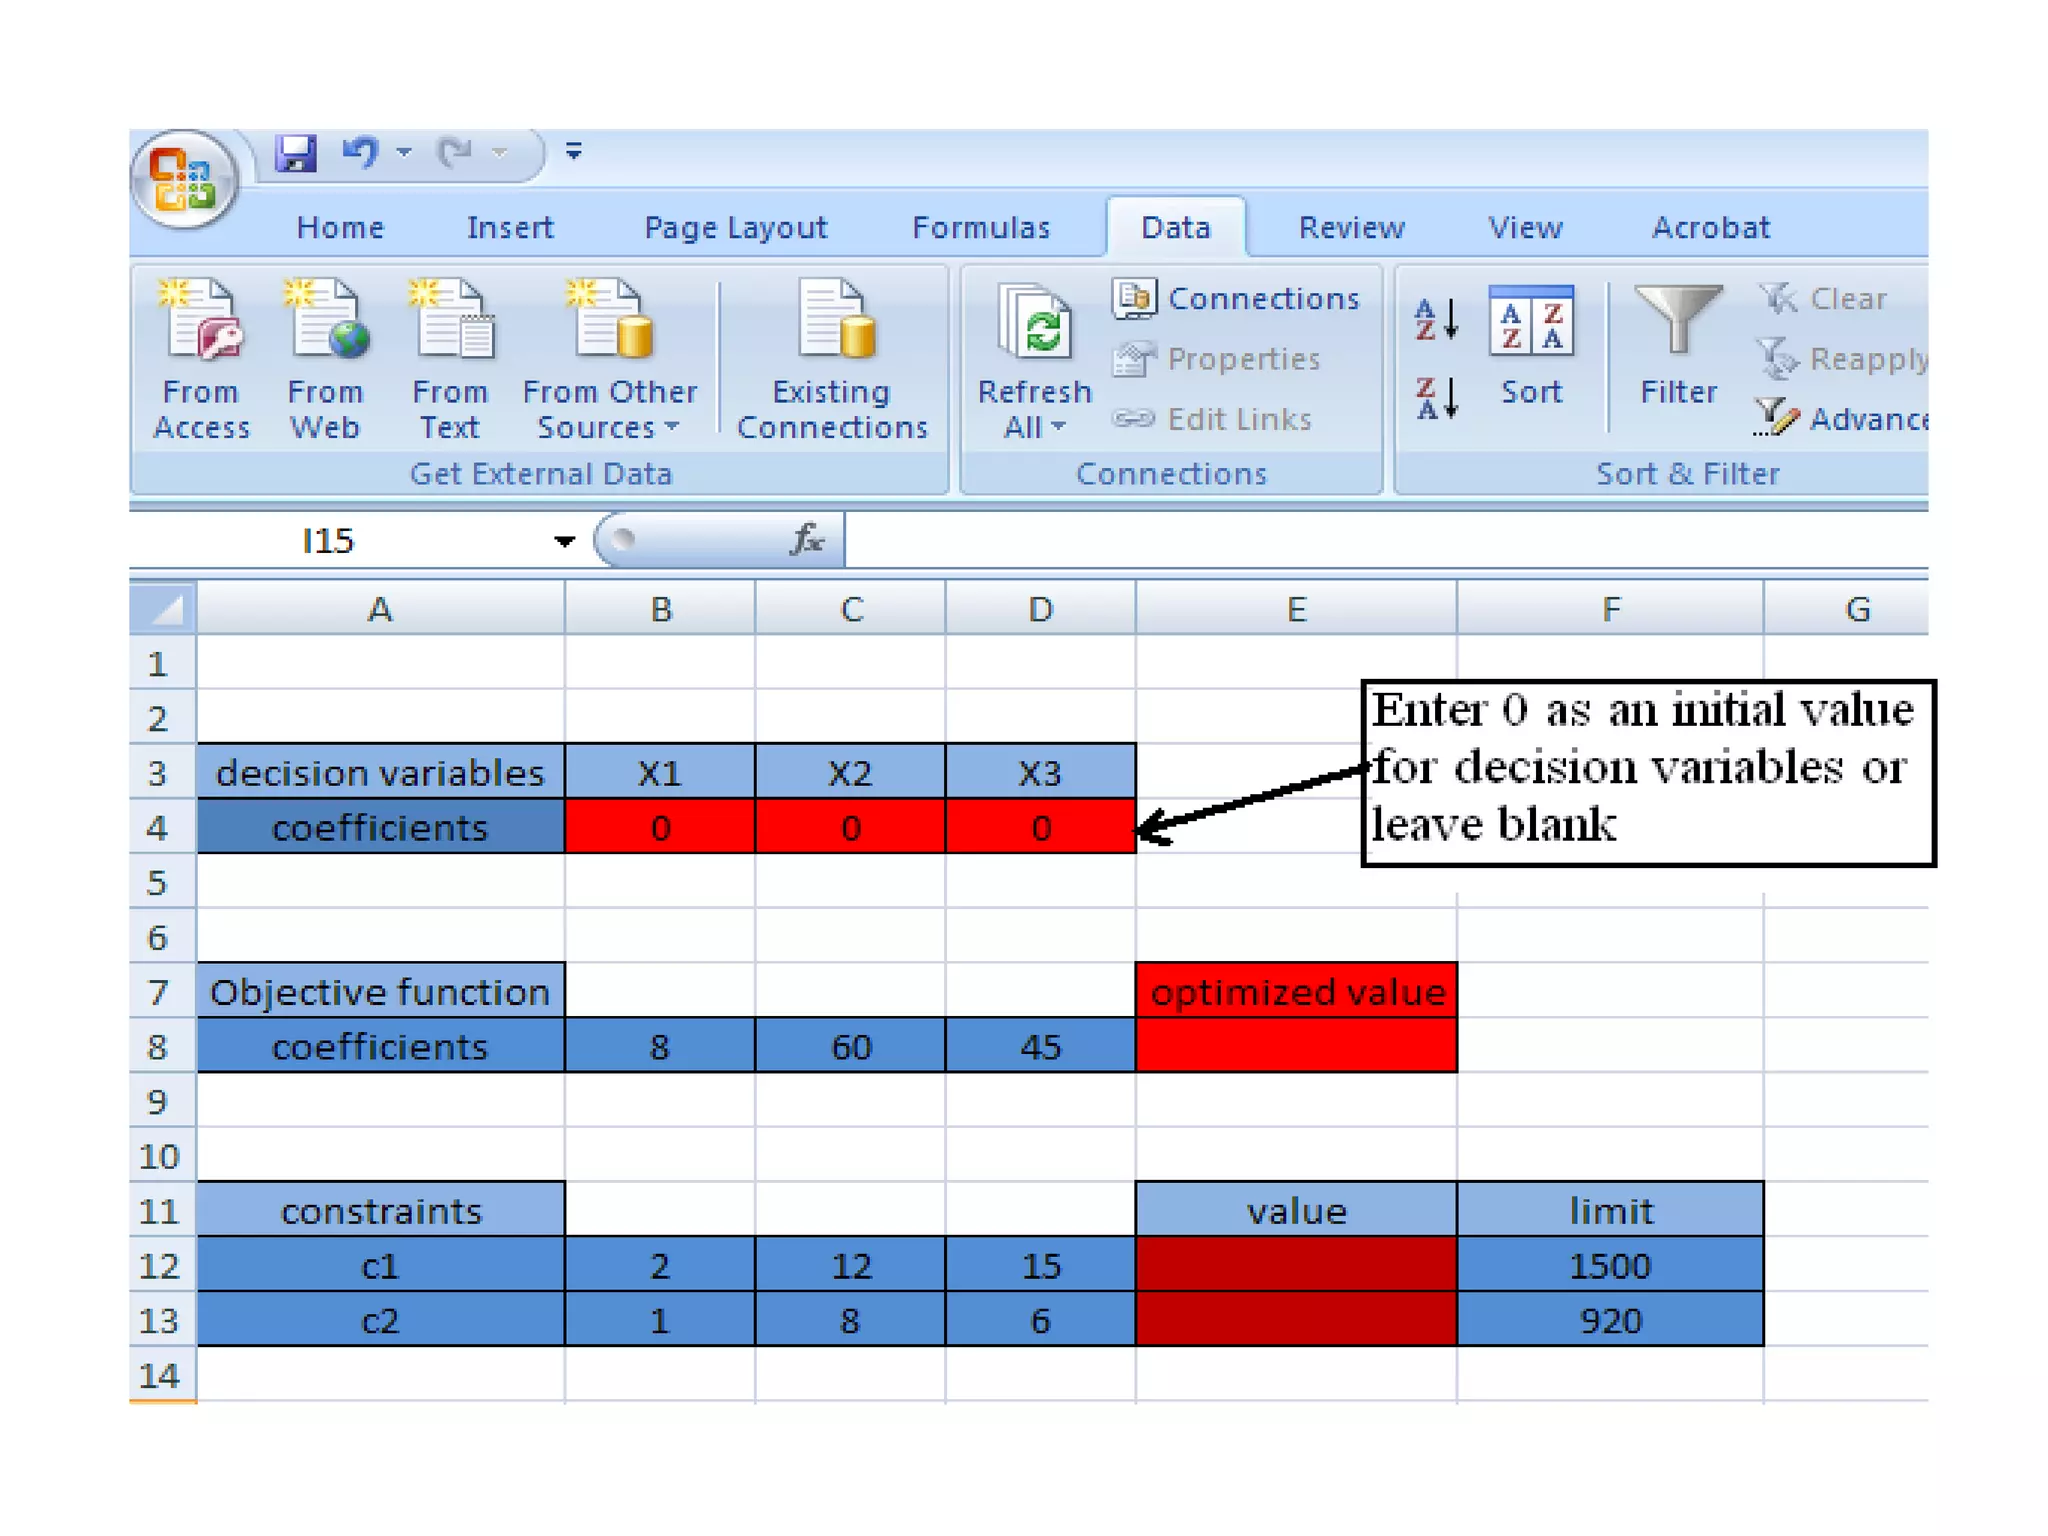
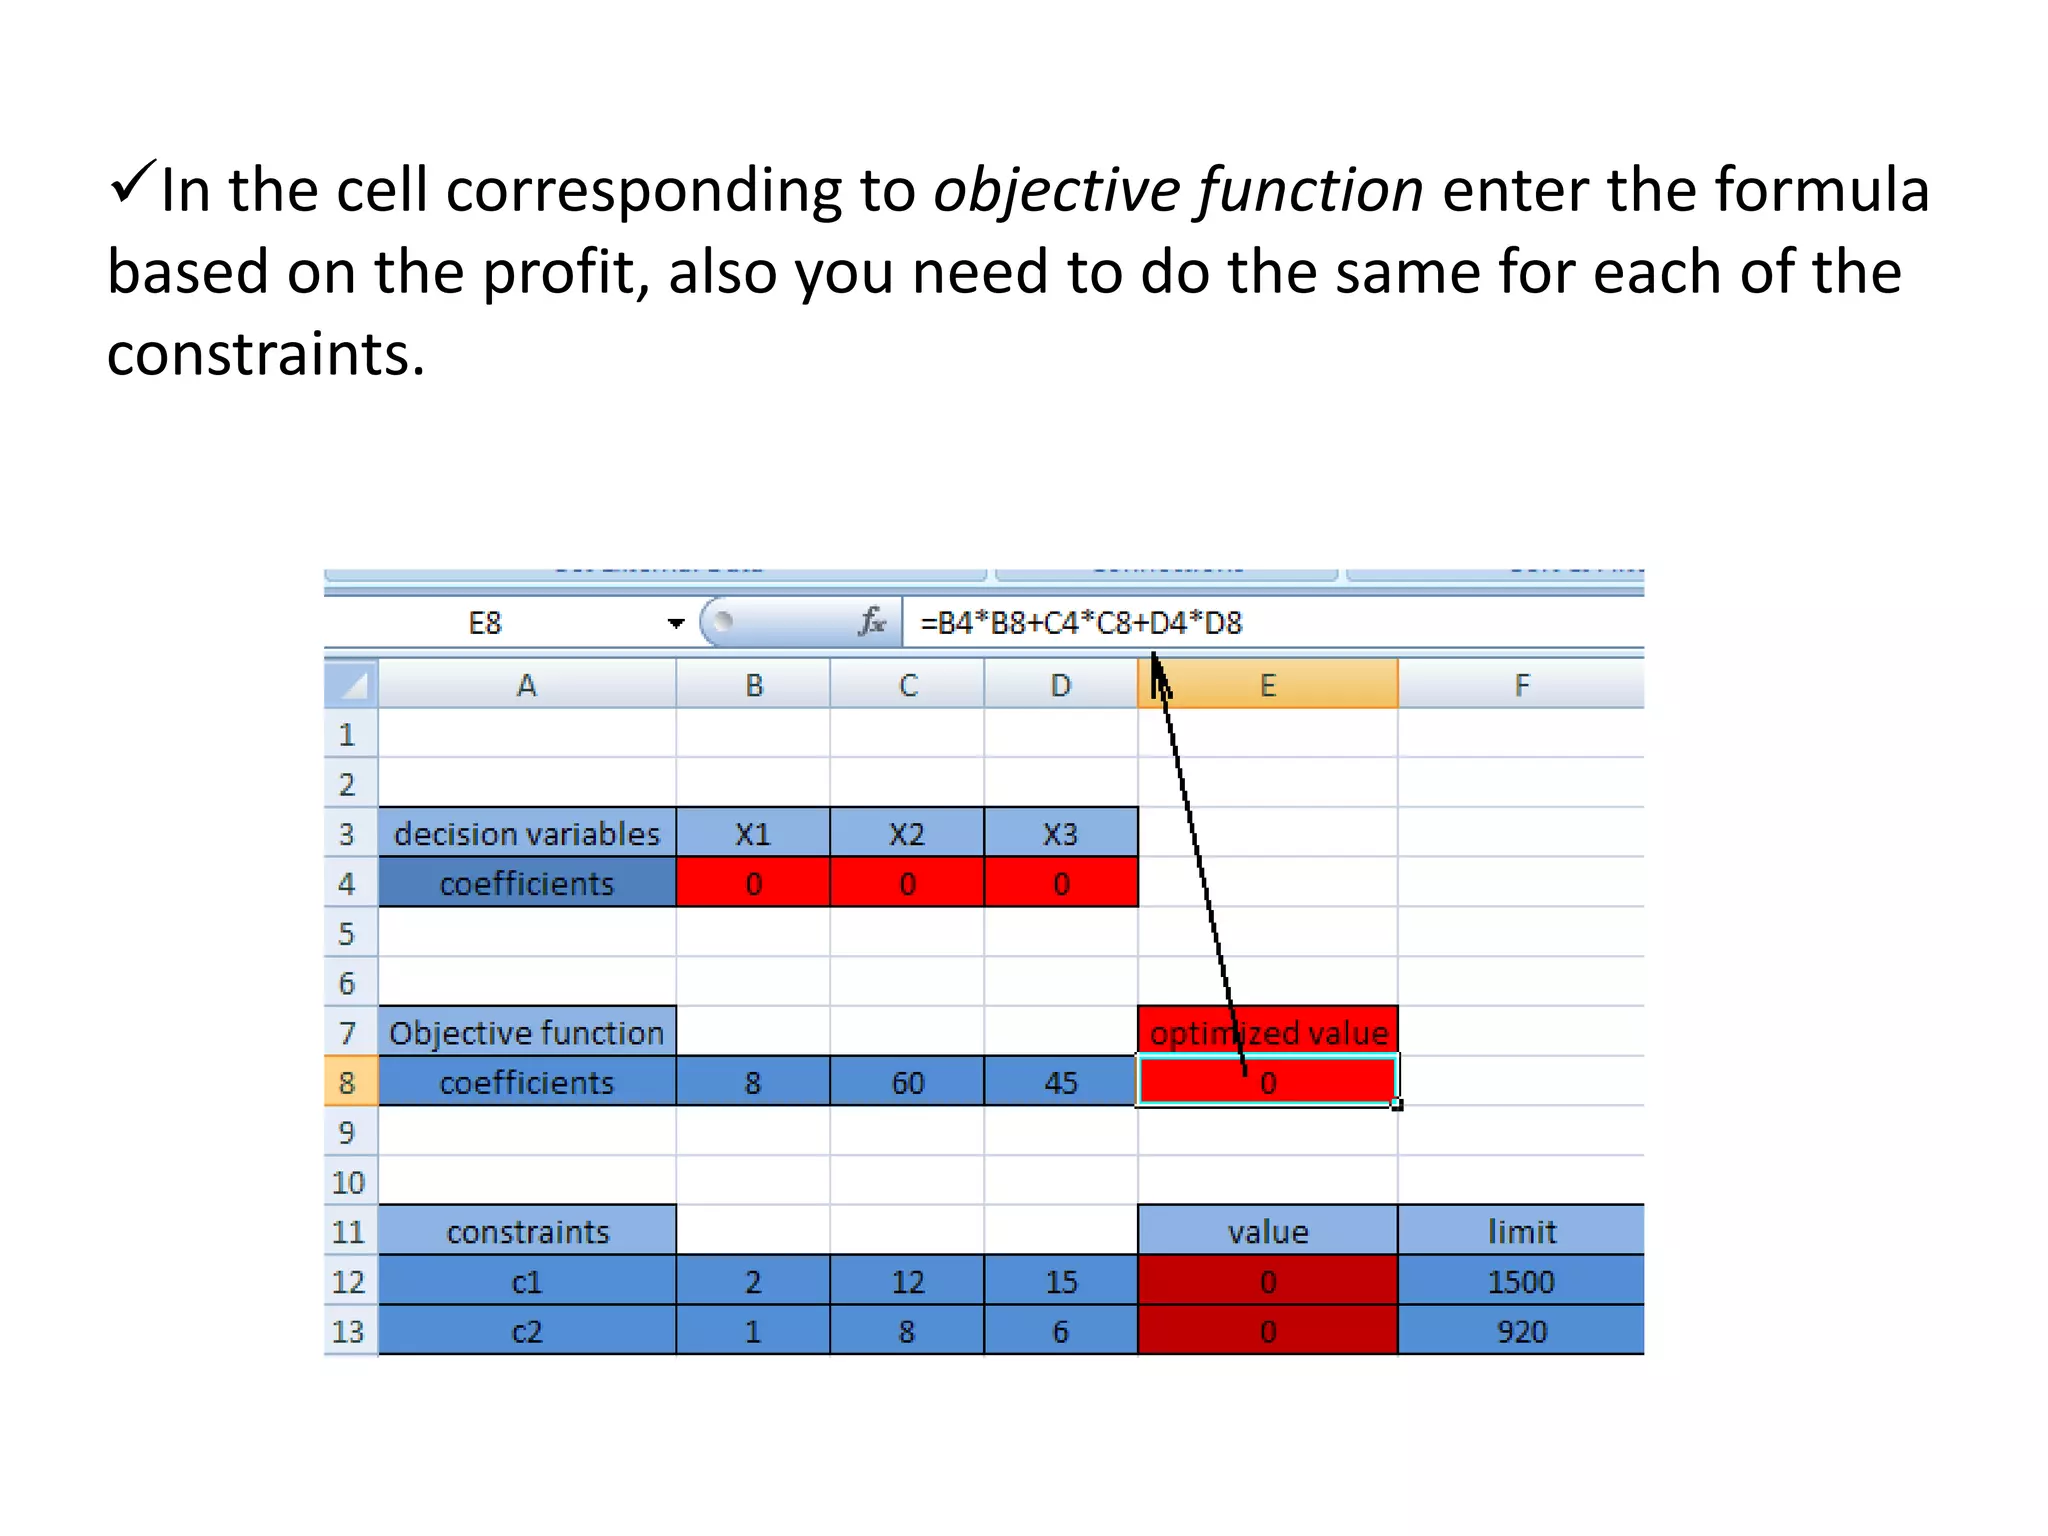
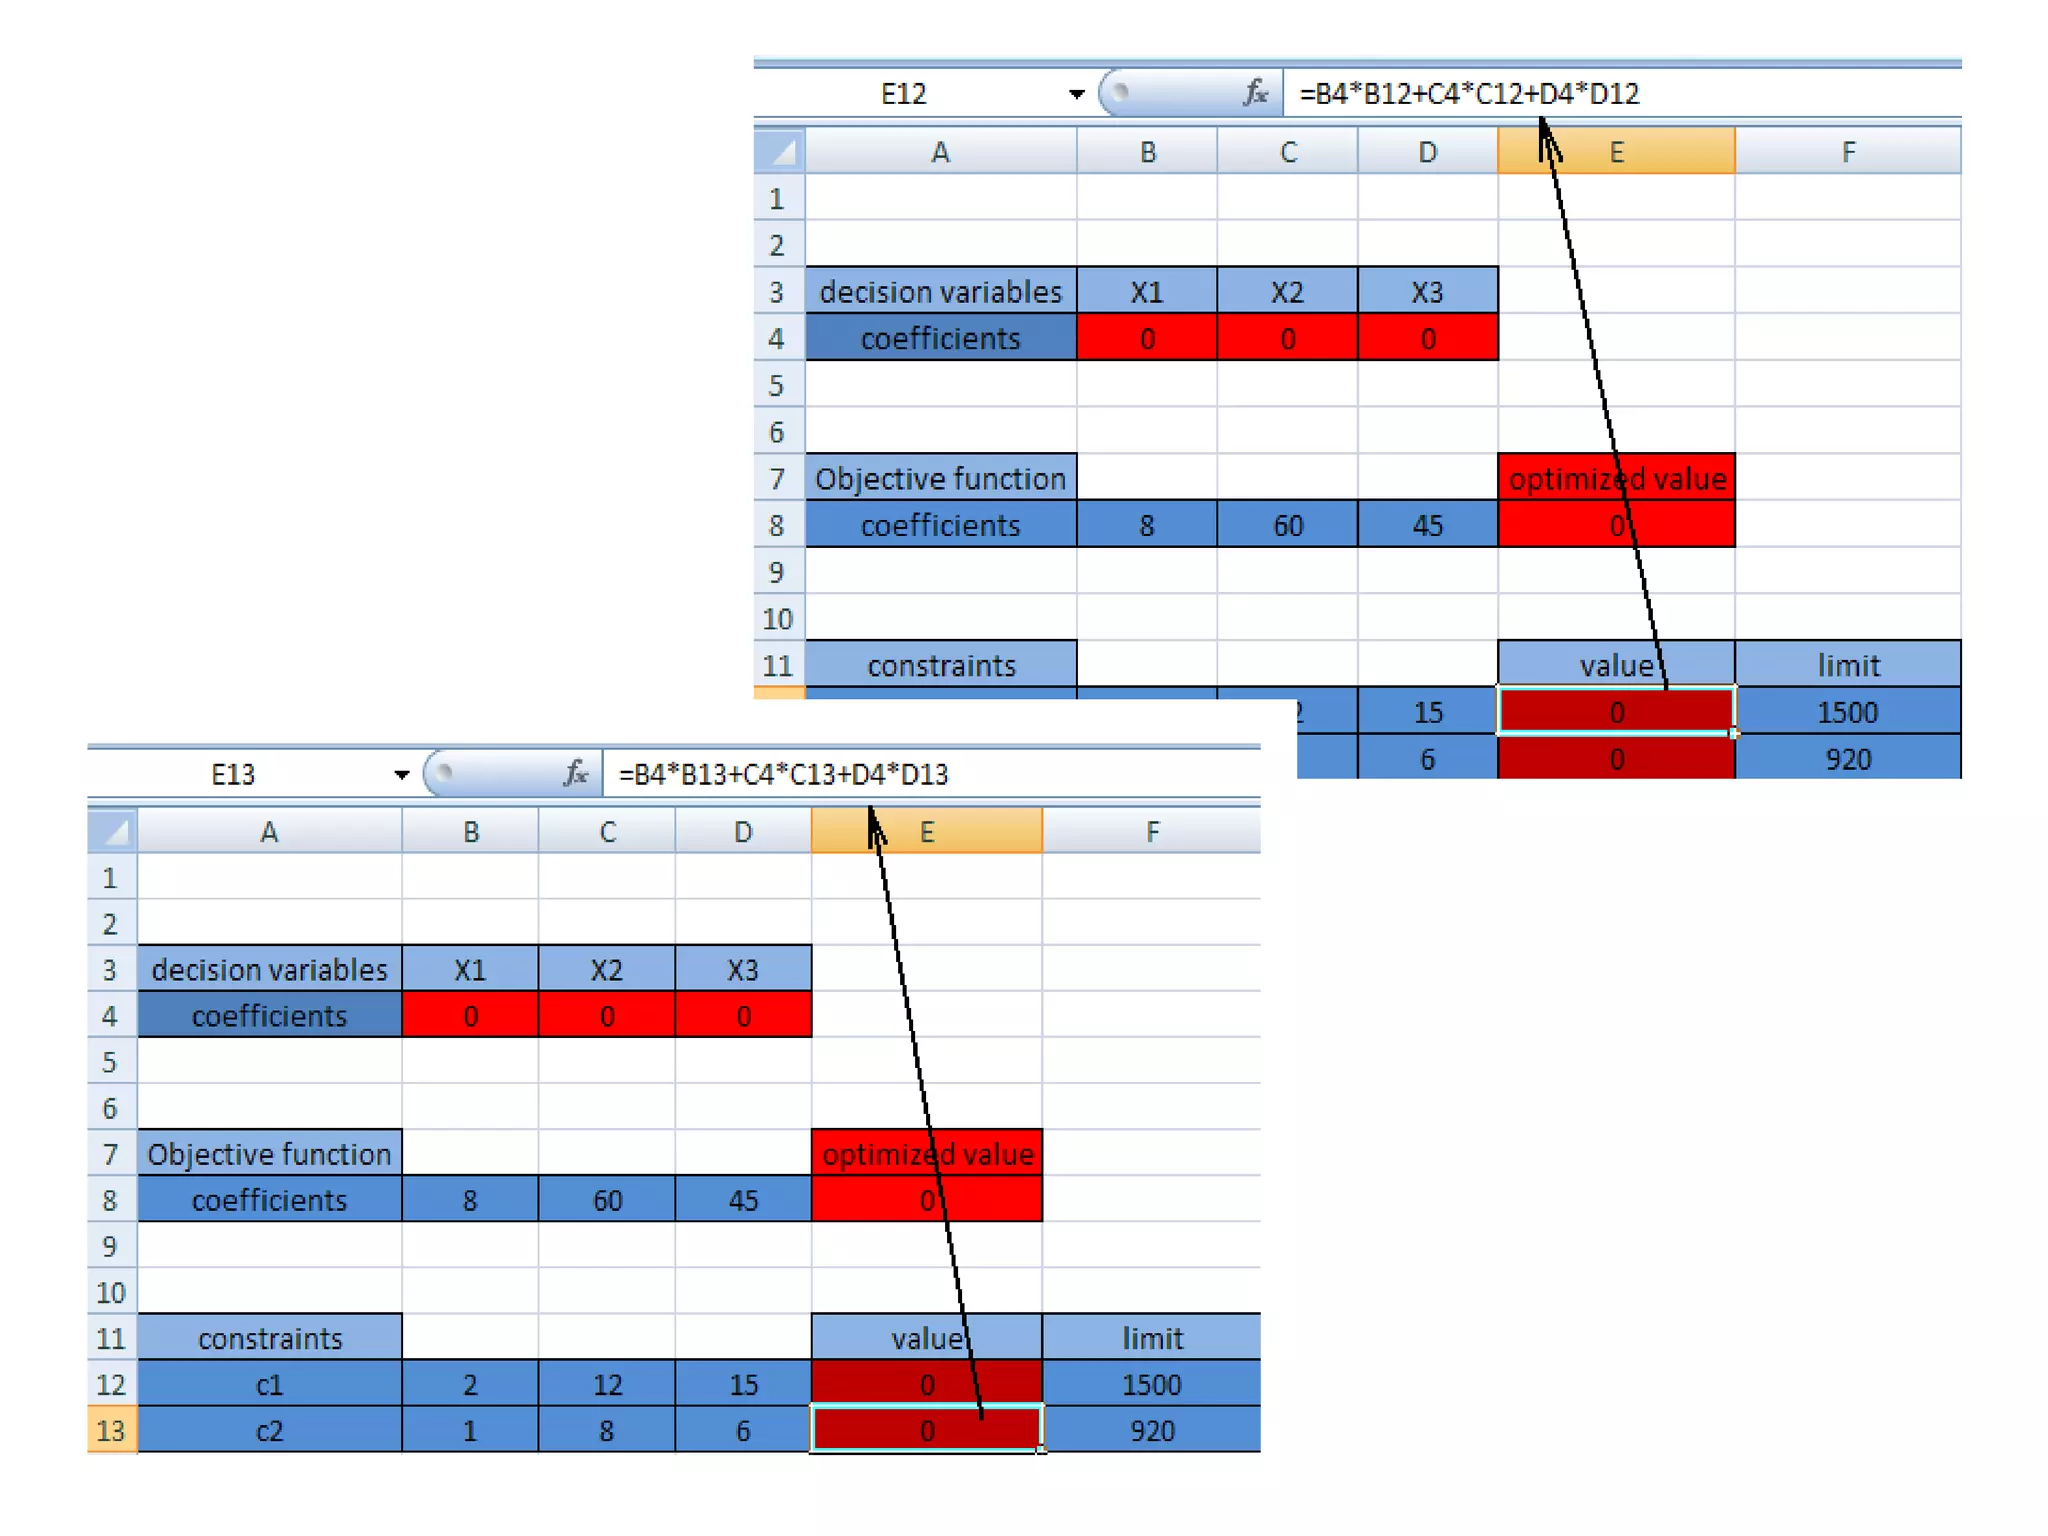
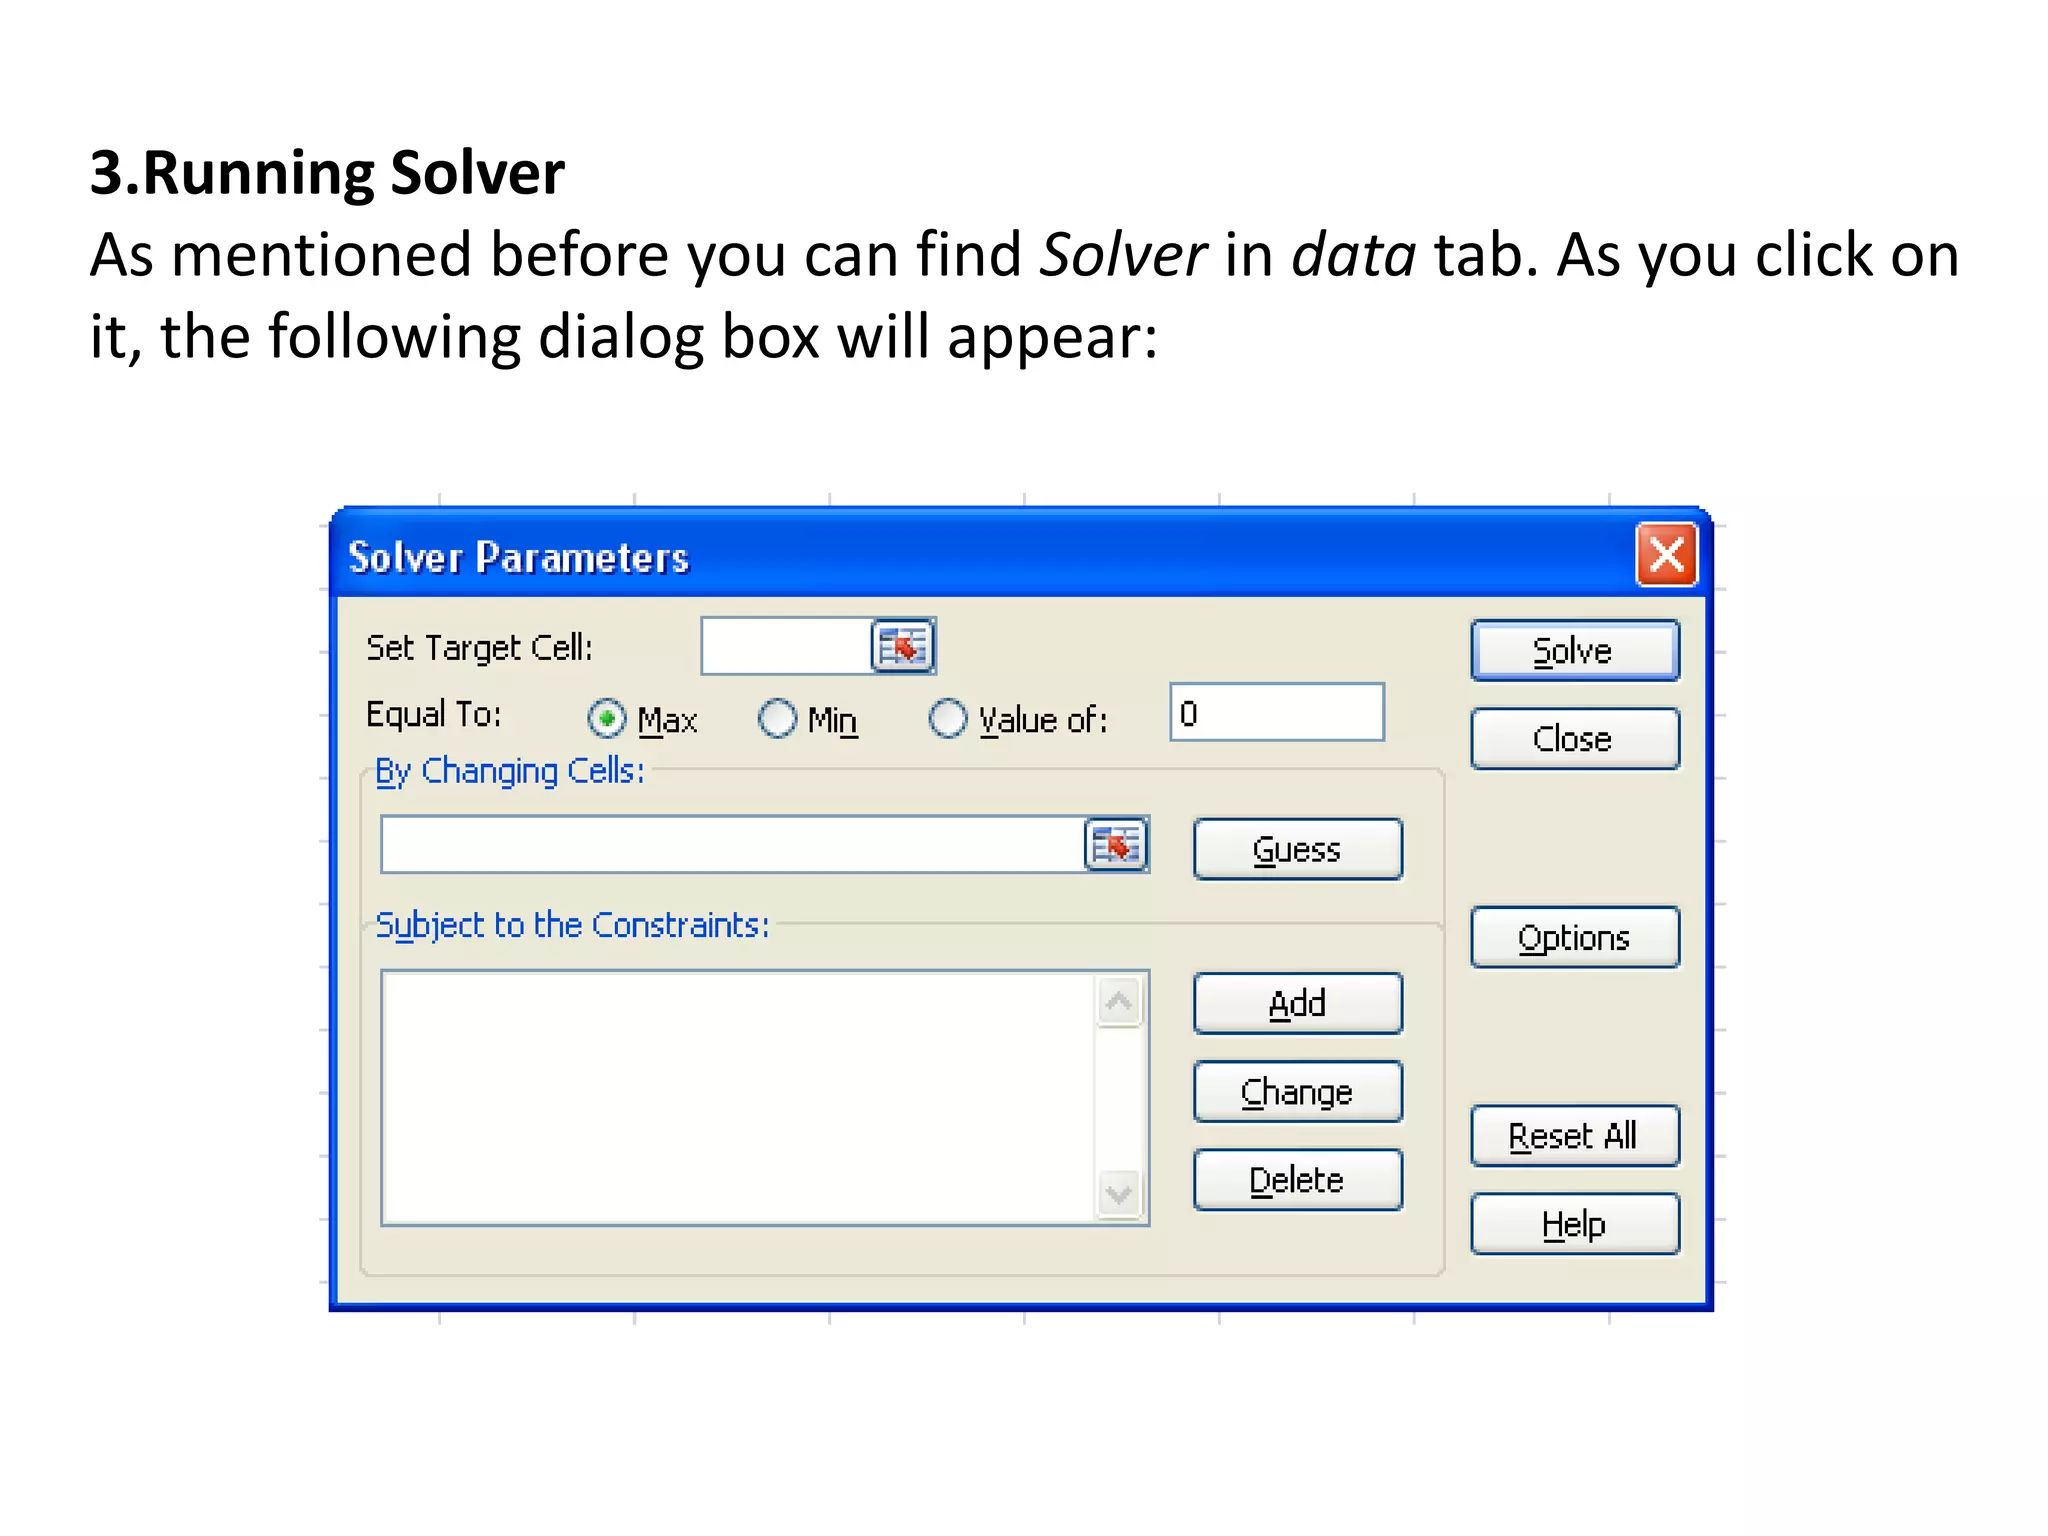
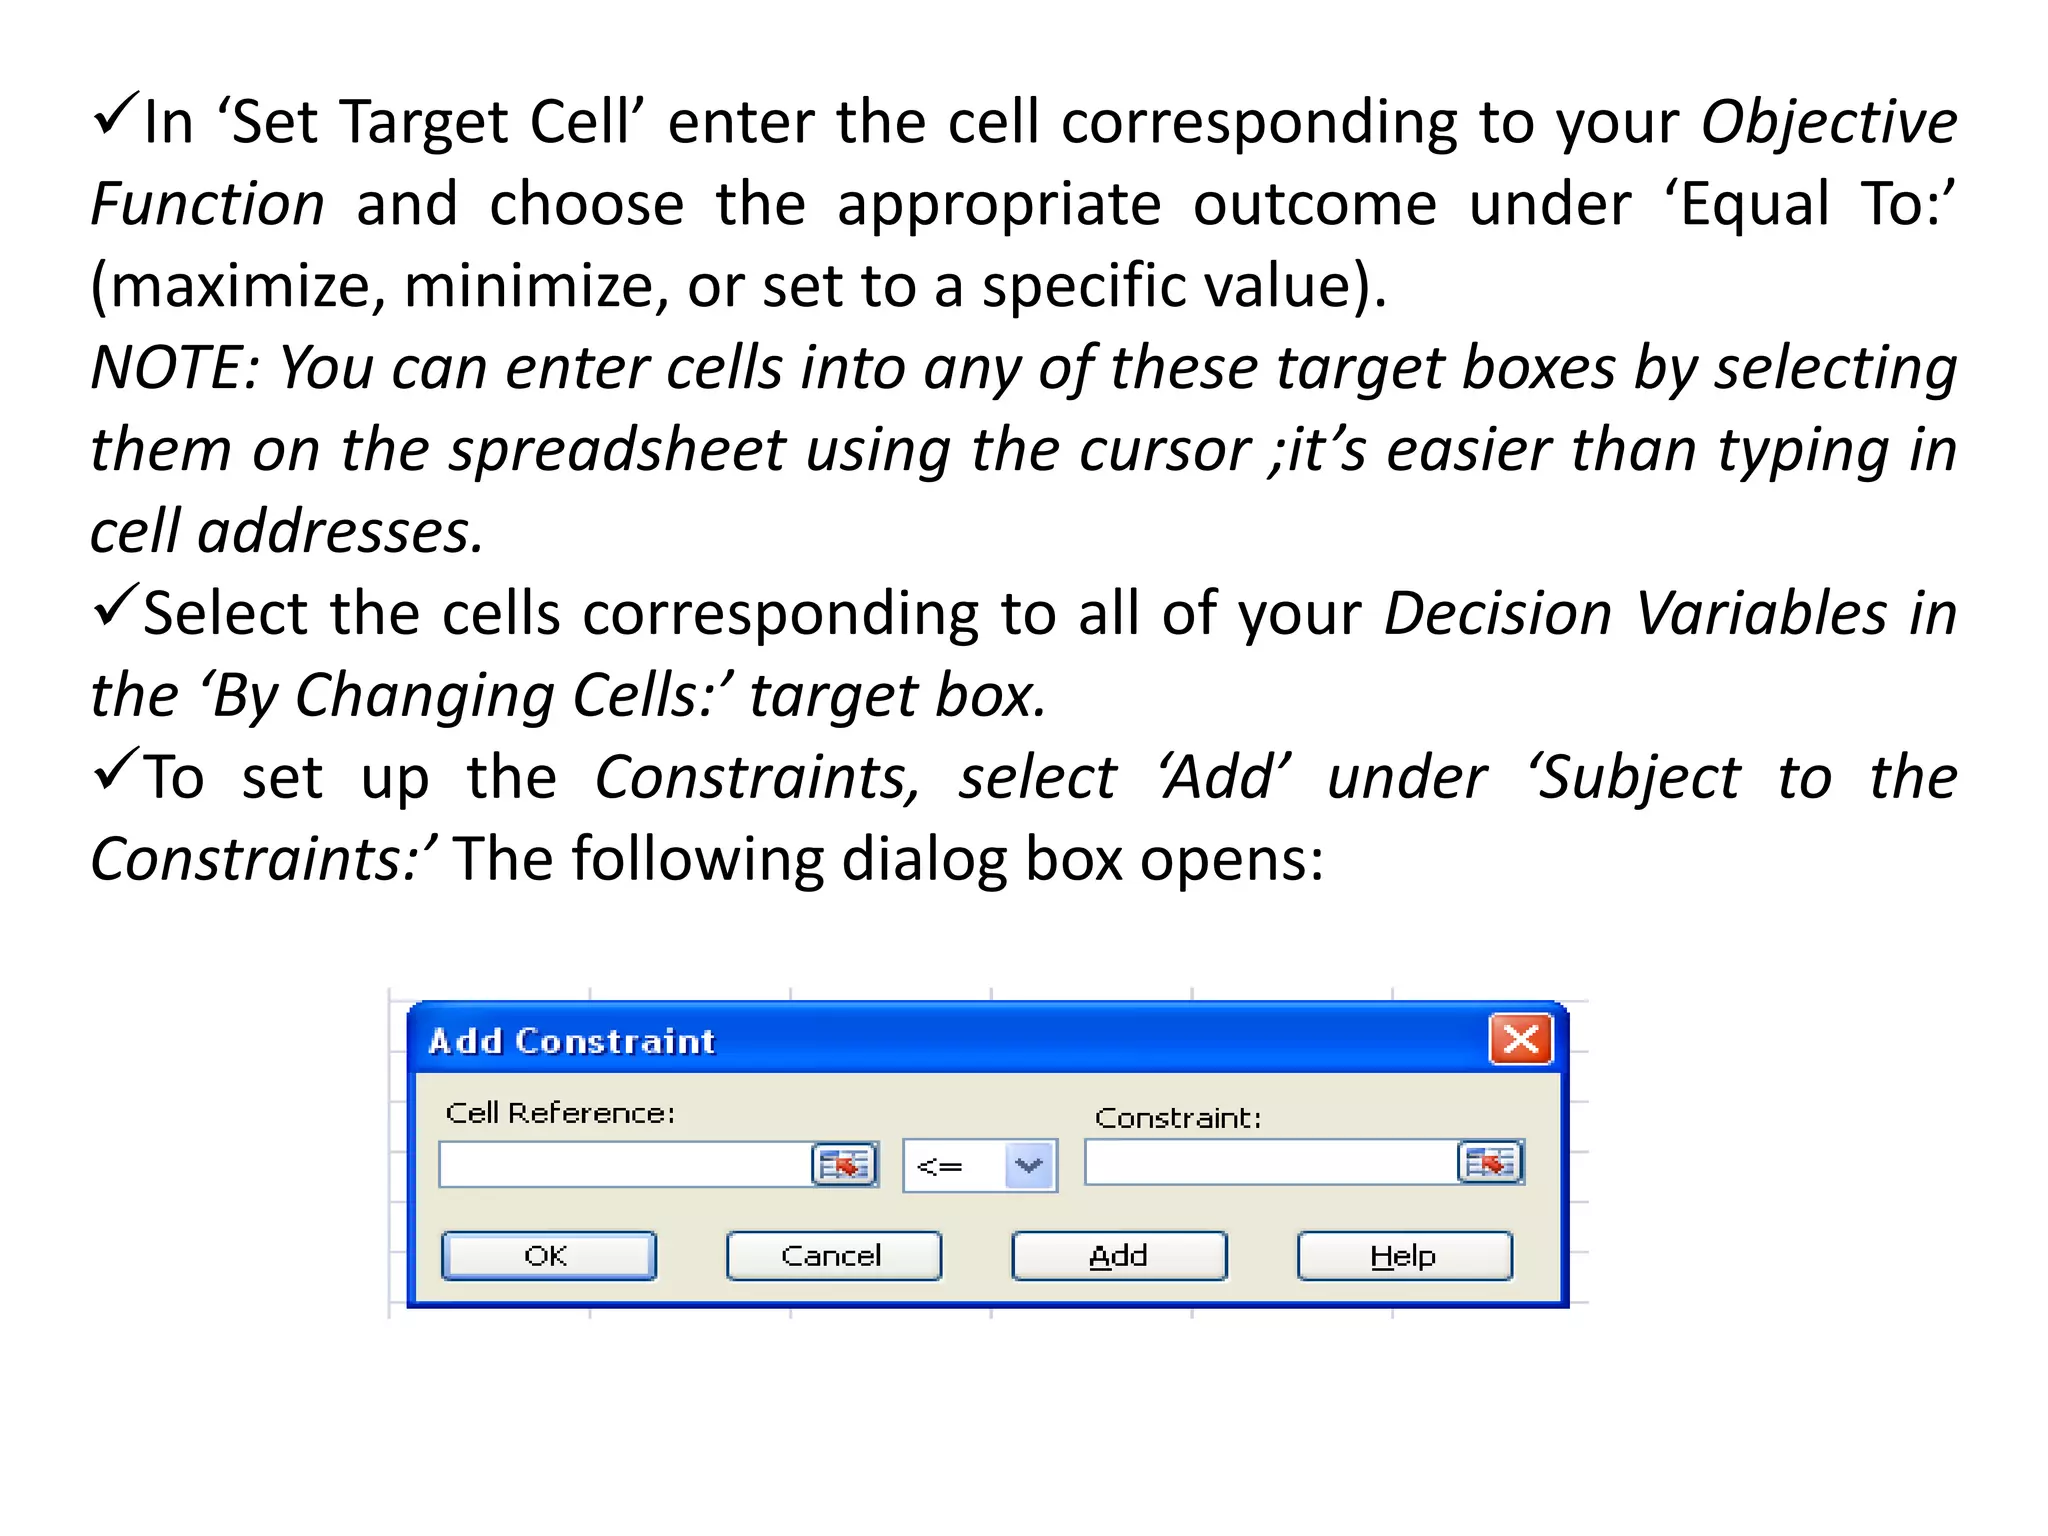
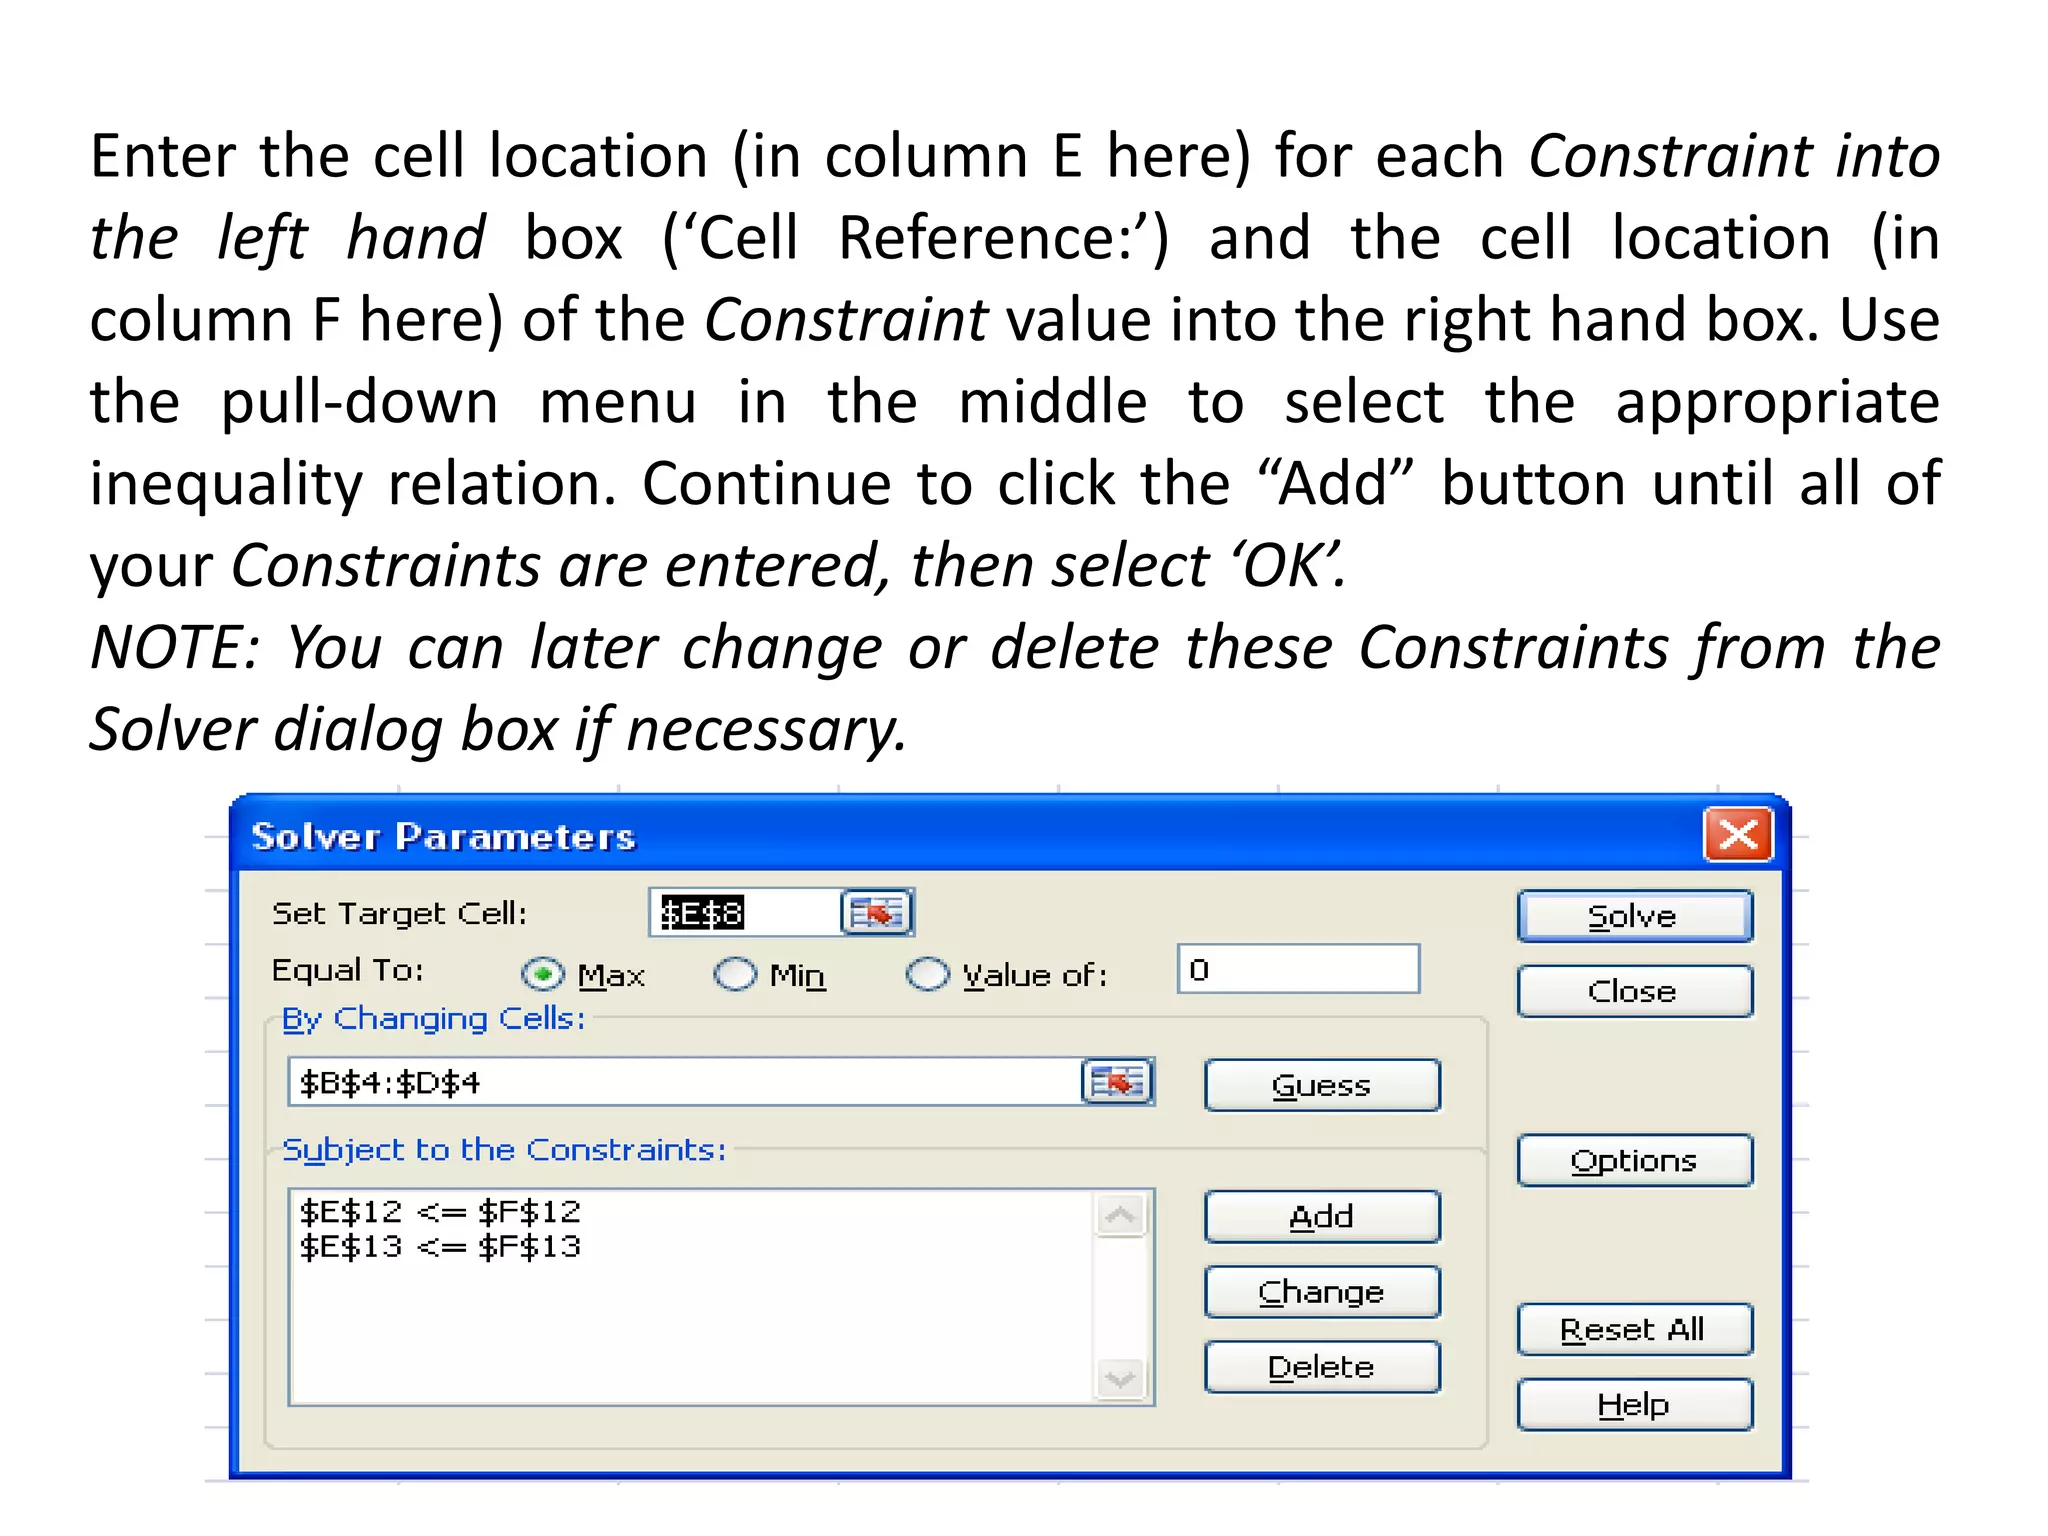
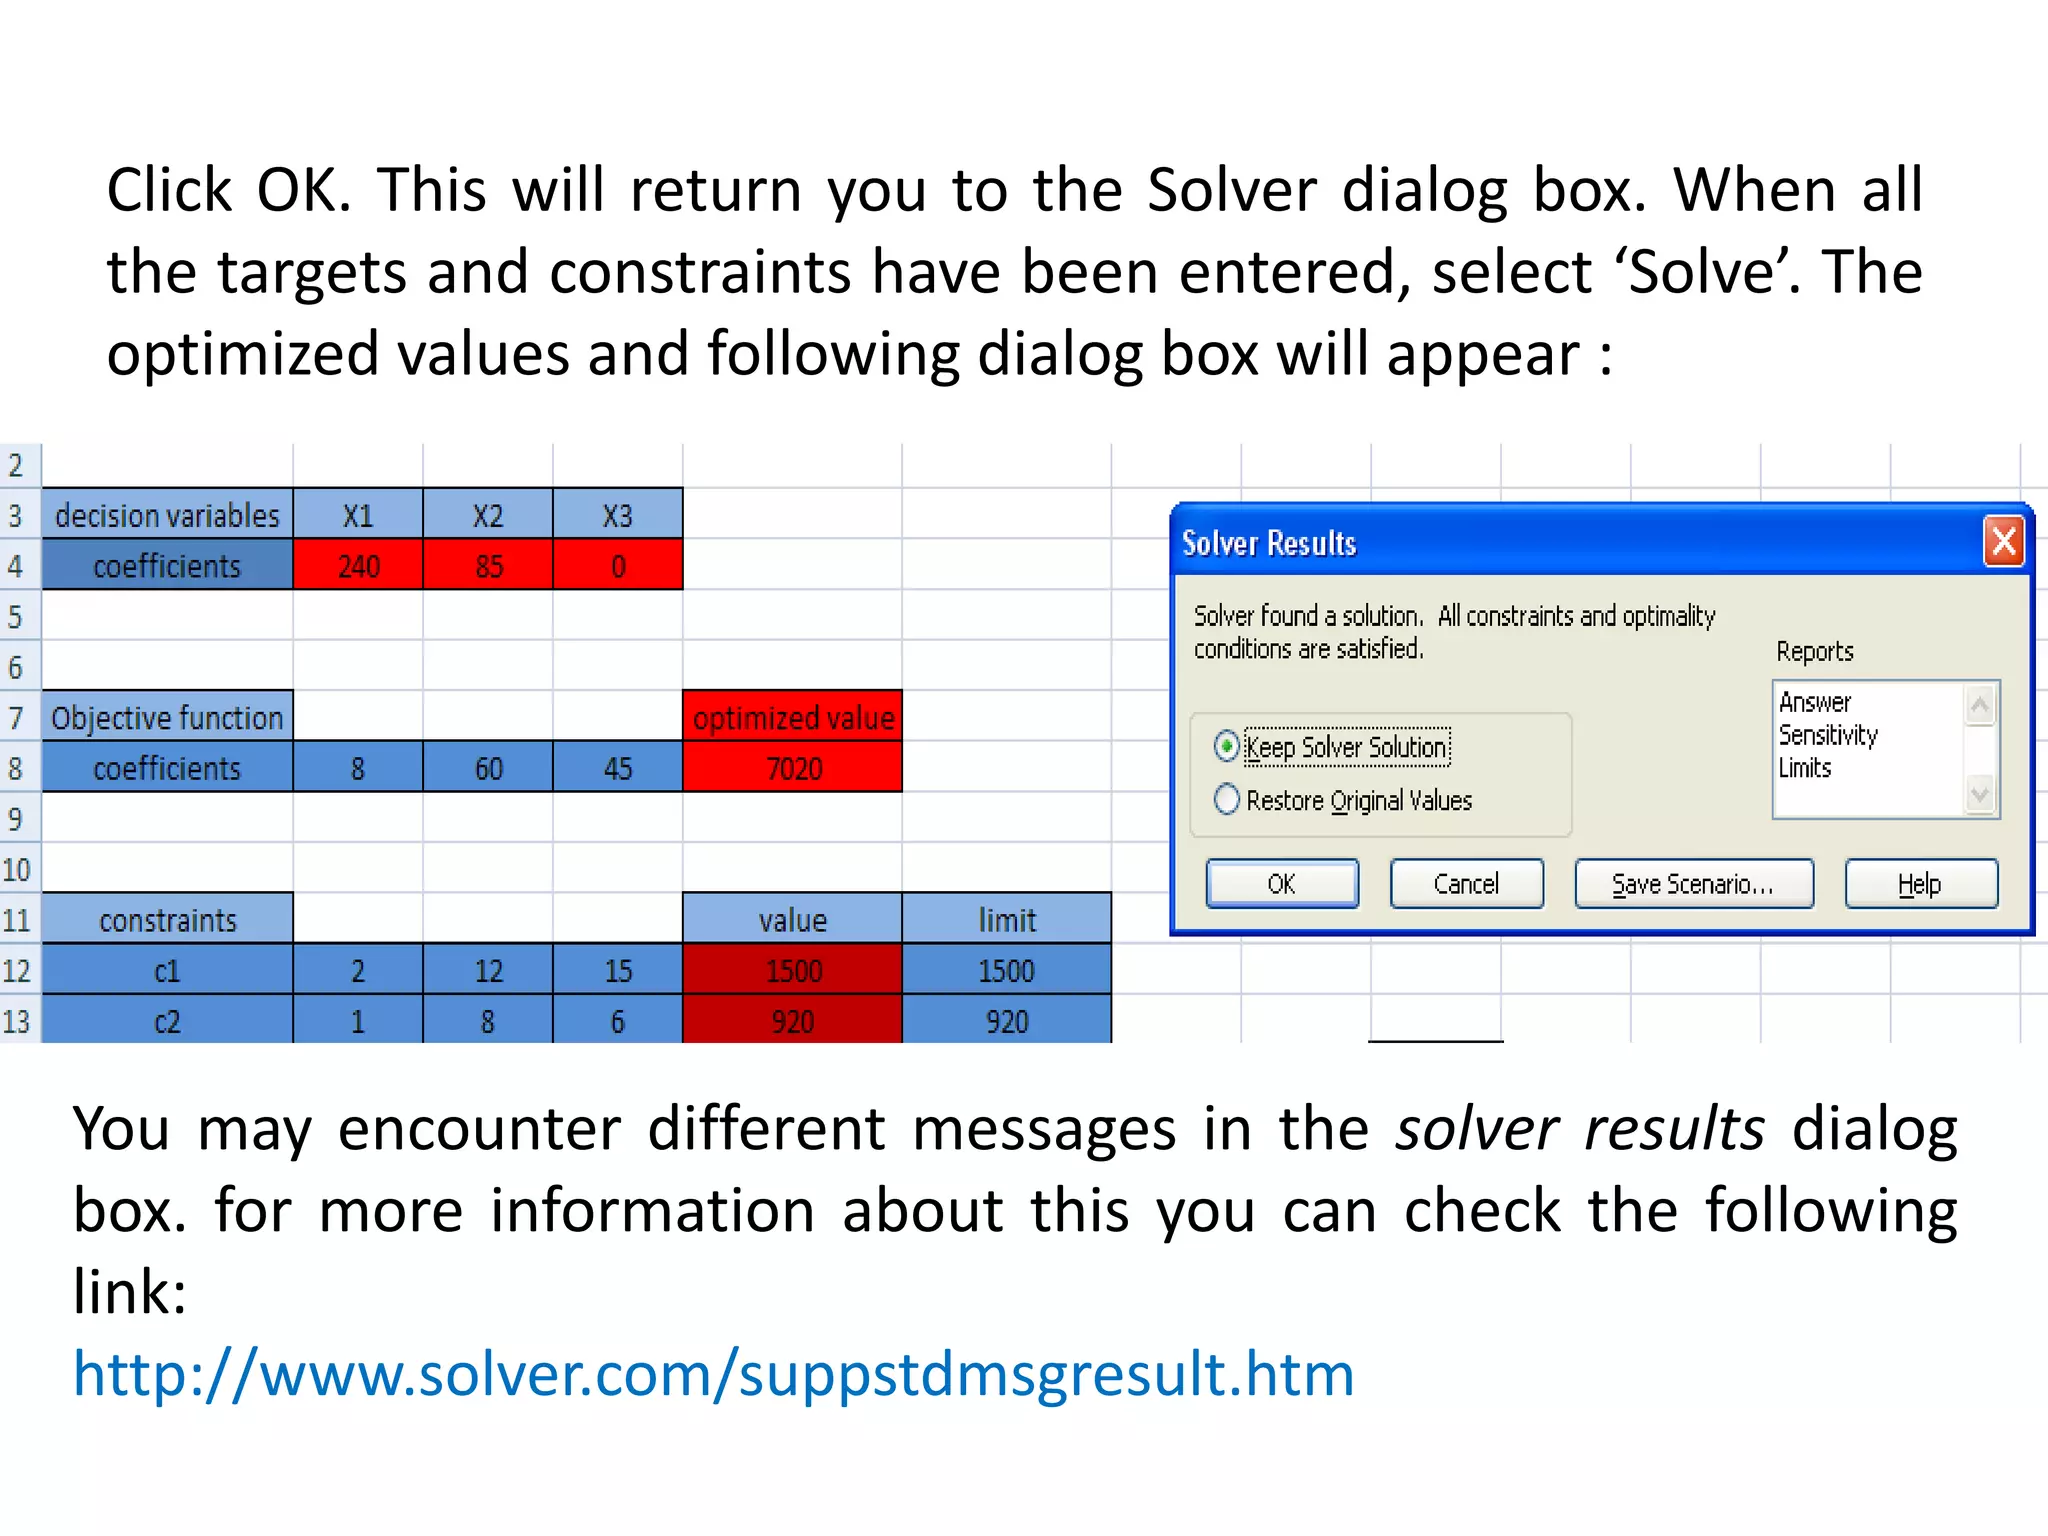
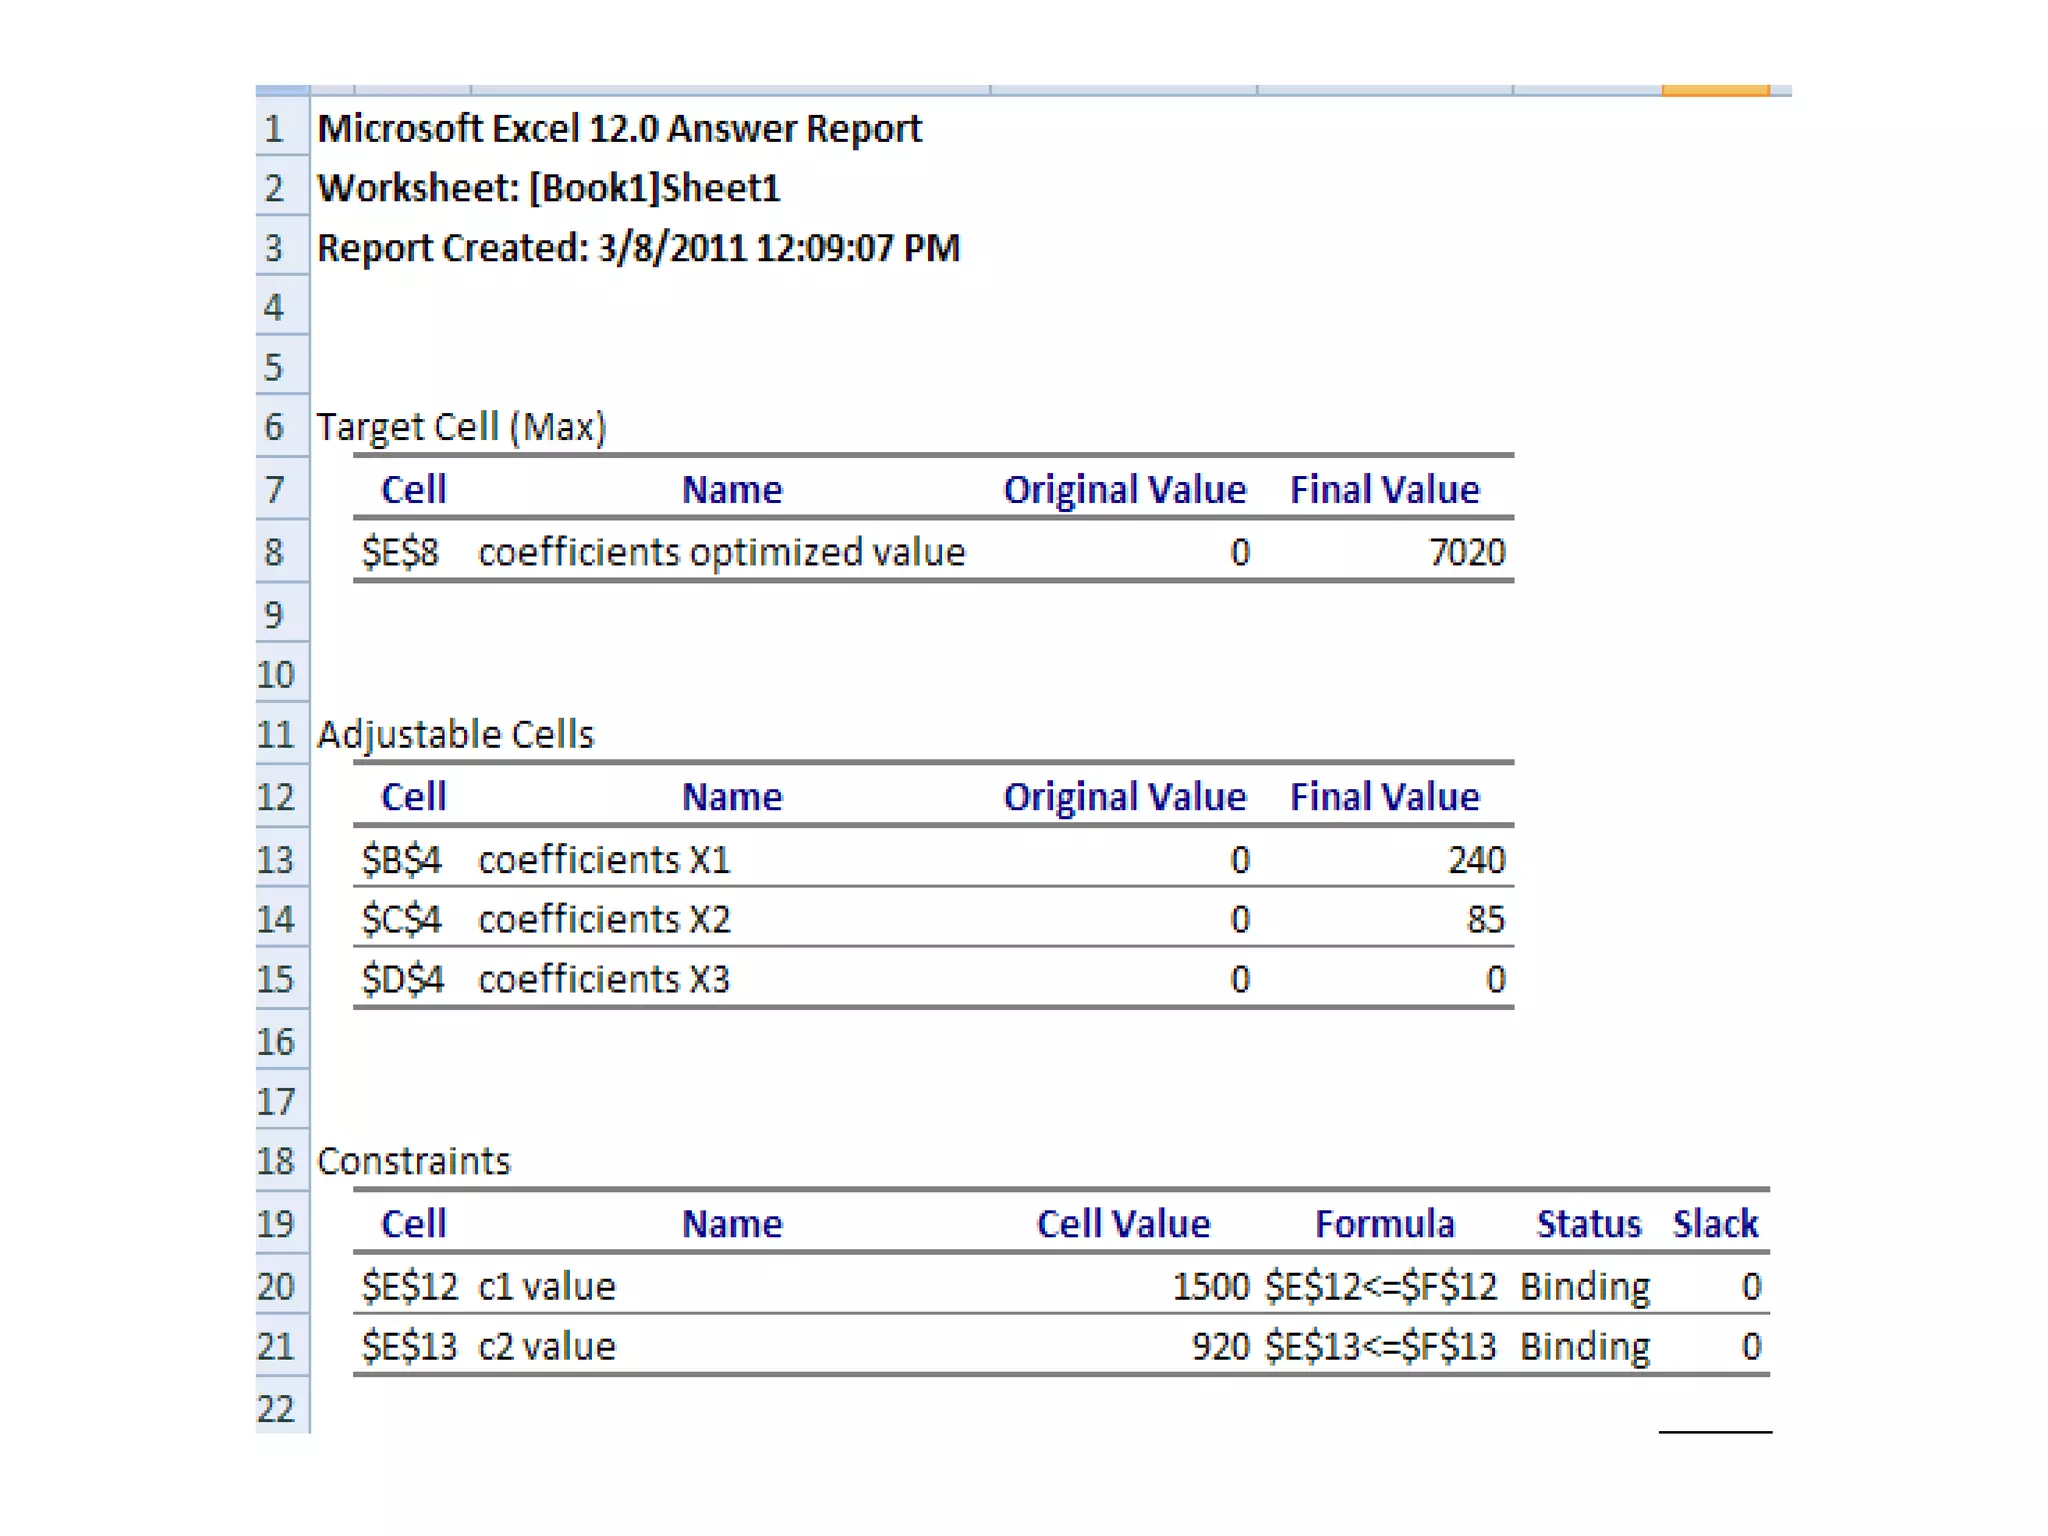


This document provides an introduction to using the Excel Solver tool to solve optimization problems. It explains how to enable the Solver add-in, the four main steps to solving a linear problem using Solver: 1) organizing the problem information, 2) setting up the problem in a spreadsheet, 3) running Solver, and 4) interpreting the results. It also includes an example problem about maximizing profits from manufacturing different products with limited resources, and shows how to set up and solve this problem using Solver.