Download to read offline
![Published at the 2006 Cray User Group Meeting, Lugano, Switzerland.
- 1 -
Evaluation of the Cray XT3 at ORNL: a Status Report
Sadaf R. Alam Richard F. Barrett Mark R. Fahey
O. E. Bronson Messer Richard T. Mills Philip C. Roth
Jeffrey S. Vetter Patrick H. Worley
Oak Ridge National Laboratory
Oak Ridge, TN, USA 37831
{alamsr,rbarrett,faheymr,bronson,rmills,rothpc,vetter,worleyph}@ornl.gov
Abstract – Last year, Oak Ridge National Laboratory received delivery of a 5,294 processor Cray XT3. The XT3 is
Cray’s third-generation massively parallel processing system. The system uses a single-processor node built
around the AMD Opteron and uses a custom chip—called SeaStar—to provide interprocessor communication. In
addition, the system uses a lightweight operating system on its compute nodes. This paper provides a status
update since last year, including updated performance measurements for micro-benchmark, kernel, and
application benchmarks. In particular, we provide performance results for strategic Department of Energy
applications areas including climate, biology, astrophysics, combustion, and fusion. Our results, on up to 4096
processors, demonstrate that the Cray XT3 provides competitive processor performance, high interconnect
bandwidth, and high parallel efficiency on a diverse application workload, typical in the DOE Office of Science.
1 Introduction
Computational requirements for many large-scale
simulations and ensemble studies of vital interest to
the Department of Energy (DOE) exceed what is
currently offered by any U.S. computer vendor. As
illustrated in the DOE Scales report [43] and the High
End Computing Revitalization Task Force report [24],
examples are numerous, ranging from global climate
change research to combustion to biology.
Performance of the current class of high
performance computer (HPC) architectures is
dependent on the performance of the memory
hierarchy, ranging from the processor-to-cache latency
and bandwidth to the latency and bandwidth of the
interconnect between nodes in a cluster, to the
latency and bandwidth in accesses to the file system.
With increasing chip clock rates and number of
functional units per processor and the lack of
corresponding improvements in memory access
latencies, this dependency will only increase. Single
processor performance, or the performance of a small
system, is relatively simple to determine. However,
given reasonable sequential performance, the metric of
interest in evaluating the ability of a system to
achieve multi-Teraop performance is scalability. Here,
scalability includes the performance sensitivity to
variation in both problem size and the number of
processors or other computational resources utilized by
a particular application.
ORNL has been evaluating these critical factors on
several platforms that include the Cray X1 [2], the SGI
Altix 3700 [18], and the Cray XD1 [20]. This report is a
status update to our ongoing use and evaluation of
the Cray XT3 sited at ORNL.
2 Cray XT3 System Overview
The XT3 is Cray’s third-generation massively
parallel processing system. It follows a similar design
to the successful Cray T3D and Cray T3E [40] systems.
As in these previous systems, the XT3 builds upon a
single processor node, or processing element (PE).
However, unlike the T3D and T3E, the XT3 uses a
commodity microprocessor—the AMD Opteron—at its
core. The XT3 connects these processors with a
customized interconnect managed by a Cray-designed
Application-Specific Integrated Circuit (ASIC) called
SeaStar.
2.1 Processing Elements
As Figure 1 shows, each PE has one Opteron
processor with its own dedicated memory and
communication resource. The XT3 has two types of
PEs: compute PEs and service PEs. The compute PEs
are optimized for application performance and run a
lightweight operating system kernel called
Catamount. In contrast, the service PEs run SuSE
Linux and are configured for I/O, login, network, or
system functions.
The ORNL XT3 uses Opteron model 150 processors.
This model includes an Opteron core, integrated
memory controller, three 16b-wide 800 MHz
HyperTransport (HT) links, and L1 and L2 caches. The
Opteron core has three integer units and one floating
point unit capable of two floating-point operations per
cycle [4]. Because the processor core is clocked at 2.4](https://image.slidesharecdn.com/crayl-130714223925-phpapp02/85/Crayl-1-320.jpg)
![Published at the 2006 Cray User Group Meeting, Lugano, Switzerland.
- 1 -
Evaluation of the Cray XT3 at ORNL: a Status Report
Sadaf R. Alam Richard F. Barrett Mark R. Fahey
O. E. Bronson Messer Richard T. Mills Philip C. Roth
Jeffrey S. Vetter Patrick H. Worley
Oak Ridge National Laboratory
Oak Ridge, TN, USA 37831
{alamsr,rbarrett,faheymr,bronson,rmills,rothpc,vetter,worleyph}@ornl.gov
Abstract – Last year, Oak Ridge National Laboratory received delivery of a 5,294 processor Cray XT3. The XT3 is
Cray’s third-generation massively parallel processing system. The system uses a single-processor node built
around the AMD Opteron and uses a custom chip—called SeaStar—to provide interprocessor communication. In
addition, the system uses a lightweight operating system on its compute nodes. This paper provides a status
update since last year, including updated performance measurements for micro-benchmark, kernel, and
application benchmarks. In particular, we provide performance results for strategic Department of Energy
applications areas including climate, biology, astrophysics, combustion, and fusion. Our results, on up to 4096
processors, demonstrate that the Cray XT3 provides competitive processor performance, high interconnect
bandwidth, and high parallel efficiency on a diverse application workload, typical in the DOE Office of Science.
1 Introduction
Computational requirements for many large-scale
simulations and ensemble studies of vital interest to
the Department of Energy (DOE) exceed what is
currently offered by any U.S. computer vendor. As
illustrated in the DOE Scales report [43] and the High
End Computing Revitalization Task Force report [24],
examples are numerous, ranging from global climate
change research to combustion to biology.
Performance of the current class of high
performance computer (HPC) architectures is
dependent on the performance of the memory
hierarchy, ranging from the processor-to-cache latency
and bandwidth to the latency and bandwidth of the
interconnect between nodes in a cluster, to the
latency and bandwidth in accesses to the file system.
With increasing chip clock rates and number of
functional units per processor and the lack of
corresponding improvements in memory access
latencies, this dependency will only increase. Single
processor performance, or the performance of a small
system, is relatively simple to determine. However,
given reasonable sequential performance, the metric of
interest in evaluating the ability of a system to
achieve multi-Teraop performance is scalability. Here,
scalability includes the performance sensitivity to
variation in both problem size and the number of
processors or other computational resources utilized by
a particular application.
ORNL has been evaluating these critical factors on
several platforms that include the Cray X1 [2], the SGI
Altix 3700 [18], and the Cray XD1 [20]. This report is a
status update to our ongoing use and evaluation of
the Cray XT3 sited at ORNL.
2 Cray XT3 System Overview
The XT3 is Cray’s third-generation massively
parallel processing system. It follows a similar design
to the successful Cray T3D and Cray T3E [40] systems.
As in these previous systems, the XT3 builds upon a
single processor node, or processing element (PE).
However, unlike the T3D and T3E, the XT3 uses a
commodity microprocessor—the AMD Opteron—at its
core. The XT3 connects these processors with a
customized interconnect managed by a Cray-designed
Application-Specific Integrated Circuit (ASIC) called
SeaStar.
2.1 Processing Elements
As Figure 1 shows, each PE has one Opteron
processor with its own dedicated memory and
communication resource. The XT3 has two types of
PEs: compute PEs and service PEs. The compute PEs
are optimized for application performance and run a
lightweight operating system kernel called
Catamount. In contrast, the service PEs run SuSE
Linux and are configured for I/O, login, network, or
system functions.
The ORNL XT3 uses Opteron model 150 processors.
This model includes an Opteron core, integrated
memory controller, three 16b-wide 800 MHz
HyperTransport (HT) links, and L1 and L2 caches. The
Opteron core has three integer units and one floating
point unit capable of two floating-point operations per
cycle [4]. Because the processor core is clocked at 2.4](https://image.slidesharecdn.com/crayl-130714223925-phpapp02/75/Crayl-1-2048.jpg)
![Published at the 2006 Cray User Group Meeting, Lugano, Switzerland.
- 2 -
GHz, the peak floating point rate of each compute
node is 4.8 GFlops.
The memory structure of the Opteron consists of a
64KB 2-way associative L1 data cache, a 64KB 2-way
associative L1 instruction cache, and a 1MB 16-way
associative, unified L2 cache. Each PE has 2 GB of
memory but only 1 GB is usable with the kernel used
for our evaluation. The memory DIMMs are 1 GB
PC3200, Registered ECC, 18 x 512 mbit parts that
support Chipkill. The peak memory bandwidth per
processor is 6.4 GB/s. Also, the Opteron 150 has an on-
chip memory controller. As a result, memory access
latencies with the Opteron 150 are in the 50-60 ns
range. These observations are quantified in Section
4.1.
Figure 1: Cray XT3 Architecture (Image courtesy of Cray).
2.2 Interconnect
Each Opteron processor is directly connected to
the XT3 interconnect via a Cray SeaStar chip (see
Figure 1). This SeaStar chip is a routing and
communications chip and it acts as the gateway to the
XT3’s high-bandwidth, low-latency interconnect. The
PE is connected to the SeaStar chip with a 6.4 GB/s
HT path. SeaStar provides six high-speed network
links to connect to neighbors in a 3D torus/mesh
topology. Each of the six links has a peak bandwidth of
7.6 GB/s with sustained bandwidth of around 4 GB/s.
In the XT3, the interconnect carries all message
passing traffic as well as I/O traffic to the system’s
Lustre parallel file system.
The ORNL Cray XT3 has 56 cabinets holding 5,212
compute processors and 82 service processors. Its nodes
are connected in a three-dimensional mesh of size 14 x
16 x 24, with torus links in the first and third
dimension.
2.3 Software
The Cray XT3 inherits several aspects of its
systems software approach from a sequence of systems
developed and deployed at Sandia National
Laboratories: ASCI Red [34], the Cplant [10, 38], and
Red Storm [9]. The XT3 uses a lightweight kernel
operating system on its compute PEs, a user-space
communications library, and a hierarchical approach
for scalable application start-up.
The XT3 uses two different operating systems:
Catamount on compute PEs and Linux on service PEs.
For scalability and performance predictability, each
instance of the Catamount kernel runs only one
single-threaded process and does not provide services
like demand-paged virtual memory that could cause
unpredictable performance behavior. Unlike the
compute PEs, service PEs (i.e., login, I/O, network,
and system PEs) run a full SuSE Linux distribution to
provide a familiar and powerful environment for
application development and for hosting system and
performance tools.
The XT3 uses the Portals [11] data movement
layer for flexible, low-overhead inter-node
communication. Portals provide connectionless,
reliable, in-order delivery of messages between
processes. For high performance and to avoid
unpredictable changes in the kernel’s memory
footprint, Portals deliver data from a sending process’
user space to the receiving process’ user space without
kernel buffering. Portals supports both one-sided and
two-sided communication models.
The primary math library is the AMD Core Math
Library (ACML). It incorporates BLAS, LAPACK and
FFT routines, and is optimized for high performance
on AMD platforms.
3 Evaluation Overview
As a function of the Early Evaluation project at
ORNL, numerous systems have been rigorously
evaluated using important DOE applications. Recent
evaluations have included the Cray X1 [17], the SGI
Altix 3700 [18], and the Cray XD1 [20]. The primary
goals of these evaluations are to 1) determine the
most effective approaches for using the each system, 2)
evaluate benchmark and application performance, both
in absolute terms and in comparison with other
systems, and 3) predict scalability, both in terms of
problem size and in number of processors.
For comparison, performance data is also presented
for the following systems:
• Cray X1 at ORNL: 512 Multistreaming processors
(MSP), each capable of 12.8 GFlops/sec for 64-bit
operations. Each MSP is comprised of four single
streaming processors (SSPs). The SSP uses two
clock frequencies, 800 MHz for the vector units and
400 MHz for the scalar unit. Each SSP is capable of
3.2 GFlops/sec for 64-bit operations. MSPs are fully
connected within 16 MSP subsets, and are
connected via a 2-D torus between subsets.
• Cray X1E at ORNL: 1024 Multistreaming processors
(MSP), each capable of 18 GFlops/sec for 64-bit
operations. Each MSP is comprised of four single
streaming processors (SSPs). The SSP uses two
clock frequencies, 1130 MHz for the vector units
and 565 MHz for the scalar unit. Each SSP is](https://image.slidesharecdn.com/crayl-130714223925-phpapp02/85/Crayl-2-320.jpg)
![Published at the 2006 Cray User Group Meeting, Lugano, Switzerland.
- 4 -
SGI Altix (ORNL) 3.7
As discussed earlier, the choice of the Opteron
model 150 was motivated in part to provide low access
latency to main memory. As Table 2 shows, our
measurements revealed that the Opteron 150 has
lower latency than the Opteron 248 configured as a 2-
way SMP in the XD1. Furthermore, it has considerably
smaller latency than either the POWER4 or the Intel
Xeon, which both support multiprocessor
configurations (and hence must include logic for
maintaining cache coherence that contributes to the
main memory access latency).
Table 2: Latency to Main Memory.
Platform
Measured Latency to
Main Memory (ns)
Cray XT3 / Opteron 150 / 2.4 GHz 51.41
Cray XD1 / Opteron 248 / 2.2 GHz 86.51
IBM p690 / POWER4 / 1.3 GHz 90.57
Intel Xeon / 3.0 GHz 140.57
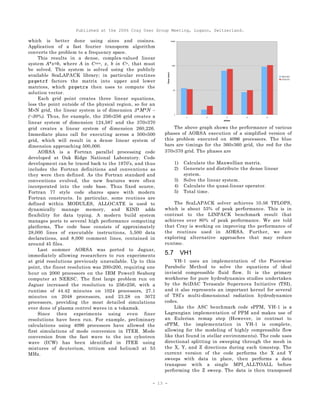
The memory hierarchy of the XT3 compute node is
obvious when measured with the CacheBench tool
[36]. Figure 2 shows that the system reaches a
maximum of approximately 9 GB/s when accessing
vectors of data in the L2 cache. When data is accessed
from main memory, the bandwidth drops to about 3
GB/s.
Figure 2: CacheBench read results for a single XT3
compute node.
4.2 Scientific Operations
We use a collection of micro-benchmarks to
characterize the performance of the underlying
hardware, compilers, and software libraries for common
operations in computational science. The micro-
benchmarks measure computational performance,
memory hierarchy performance, and inter-processor
communication. Figure 3 compares the double-
precision floating point performance of a matrix
multiply (DGEMM) on a single processor using the
vendors’ scientific libraries. In our tests, the XT3 with
the ACML 3.0 library achieved its highest DGEMM
performance for matrices of order 1600; the observed
performance was 4396 MB/s, approximately 91.6% of
the Opteron 150’s peak.
Figure 3: Performance of Matrix Multiply.
Fast Fourier Transforms are another operation
important to many scientific and signal processing
applications. Figure 4 plots 1-D FFT performance using
the vendor library (-lacml, -lscs, -lsci or -lessl), where
initialization time is not included. The XT3’s Opteron
is outperformed by the SGI Altix’s Itanium2 processor
for all vector lengths examined, but does better than
the Power4 processor in the p690 and better than the
X1E for short vectors.
Figure 4: Performance of 1-D FFT using vendor libraries.
In general, our micro-benchmark results suggest
performance stability from the XT3 compute nodes, in
that they may not be the best performing for any of
the micro-benchmarks but they perform reasonably
well on all of them.](https://image.slidesharecdn.com/crayl-130714223925-phpapp02/85/Crayl-4-320.jpg)
![Published at the 2006 Cray User Group Meeting, Lugano, Switzerland.
- 5 -
Figure 5: IMB PingPong benchmark latency.
4.3 MPI
Because of the predominance of the message-
passing programming model in contemporary scientific
applications, examining the performance of message-
passing operations is critical to understanding a
system’s expected performance characteristics when
running full applications. Because most applications
use the Message Passing Interface (MPI) library [41],
we evaluated the performance of each vendor’s MPI
implementation. For our evaluation, we used the Intel
MPI Benchmark (IMB) suite, version 2.3. In general,
the MPI performance of the Cray XT3 was observed to
be unexceptional compared to the other systems we
tested, and was even observed to be significantly worse
for some collectives with small messages.
Figure 6: IMB PingPong bandwidth.
Figure 5 and Figure 6 show the latency and
bandwidth, respectively, for the IMB PingPong
benchmark. Like all IMB benchmarks that report both
bandwidth and latency, the PingPong bandwidth is
calculated from the measured latency so the two
figures are different perspectives on the same data.
The null message latency on the XT3 was observed to
be just over 6 microseconds, and the maximum
bandwidth 1104 GB/s. The XT3 performance was
among the worst of the systems tested for messages
smaller than 1KB, and rises only to the middle of the
pack for larger messages. These results were collected
in April 2006; the latencies are 3% to 5% higher than
the latency we measured in November 2005 for short
messages, but the maximum bandwidth is very nearly
the same. Because the operating system, MPI
implementation, and SeaStar firmware have been
modified since November 2005, we cannot say with
certainty where to attribute the additional overhead.
Figure 7 and Figure 8 show the latency and
bandwidth, respectively, for the Intel Exchange
benchmark on the largest number of MPI tasks we
could obtain across all of our test systems. The
Exchange benchmark is intended to represent the
behavior of a code performing boundary-exchange
communication. In this benchmark, each task performs
one-dimensional nearest-neighbor communication
using MPI_Isend, MPI_Recv, and MPI_Waitall. The
benchmark program measures the time required to
send data to its left and right neighbor and to receive
data sent by those neighbors. Similar to the IMB
PingPong benchmark, bandwidth is computed from the
observed latency but considers that each process sends
two messages and receives two messages. Because this
benchmark measures latency and bandwidth using
point-to-point MPI operations when all MPI tasks are
communicating, it is a more realistic test of a system’s
MPI performance than the PingPong benchmark for a
large class of scientific applications. For the largest
number of MPI tasks we tested on the XT3 (4096), we
observed an average latency of 11.99 microseconds for
4-byte messages and a maximum bandwidth of 1262
MB/s for 512KB messages. The Cray XD1 showed the
best Exchange performance of the systems we tested
for messages smaller than 2KB, whereas we observed
the best performance for larger messages with the
Cray X1E.
Figure 7: IMB Exchange benchmark latency at 128 tasks.](https://image.slidesharecdn.com/crayl-130714223925-phpapp02/85/Crayl-5-320.jpg)
![Published at the 2006 Cray User Group Meeting, Lugano, Switzerland.
- 6 -
Figure 8: IMB Exchange benchmark bandwidth at 128
tasks.
Figure 9: IMB Allreduce benchmark latency at 128 tasks.
The MPI_Allreduce operation is particularly
important for several DOE simulation applications; for
some applications, it is used several times within each
simulation timestep. Its blocking semantics also
require that all tasks wait for its completion before
continuing, so the latency of this operation is an
important factor with regard to application scalability.
The IMB Allreduce benchmark tests the latency of the
MPI_Allreduce operation. (The IMB developers do not
consider bandwidth to be a well-defined concept for
MPI collective operations, so the IMB collective
benchmarks including Allreduce do not report a
bandwidth measurement.) Our IMB Allreduce latency
results are shown in Figure 9. The Cray XT3 Allreduce
performance is the worst among the systems tested for
small messages, whereas the Cray XD1 and X1E
performed very well for small messages and the X1E
was superior for messages larger than 2KB.
5 Applications
Insight into the performance characteristics of
low-level operations is important to understand overall
system performance, but because a system’s behavior
when running full applications is the most significant
measure of its performance, we also investigate the
performance and efficiency of full applications relevant
to the DOE Office of Science in the areas of global
climate, fusion, chemistry, and bioinformatics. The
evaluation team worked closely with principal
investigators leading the Scientific Discovery through
Advanced Computing (SciDAC) application teams to
identify important applications.
5.1 CAM
The Community Atmosphere Model (CAM) is a
global atmosphere model developed at the National
Science Foundation's National Center for Atmospheric
Research (NCAR) with contributions from researchers
funded by DOE and by NASA [14, 15]. CAM is used in
both weather and climate research. In particular,
CAM serves as the atmospheric component of the
Community Climate System Model (CCSM) [1, 7]. As a
community model, it is important that CAM run
efficiently on different architectures, and that it be
easily ported to and optimized on new platforms. CAM
contains a number of compile-time and runtime
parameters that can be used to optimize performance
for a given platform, problem or processor count. When
benchmarking with CAM it is important that the code
be optimized to approximately the same level as for a
production run, but no more. For example, production
usage requires that the results be invariant to the
number of processors used. This “reproducibility”
requirement can disallow some compiler optimizations.
CAM is a mixed-mode parallel application code,
using both MPI [41] and OpenMP protocols [16]. CAM
is characterized by two computational phases: the
dynamics, which advances the evolution equations for
the atmospheric flow, and the physics, which
approximates subgrid phenomena such as precipitation
processes, clouds, long- and short-wave radiation, and
turbulent mixing [14]. Control moves between the
dynamics and the physics at least once during each
model simulation timestep. The number and order of
these transitions depend on the numerical algorithm
in the dynamics.
CAM includes multiple dynamical cores (dycores),
one of which is selected at compile-time. Three dycores
are currently supported: the spectral Eulerian solver
from CCM [28], a spectral semi-Lagrangian solver [45],
and a finite volume semi-Lagrangian solver [30]. The
three dycores do not use the same computational grid.
An explicit interface exists between the dynamics and
the physics, and the physics data structures and
parallelization strategies are independent from those
in the dynamics. A dynamics-physics coupler moves
data between data structures representing the
dynamics state and the physics state.
For our evaluation we ported and optimized CAM
versions 3.0p1 and 3.1, available for download from
http://www.ccsm.ucar.edu/, as described in Worley [46].](https://image.slidesharecdn.com/crayl-130714223925-phpapp02/85/Crayl-6-320.jpg)
![Published at the 2006 Cray User Group Meeting, Lugano, Switzerland.
- 8 -
vertical in another phase, requiring two remaps of the
domain decomposition each timestep. For small
processor counts the 1D decomposition is faster than
the 2D decomposition, but the 1D decomposition must
have at least three latitudes per process and, so, is
limited to a maximum of 120 MPI processes for the D-
grid benchmark. Using a 2D decomposition requires at
least three latitudes and three vertical layers per
process, so is limited to 120×8, or 960, MPI processes
for the D-grid benchmark. OpenMP can again be used
to exploit additional processors. OpenMP is used by
the Earth Simulator and the IBM systems, but not by
the Cray systems. Each data point in Figure 11
represents the performance on the given platform for
the given processor count after optimizing over the
available virtual processor grids defining the domain
decomposition and after optimizing over the number of
OpenMP threads per MPI process. For the D-grid
benchmark the XT3 performs significantly better than
the Itanium2 cluster and the IBM SP and p690 cluster
systems. The XT3 performance lags that of the p575
cluster by 10 to 20 percent.
Figure 12 contains plots of the wallclock seconds
per simulation day for the dynamics and for the
physics for the XT3 and for the p575 cluster, one with
linear-log axes and one with linear-linear axes. The
IBM system uses OpenMP to decrease the number of
MPI processes, allowing the IBM system to use the 1D
domain decomposition in all experiments. The physics
costs are identical up through 200 processors. The
performance difference between the p575 cluster and
the XT3 for larger processor counts is almost entirely
due to the runtime difference in computing a global
sum and a write to standard out that occurs each
timestep. In contrast, dynamics is always faster on the
p575, decreasing from a 40% advantage for small
processor counts to 25% advantage for large processor
counts. The performance difference for large processor
counts appears to be due to a higher cost of writes to
standard out on the XT3, which increases in relative
importance with larger processor counts. For smaller
processor counts the reason for the performance
difference is not obvious. However the ratio of peak
per processor between the XT3 and p575 is 58%, so
some of the performance advantage could be due to
the processor speed advantage. This is still under
investigation.
5.2 Parallel Ocean Program (POP)
The Parallel Ocean Program (POP) [26] is the
ocean component of CCSM [8] and is developed and
maintained at Los Alamos National Laboratory
(LANL). The code is based on a finite-difference
formulation of the three-dimensional flow equations
on a shifted polar grid. In its high-resolution
configuration, 1/10-degree horizontal resolution, the
code resolves eddies for effective heat transport and
the locations of ocean currents.
POP performance is characterized by the
performance of two phases: baroclinic and barotropic.
The baroclinic phase is three dimensional with limited
nearest-neighbor communication and typically scales
well on all platforms. In contrast, runtime of the
barotropic phase is dominated by the solution of a two-
dimensional, implicit system. The performance of the
barotropic solver is very sensitive to network latency
and typically scales poorly on all platforms.
Figure 13: Performance of POP for x1 benchmark.
Figure 14: Performance of POP barotropic phase for x1
benchmark.
For our evaluation we used version 1.4.3 of POP
and two POP benchmark configurations. The first,
referred to as ‘x1,’ represents a relatively coarse
resolution similar to that currently used in coupled
climate models. The horizontal resolution is roughly
one degree (320×384) and uses a displaced-pole grid
with the pole of the grid shifted into Greenland and
enhanced resolution in the equatorial regions. The
vertical coordinate uses 40 vertical levels with smaller
grid spacing near the surface to better resolve the
surface mixed layer. Because this configuration does
not resolve eddies, it requires the use of
computationally intensive subgrid parameterizations.
This configuration is set up to be identical to the
production configuration of the Community Climate](https://image.slidesharecdn.com/crayl-130714223925-phpapp02/85/Crayl-8-320.jpg)
![Published at the 2006 Cray User Group Meeting, Lugano, Switzerland.
- 9 -
System Model with the exception that the coupling to
full atmosphere, ice and land models has been replaced
by analytic surface forcing.
Figure 13 shows a platform comparison of POP
throughput for the x1 benchmark problem. On the
Cray X1E, we considered an MPI-only implementation
and also an implementation that uses a Co-Array
Fortran (CAF) implementation of a performance-
sensitive halo update operation. All other results were
for MPI-only versions of POP. The BG/L experiments
were run in ‘virtual node’ mode. The XT3 performance
is similar to that of both the SGI Altix and the IBM
p575 cluster up to 256 processors, and continues to
scale out to 1024 processors even for this small fixed
size problem.
Figure 15: Performance of POP baroclinic phase for x1
benchmark.
Figure 14 shows the performance of the barotropic
portion of POP. While lower latencies on the Cray X1E
and SGI Altix systems give these systems an
advantage over the XT3 for this phase, the XT3 shows
good scalability in the sense that the cost does not
increase significantly out to 1024 processors. In
particular, scaling on the XT3 is superior to that of the
p575 cluster and continues to be competitive compared
to BG/L. Figure 15 shows the performance of the
baroclinic portion of POP. The Cray XT3 performance
was very similar to that of both the SGI Altix and the
p575 cluster, and shows excellent scalability.
The second benchmark, referred to as ‘0.1,’ utilizes
a 1/10-degree horizontal resolution (3600×2400) and 40
vertical levels. The 0.1 degree grid is also a displaced
posed grid with 1/10 degree (10km) resolution around
the equator down to 2.5km near the poles. The
benchmark uses a simple biharmonic horizontal mixing
rather than the more expensive subgrid
parameterizations used in the x1 benchmark. As
mentioned earlier, this resolution resolves eddies for
effective heat transport and is used for ocean-only or
ocean and sea ice experiments. The cost is prohibitive
for use in full coupled climate simulations at the
current time.
Figure 16 shows a platform comparison of POP
throughput for the 0.1 benchmark. Both performance
and scalability on the XT3 are excellent out to almost
5000 processors, achieving 66% efficiency when scaling
from 1000 to 5000 processors. Figure 17 shows the
performance of both the barotropic and baroclinic
phases. From this it is clear that 5000 processors is the
practical processor limit on the XT3 as the cost of the
barotropic phase dominates that of the baroclinic
phase for more than 4000 processors, and is not
decreasing. Note that both the X1E and the XT3
demonstrate superlinear speedup in the baroclinic
phase, indicating that the problem is still too large to
fit into the processor cache even at the maximum
processor count. A newer version of POP supports a
subblocking technique that should improve cache
locality for this benchmark.
Figure 16: Performance of POP for 0.1 benchmark.
Figure 17: Performance of POP phases for 0.1
benchmark.
5.3 GYRO
GYRO [12] is a code for the numerical simulation
of tokamak microturbulence, solving time-dependent,
nonlinear gyrokinetic-Maxwell equations with
gyrokinetic ions and electrons capable of treating
finite electromagnetic microturbulence. GYRO uses a](https://image.slidesharecdn.com/crayl-130714223925-phpapp02/85/Crayl-9-320.jpg)
![Published at the 2006 Cray User Group Meeting, Lugano, Switzerland.
- 10 -
five-dimensional grid and propagates the system
forward in time using a fourth-order, explicit Eulerian
algorithm. GYRO has been ported to a variety of
modern HPC platforms including a number of
commodity clusters. Since code portability and
flexibility are considered crucial to this code’s
development team, only a single source tree is
maintained and platform-specific optimizations are
restricted to a small number of low-level operations
such as FFTs. Ports to new architectures often involve
nothing more than the creation of a new makefile.
For our evaluation, we ran GYRO version 3.0.0 for
two benchmark problems, B1-std and B3-gtc. Newer
versions of GYRO are now available that achieve
better performance on all platforms. However, we have
not had the opportunity to benchmark our test
systems using the newer versions of the code. Thus
the performance data presented here is a consistent
measure of platform capabilities, but not a valid
evaluation of current GYRO performance.
Figure 18: GYRO performance for B1-std benchmark.
B1-std is the Waltz standard case benchmark [44].
This is a simulation of electrostatic turbulence using
parameters characteristic of the DIII-D tokamak at
mid-radius. Both electrons and ions are kinetic, and
electron collisions (pitch-angle scattering) are
included. The grid is 16×140×8×8×20. Since 16 toroidal
modes are used, a multiple of 16 processors must be
used to run the simulation. Interprocess
communication overhead for this problem is dominated
by the time spent in “transposes” used to change the
domain decomposition within each timestep. The
transposes are implemented using simultaneous
MPI_Alltoall collective calls over subgroups of
processes.
Figure 18 shows platform comparisons of GYRO
throughput for the B1-std benchmark problem. Note
that there is a strong algorithmic preference for
power-of-two numbers of processors for large processor
counts, arising from significant redundant work when
not using a power-of-two number of processes. This
impacts performance differently on the different
systems. The XT3 performance is superior to all of the
other platforms except the X1E. Scaling on the XT3 is
also excellent out to 512 processors.
Figure 19 plots the ratio of the time spent in the
communication transposes to full runtime. The
transposes for this problem size are sensitive to both
latency and bandwidth. By this metric, the
communication performance of the XT3 is among the
best compared to the other systems up to 512
processors. The somewhat poor latency on the XT3
degrades this performance metric at higher processor
counts compared to the X1E and BG/L.
Figure 19: Ratio of time for GYRO transpose
communication to total run time for B1-std benchmark.
Figure 20: GYRO performance for B3-gtc benchmark.
B3-gtc is a high-toroidal-resolution electrostatic
simulation with simplified electron dynamics (only ions
are kinetic). The grid is 64×400×8×8×20. This case uses
64 toroidal modes and must be run on multiples of 64
processors. The 400-point radial domain with 64
toroidal modes gives extremely high spatial resolution,
but electron physics is ignored, allowing a simple field
solve and large timesteps. As with the B1-std
benchmark, interprocess communication overhead for
this problem is dominated by the time spent in the
transposes.](https://image.slidesharecdn.com/crayl-130714223925-phpapp02/85/Crayl-10-320.jpg)
![Published at the 2006 Cray User Group Meeting, Lugano, Switzerland.
- 11 -
Figure 20 shows platform comparisons of GYRO
throughput for the B3-gtc benchmark problem. As
with B1-std, there is an algorithmic preference for
power-of-two numbers of processors for large processor
counts, The Altix is somewhat superior to the XT3 out
to 960 processors, but XT3 scalability is excellent,
achieving the best overall performance at 4,096
processors.
Figure 21 plots the time spent in the
communication transposes for this benchmark. Figure
22 plots the ratio of the time spent in the
communication transposes to full runtime. The
transposes for this problem size are primarily a
measure of communication bandwidth. By these
metrics, the communication performance of the XT3 is
excellent compared to the other systems, beating even
that of the X1E when the relative speed of the rest of
the computation is taken into account.
Figure 21: GYRO transpose communication
performance for B3-gtc benchmark.
Figure 22: Ratio of GYRO transpose communication
time to total run time for B3-gtc benchmark.
5.4 S3D
S3D is a code used extensively to investigate first-
of-a-kind fundamental turbulence-chemistry
interactions in combustion topics ranging from
premixed flames [13, 22], auto-ignition [19], to non-
premixed flames [23, 33, 42]. It is based on a high-
order accurate, non-dissipative numerical scheme.
Time advancement is achieved through a fourth-order
explicit Runge-Kutta method, differencing is achieved
through high-order (eighth-order with tenth-order
filters) finite differences on a Cartesian, structured
grid, and Navier-Stokes Characteristic Boundary
Conditions (NSCBC) are used to prescribe the
boundary conditions. The equations are solved on a
conventional structured mesh.
This computational approach is very appropriate
for direct numerical simulation of turbulent
combustion. The coupling of high-order finite
difference methods with explicit Runge-Kutta time
integration make very effective use of the available
resources, obtaining spectral-like spatial resolution
without excessive communication overhead and
allowing scalable parallelism.
Figure 23: S3D performance.
For our evaluation, the problem configuration is a
3D direct numerical simulation of a slot-burner bunsen
flame with detailed chemistry. This includes methane-
air chemistry with 17 species and 73 elementary
reactions. This simulation used 80 million grid points.
The simulation is part of a parametric study performed
on different Office of Science computing platforms: the
IBM SP at NERSC, the HP Itanium2 cluster at PNNL,
and the ORNL Cray X1E and XT3. Figure 23 shows
that S3D scales well across the various platforms and
exhibited a 90% scaling efficiency on the Cray XT3.
5.5 Molecular Dynamics Simulations
Molecular dynamics (MD) simulations enable the
study of complex, dynamic processes that occur in
biological systems [27]. The MD related methods are
now routinely used to investigate the structure,
dynamics, functions, and thermodynamics of biological
molecules and their complexes. The types of biological
activity that has been investigated using MD
simulations include protein folding, enzyme
catalysation, conformational changes associated with](https://image.slidesharecdn.com/crayl-130714223925-phpapp02/85/Crayl-11-320.jpg)
![Published at the 2006 Cray User Group Meeting, Lugano, Switzerland.
- 12 -
bimolecular function, and molecular recognition of
proteins, DNA, biological membrane complexes.
Biological molecules exhibit a wide range of time and
length scales over which specific processes occur, hence
the computational complexity of an MD simulation
depends greatly on the time and length scales
considered. With a solvation model, typical system
sizes of interest range from 20,000 atoms to more than
1 million atoms; if the solvation is implicit, sizes range
from a few thousand atoms to about 100,000. The time
period of simulation can range from pico-seconds to the
a few micro-seconds or longer.
Several commercial and open source software
frameworks for MD calculations are in use by a large
community of biologists, including AMBER [37] and
LAMMPS [39]. These packages use slightly different
forms of potential function and also their own force-
field calculations. Some of them are able to use force-
fields from other packages as well. AMBER provides a
wide range of MD algorithms. The version of LAMMPS
used in our evaluation does not use the energy
minimization technique, which is commonly used in
biological simulations.
Figure 24: AMBER Simulation Throughput
AMBER. AMBER consists of about 50 programs
that perform a diverse set of calculations for system
preparation, energy minimization (EM), molecular
dynamics (MD), and analysis of results. AMBER's main
module for EM and MD is known as sander (for
simulated annealing with NMR-derived energy
restraints). We used sander to investigate the
performance characteristics of EM and MD techniques
using the Particle Mesh Ewald (PME) and Generalized
Born (GB) methods. We performed a detailed analysis
of PME and GB algorithms on massively parallel
systems (including the XT3) in other work [3].
The bio-molecular systems used for our
experiments were designed to represent the variety of
complexes routinely investigated by computational
biologists. In particular, we considered the RuBisCO
enzyme based on the crystal structure 1RCX, using
the Generalized Born method for implicit solvent. The
model consists of 73,920 atoms. In Figure 24, we
represent the performance of the code in simulation
throughput, expressed as simulation pico-seconds per
real day (psec/day). The performance on the Cray XT3
is very good for large-scale experiments, showing a
throughput of over twice the other architectures we
investigated [3].
LAMMPS. LAMMPS (Large-scale
Atomic/Molecular Massively Parallel Simulator) [39] is
a classical MD code. LAMMPS models an ensemble of
particles in a liquid, solid or gaseous state and can be
used to model atomic, polymeric, biological, metallic or
granular systems. The version we used for our
experiments is written in C++ and MPI.
For our evaluation, we considered the RAQ system
which is a model on the enzyme RuBisCO. This model
consists of 290,220 atoms with explicit treatment of
solvent. We observed very good performance for this
problem on the Cray XT3 (see Figure 25), with over
60% efficiency on up to 1024 processors and over 40%
efficiency on 4096 processor run.
Figure 25: LAMMPS simulation throughput with
approximately 290K atoms.
5.6 AORSA
The 2- and 3-D all-orders spectral algorithms
(AORSA) [25] code is a full-wave model for radio
frequency heating of plasmas in fusion energy devices
such as ITER, the international tokamak project.
AORSA solves the more general integral form of the
wave equation with no restriction on wavelength
relative to orbit size and no limit on the number of
cyclotron harmonics. With this approach, the limit on
attainable resolution comes not from the model, but
only from the size and speed of the available computer.
AORSA operates on a spatial mesh, with the
resulting set of linear equations solved for the Fourier
coefficients. The problem size is characterized by the
total number of Fourier modes retained by the model.
The physical process is described using a continuous
integral equation involving polynomials. The discrete
solution must capture the periodic wave behavior,](https://image.slidesharecdn.com/crayl-130714223925-phpapp02/85/Crayl-12-320.jpg)
![Published at the 2006 Cray User Group Meeting, Lugano, Switzerland.
- 14 -
back with a second MPI_ALLTOALL before the next
timestep.
The benchmark problem is a standard Sod shock
tube in three dimensions. The benchmark is scaled up
with increasing processor count (in keeping with the
canonical use of the code), with the total number of
zones increasing as the square of the number of
processors.
Figure 26: VH-1 performance for 3D Sod shock tube
benchmark.
5.8 PFLOTRAN
PFLOTRAN (Parallel FLOw and TRANsport) [21,
29, 31, 32, 35] is a state-of-the-art prototype code for
modeling multiphase, multicomponent reactive
subsurface environmental flows. It is currently being
used to understand problems at the Nevada Test Site
and the Hanford 300 Area, as well as for geologic CO2
sequestration studies. The code employs domain-
decomposition based parallelism and is built from the
ground up using the PETSc framework [5, 6] from
Argonne National Laboratory. PFLOTRAN consists of
two distinct modules: a flow module (PFLOW) that
solves an energy balance equation and mass
conservation equations for water and other fluids, and
a reactive transport module (PTRAN) that solves mass
conservation equations for a multicomponent
geochemical system. In coupled mode, flow velocities,
saturation, pressure and temperature fields computed
from PFLOW are fed into PTRAN. For transient
problems, sequential coupling of PFLOW and PTRAN
enables changes in porosity and permeability due to
chemical reactions to alter the flow field.
Governing equations are discretized using an
integral finite-volume formulation on an orthogonal
structured grid (extension to unstructured grids is
planned). Time-stepping is fully implicit (backward
Euler). The nonlinear equations arising at each time
step are solved using the Newton-Krylov solver
framework of PETSc, allowing easy selection of the
most appropriate solvers and preconditioners for the
problem at hand.
Figure 27: PFLOTRAN performance.
PFLOTRAN has shown excellent parallel
scalability. Figure 27 illustrates the performance of
the PFLOW module on a modest sized thermo-
hydrologic benchmark problem on a 256 x 64 x 256 grid
with three degrees of freedom per node (approximately
12.6 million degrees of freedom total). In this case, the
linear systems within the Newton method are solved
using GMRES(30) with a block-Jacobi pre-conditioner
with ILU(0) on each block. The benchmark was run on
both the MPP2 Itanium2 cluster (1960 1.5 GHz
Itanium2 processors with Quadrics QsNetII
interconnect) at PNNL and the Cray XT3 at ORNL.
Scaling is exceptionally good on the XT3, with linear
speedup on up to 2048 processors, and modest speedup
when going to 4096 processors, at which point the
modest problem size becomes apparent and the
numerous MPI Reductions inside the linear system
solver present a scalability barrier. Since reactive flow
problems for production runs will often involve 10-20
chemical degrees of freedom per node, we expect to see
even better parallel efficiency for problems involving
reactive chemistry.
6 Conclusions and Plans
Oak Ridge National Laboratory has received and
installed a 5,294 processor Cray XT3. In this paper we
describe our performance evaluation of the system as
it was being deployed, including micro-benchmark,
kernel, and application benchmark results. We focused
on applications from important Department of Energy
applications areas including climate and fusion. In
experiments with up to 4096 processors, we observed
that the Cray XT3 shows tremendous potential for
supporting the Department of Energy application
workload, with good scalar processor performance and
high interconnect bandwidth when compared to other
microprocessor-based systems.](https://image.slidesharecdn.com/crayl-130714223925-phpapp02/85/Crayl-14-320.jpg)
![Published at the 2006 Cray User Group Meeting, Lugano, Switzerland.
- 15 -
Acknowledgements
This research was sponsored by the Office of
Mathematical, Information, and Computational
Sciences, Office of Science, U.S. Department of Energy
under Contract No. DE-AC05-00OR22725 with UT-
Battelle, LLC. Accordingly, the U.S. Government
retains a non-exclusive, royalty-free license to publish
or reproduce the published form of this contribution,
or allow others to do so, for U.S. Government
purposes.
Also, we would like to thank Jeff Beckleheimer,
John Levesque, Nathan Wichmann, and Jim
Schwarzmeier of Cray, and Don Maxwell of ORNL for
all their assistance in this endeavor.
We gratefully acknowledge Jeff Kuehn of ORNL
for collection of performance data on the BG/L system;
Hongzhang Shan of LBL for collecting GYRO
performance data on the IBM SP; James B. White III
for collecting POP performance data on the p575
cluster; Yoshikatsu Yoshida for collecting POP
performance data on the Earth Simulator; David
Parks for collecting CAM performance data on the
Earth Simulator; Michael Wehner for collecting CAM
performance data on the IBM SP; and Arthur Mirin
for collecting CAM performance data on the Itanium2
cluster at LLNL. We thank the National Energy
Research Scientific Computing Center for access to
the IBM SP, Argonne National Laboratory for access
to the IBM BG/L, the NASA Advanced
Supercomputing Division for access to their SGI Altix,
and the ORNL Center for Computational Sciences
(CCS) for access to the Cray X1, Cray X1E, Cray XD1,
Cray XT3, IBM p690 cluster, and SGI Altix. The CCS
is supported by the Office of Science of the U.S.
Department of Energy under Contract No. DE-AC05-
00OR22725.
References
[1] Community Climate System Model,
http://www.ccsm.ucar.edu/.
[2] P.A. Agarwal, R.A. Alexander et al., “Cray X1
Evaluation Status Report,” ORNL, Oak Ridge,
TN, Technical Report ORNL/TM-2004/13, 2004,
http://www.csm.ornl.gov/evaluation/PHOENIX/P
DF/CRAYEvaluationTM2004-15.pdf.
[3] S.R. Alam, P. Agarwal et al., “Performance
Characterization of Molecular Dynamics
Techniques for Biomolecular Simulations,” Proc.
ACM SIGPLAN Symposium on Principles and
Practice of Parallel Programming (PPOPP), 2006.
[4] AMD, “Software Optimization Guide for AMD
Athlon™ 64 and AMD Opteron™ Processors,”
Technical Manual 25112, 2004.
[5] S. Balay, K. Buschelman et al., “PETSc Users
Manual,” Argonne National Laboratory 2004.
[6] S. Balay, K. Buschelman et al., PETSc Web page,
2001.
[7] M.B. Blackmon, B. Boville et al., “The
Community Climate System Model,” BAMS,
82(11):2357--76, 2001.
[8] M.B. Blackmon, B. Boville et al., “The
Community Climate System Model,” BAMS,
82(11):2357-76, 2001.
[9] R. Brightwell, W. Camp et al., “Architectural
Specification for Massively Parallel Computers-
An Experience and Measurement-Based
Approach,” Concurrency and Computation:
Practice and Experience, 17(10):1271-316, 2005.
[10] R. Brightwell, L.A. Fisk et al., “Massively Parallel
Computing Using Commodity Components,”
Parallel Computing, 26(2-3):243-66, 2000.
[11] R. Brightwell, R. Riesen et al., “Portals 3.0:
Protocol Building Blocks for Low Overhead
Communication,” Proc. Workshop on
Communication Architecture for Clusters (in
conjunction with International Parallel &
Distributed Processing Symposium), 2002, pp.
164-73.
[12] J. Candy and R. Waltz, “An Eulerian gyrokinetic-
Maxwell solver,” J. Comput. Phys., 186(545),
2003.
[13] J.H. Chen and H.G. Im, “Stretch effects on the
Burning Velocity of turbulent premixed ydrogen-
Air Flames,” Proc. Comb. Inst, 2000, pp. 211-8.
[14] W.D. Collins and P.J. Rasch, “Description of the
NCAR Community Atmosphere Model (CAM
3.0),” National Center for Atmospheric Research,
Boulder, CO 80307 2004.
[15] W.D. Collins, P.J. Rasch et al., “The Formulation
and Atmospheric Simulation of the Community
Atmosphere Model: CAM3,” Journal of Climate,
to appear, 2006.
[16] L. Dagum and R. Menon, “OpenMP: : An
Industry-Standard API for Shared-Memory
Programming,” IEEE Computational Science &
Engineering, 5(1):46--55, 1998.
[17] T.H. Dunigan, Jr., J.S. Vetter et al.,
“Performance Evaluation of the Cray X1
Distributed Shared Memory Architecture,” IEEE
Micro, 25(1):30-40, 2005.
[18] T.H. Dunigan, Jr., J.S. Vetter, and P.H. Worley,
“Performance Evaluation of the SGI Altix 3700,”
Proc. International Conf. Parallel Processing
(ICPP), 2005.
[19] T. Echekki and J.H. Chen, “Direct numerical
simulation of autoignition in non-homogeneous
hydrogen-air mixtures,” Combust. Flame, 134:169-
91, 2003.
[20] M.R. Fahey, S.R. Alam et al., “Early Evaluation
of the Cray XD1,” Proc. Cray User Group
Meeting, 2005, pp. 12.
[21] G.E. Hammond, A.J. Valocchi, and P.C. Lichtner,
“Application of Jacobian-free Newton-Krylov with
physics-based preconditioning to biogeochemical](https://image.slidesharecdn.com/crayl-130714223925-phpapp02/85/Crayl-15-320.jpg)
![Published at the 2006 Cray User Group Meeting, Lugano, Switzerland.
- 16 -
transport,” Advances in Water Resources, 28:359--
76, 2005.
[22] E.R. Hawkes and J.H. Chen, “Direct numerical
simulation of hydrogen-enriched lean premixed
methane-air flames,” Combust. Flame, 138(3):242-
58, 2004.
[23] E.R. Hawkes, R. Sankaran et al., “Direct
numerical simulation of turbulent combustion:
fundamental insights towards predictive models,”
Proc. SciDAC PI Meeting, 2005.
[24] High-End Computing Revitalization Task Force
(HECRTF), “Federal Plan for High-End
Computing,” Executive Office of the President,
Office of Science and Technology Policy,
Washington, DC 2004.
[25] E.F. Jaeger, L.A. Berry et al., “?????,” Phys.
Plasmas, 8(1573), 2001.
[26] P.W. Jones, P.H. Worley et al., “Practical
performance portability in the Parallel Ocean
Program (POP),” Concurrency and Computation:
Experience and Practice(in press), 2004.
[27] M. Karplus and G.A. Petsko, “Molecular dynamics
simulations in biology,” Nature, 347, 1990.
[28] J.T. Kiehl, J.J. Hack et al., “The National Center
for Atmospheric Research Community Climate
Model: CCM3,” Journal of Climate, 11:1131--49,
1998.
[29] P.C. Lichtner and A. Wolfsberg, “Modeling
Thermal-Hydrological-Chemical (THC) Coupled
Processes with Applications to Underground
Nuclear Tests at the Nevada Test Site; A Grand
Challenge Supercomputing Problem,” Proc. MPU
Workshop: Conceptual Model Development for
Subsurface Reactive Transport Modeling of
Inorganic Contaminants, Radionuclides and
Nutrients, 2004.
[30] S.J. Lin, “A vertically Lagrangian finite-volume
dynamical core for global models,” MWR,
132(10):2293--307, 2004.
[31] C. Lu and P.C. Lichtner, “PFLOTRAN: Massively
Parallel 3-D Simulator for CO2 Sequestration in
Geologic Media,” in DOE-NETL Fourth Annual
Conference on Carbon Capture and Sequestration,
2005
[32] C. Lu, P.C. Lichtner et al., “Parametric study of
CO2 sequestration in geologic media using the
massively parallel computer code PFLOTRAN,”
Proc. AGU Fall Meeting, 2005.
[33] S. Mahalingam, J.H. Chen, and L. Vervisch,
“Finite-rate chemistry and transient effects in
direct numerical simulations of turbulent non-
premixed flames,” Combust. Flame, 102(3):285-97,
1995.
[34] T.G. Mattson, D. Scott, and S.R. Wheat, “A
TeraFLOP Supercomputer in 1996: The ASCI
TFLOP System,” Proc. 10th International
Parallel Processing Symposium (IPPS 96), 1996,
pp. 84-93.
[35] R.T. Mills, P.C. Lichtner, and C. Lu,
“PFLOTRAN: A massively parallel simulator for
reactive flows in geologic media (poster),” in
SC2005, 2005
[36] P.J. Mucci, K. London, and J. Thurman, “The
CacheBench Report,” University of Tennessee,
Knoxville, TN 1998.
[37] D.A. Pearlman, D.A. Case et al., “AMBER, a
package of computer programs for applying
molecular mechanics, normal mode analysis,
molecular dynamics and free energy calculations
to simulate the structural and energetic
properties of molecules,” Computer Physics
Communication, 91, 1995.
[38] K. Pedretti, R. Brightwell, and J. Williams,
“Cplant Runtime System Support for Multi-
Processor and Heterogeneous Compute Notes,”
Proc. IEEE International Conference on Cluster
Computing (CLUSTER 2002), 2002, pp. 207-14.
[39] S.J. Plimpton, “Fast Parallel Algorithms for
Short-Range Molecular Dynamics,” in Journal of
Computational Physics, vol. 117, 1995
[40] S.L. Scott, “Synchronization and Communication
in the T3E Multiprocessor,” Proc. Architectural
Support for Programming Languages and
Operating Systems (ASPLOS), 1996, pp. 26-36.
[41] M. Snir, W.D. Gropp et al., Eds., MPI--the
complete reference (2-volume set), 2nd ed.
Cambridge, Mass.: MIT Press, 1998.
[42] J.C. Sutherland, P.J. Smith, and J.H. Chen,
“Quantification of Differential Diffusion in
Nonpremixed Systems,” Combust. Theory and
Modelling (to appear), 2005.
[43] US Department of Energy Office of Science, “A
Science-Based Case for Large-Scale Simulation,”
US Department of Energy Office of Science 2003,
http://www.pnl.gov/scales.
[44] R.E. Waltz, G.R. Kerbel, and J. Milovich,
“Toroidal gyro-Landau fluid model turbulence
simulations in a nonlinear ballooning mode
representation with radial modes,” Phys.
Plasmas, 1:2229, 1994.
[45] D.L. Williamson and J.G. Olson, “Climate
simulations with a semi-Lagrangian version of
the NCAR Community Climate Model,” MWR,
122:1594--610, 1994.
[46] P.H. Worley, “CAM Performance on the X1E and
XT3,” Proc. Proceedings of the 48th Cray User
Group Conference, May 8-11, 2006, 2006.](https://image.slidesharecdn.com/crayl-130714223925-phpapp02/85/Crayl-16-320.jpg)

This document provides a status update on Oak Ridge National Laboratory's evaluation of the Cray XT3 supercomputer. It describes the XT3 system architecture including its AMD Opteron processors, SeaStar interconnect, and lightweight operating system. It also summarizes performance results from microbenchmarks, kernels, and applications in areas like climate, biology, astrophysics, combustion, and fusion on up to 4,096 processors, demonstrating the XT3's competitive performance, interconnect bandwidth, and parallel efficiency.