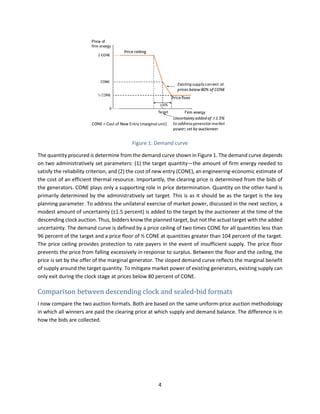
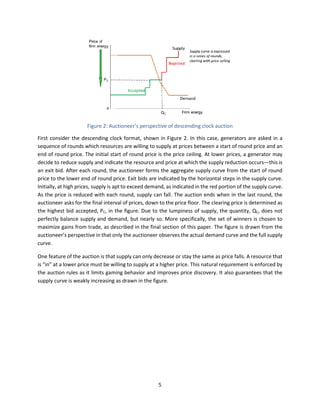
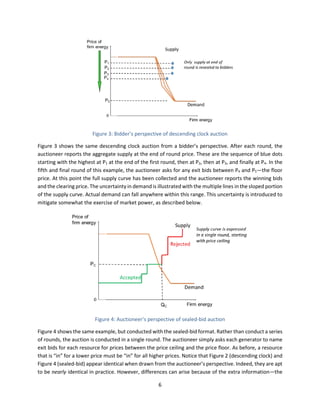
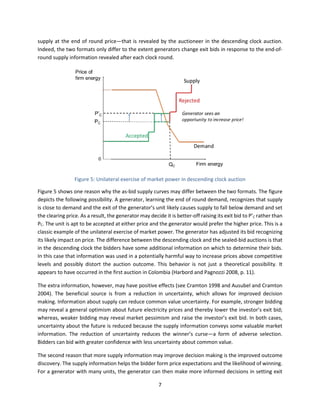
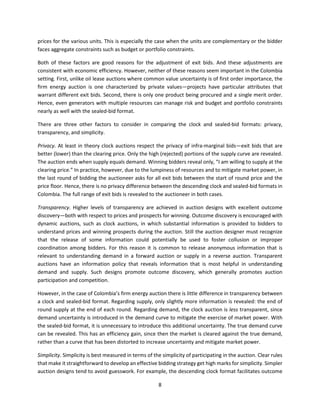
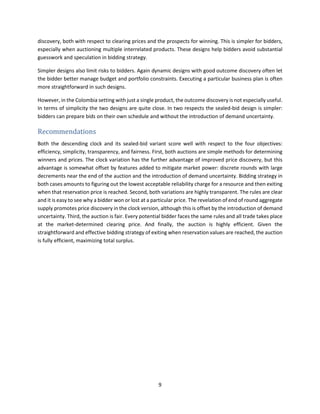
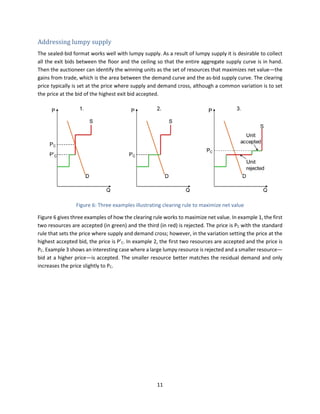
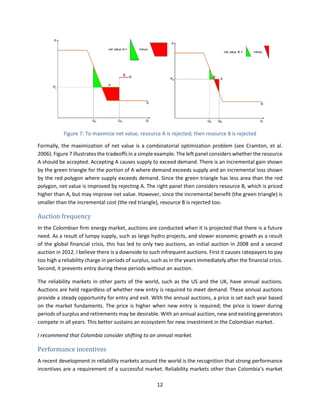
The document compares two auction formats - descending clock and sealed-bid - for Colombia's firm energy auctions. The descending clock format currently used asks generators in rounds if they will supply at lower prices until supply is less than demand, paying all winners the clearing price. The document argues the sealed-bid format may be preferable, as it is simpler and prevents strategic supply reduction in later rounds of descending clock auctions. Overall, the sealed-bid approach better balances efficiency, transparency, simplicity and fairness for Colombia's auction objectives and market features.
Types of Government Pricing Mechanisms & TendersKakoli Laha
This document discusses various types of government pricing mechanisms and tendering processes. It describes price control mechanisms like control prices and support prices that governments use to regulate markets. It also explains dual pricing, where the government sells part of a good's supply at a controlled price and the rest at market prices. Tendering involves governments or companies inviting bids for projects with clear timelines. The document outlines the different types of tenders and provides a detailed overview of the typical tendering process. It also gives examples of pricing policies and tendering in countries like India, the US, Spain, Canada and the UK.
Key Takeaways:
- Overview on Profit Split Method
- Strengths and Weaknesses
- Indicators and Approaches
- Measures of Profit and Profit Splitting Factors
The document summarizes research on modeling strategic behavior in electricity markets. It discusses how tacit collusion can emerge due to market characteristics like concentration, repeated interaction, and transparency. A simulation model is developed to reproduce tacit collusion using reinforcement learning. The model considers generation costs, availability, demand scenarios, and transmission constraints. Simulation results show prices increase with higher concentration and are restrained by uncertainties. The Lerner index indicates greater exercise of market power through tacit collusion under higher concentration.
The International Journal of Engineering and Science (The IJES)theijes
The International Journal of Engineering & Science is aimed at providing a platform for researchers, engineers, scientists, or educators to publish their original research results, to exchange new ideas, to disseminate information in innovative designs, engineering experiences and technological skills. It is also the Journal's objective to promote engineering and technology education. All papers submitted to the Journal will be blind peer-reviewed. Only original articles will be published.
The papers for publication in The International Journal of Engineering& Science are selected through rigorous peer reviews to ensure originality, timeliness, relevance, and readability.
The document discusses various pricing strategies firms can use when they have market power, including price discrimination, peak-load pricing, and two-part tariffs. It explains how firms can segment markets and charge different prices to maximize profits by capturing consumer surplus. Specifically, it covers first-degree, second-degree, and third-degree price discrimination, and discusses examples like airlines, movies, and electricity pricing. The two-part tariff is introduced as a strategy to separate the decision to purchase a good into two prices: a fixed entry fee and a variable usage fee.
The document discusses key concepts related to monopoly markets including:
1) Monopolies have a single seller, sell a unique product without close substitutes, and erect barriers to entry.
2) A profit-maximizing monopolist will produce where marginal revenue equals marginal cost.
3) Monopolies can engage in price discrimination by charging different prices to different consumer groups.
The document discusses market power and pricing strategies in the smartphone industry, noting that average smartphone selling prices are expected to fall 9% in 2013 due to intense competition between manufacturers as well as emerging markets and substitute devices. It also explores concepts of economies of scale that can lower costs and prices for consumers as smartphone production increases.
This document discusses the concept of price discrimination, which involves a firm charging different prices to different consumers for the same good or service. It provides definitions and key conditions for price discrimination, including that the firm must have some control over prices. It also gives examples of different degrees of price discrimination, including perfect 1st degree discrimination, 2nd degree excess capacity pricing, and 3rd degree market segmentation. The document outlines some potential advantages of price discrimination and notes that in practice, factors beyond just demand elasticity can influence price differences. It concludes by providing links to additional resources on the topic.
Firms In Competetive Markets_Chapter 14_Microrconomics_G. Mankewdjalex035
This chapter discusses firms in competitive markets. It will examine how competitive firms make decisions about output levels, shutdowns, and exiting/entering the market. The chapter defines competitive markets as having many small firms, homogeneous products, and free entry and exit. Competitive firms are price takers and seek to maximize profits by producing at the quantity where marginal revenue equals marginal cost. The portion of the marginal cost curve above average variable cost represents a firm's short-run supply curve. In the long run, firms exit if price is below average total cost or enter if price is above.
This document discusses monopolies and profit maximization under monopoly. It begins by asking several questions about why monopolies arise, how monopolies choose price and quantity, and what governments can do about monopolies. It then defines a monopoly and explains that monopolies arise due to barriers to entry in the market. A monopoly faces a downward-sloping demand curve and sets price and quantity by producing where marginal revenue equals marginal cost. This results in the monopoly price being above marginal cost and a deadweight loss to society.
In several European Union Member States (as well as in other Countries around the world) energy markets are often coupled with tools that remunerate directly the electric generation capacity, the so-called Capacity Remuneration Mechanisms, which are set to provide sufficient incentives to meet the (future) needs of electricity in a secure manner.
The webinar will: define what CRMs are; provide an analytical framework to evaluate the need to implement CRMs (if any); classify them and explain their pro and cons; review how markets for capacities are defined and operates in the EU and in (some) other cases worldwide.
This document summarizes key characteristics of monopolistic competition. In 3 sentences: Firms in monopolistic competition have differentiated but substitutable products, they set price between the monopoly and competitive levels where marginal revenue equals marginal cost to earn normal profits in the long run, and while this leads to higher prices than perfect competition it provides benefits to consumers like variety and innovation.
Price optimization uses three predictive models - claim propensity, market situation, and customer behavior - to set prices that maximize profits given constraints. An example is Parker Hannifin, which implemented demand-based pricing and saw profits rise from 7% to 21%. Price optimization integrates these models to predict how customers respond to price changes and identify optimal pricing strategies.
The document discusses market structures and perfect competition. It defines a market and provides quotes defining a market. It then discusses the characteristics of perfect competition, including large numbers of buyers and sellers, homogeneous products, and perfect information. Equilibrium for a firm under perfect competition occurs where marginal cost equals marginal revenue and the marginal cost curve cuts the marginal revenue curve from below.
This document summarizes a paper by Aghion and Bolton on entry-prevention contracts. The paper argues that exclusive contracts between sellers and buyers are designed to prevent entry from potential competitors and extract some of the surplus an entrant could gain. These contracts introduce social costs by blocking more efficient entrants from the market. The contracts specify liquidated damages that act as an entry fee, requiring entrants to lower prices enough to induce the buyer to switch and pay damages to the incumbent seller. While initially arguing long-term contracts are mutually beneficial, the paper finds empirical evidence shows contracts are actually short-term, and seeks to determine the optimal contract length from the perspective of minimizing social costs from entry prevention.
This document discusses perfect competition and its key characteristics. It can be summarized in 3 sentences:
Perfect competition is characterized by a large number of buyers and sellers, homogeneous products, free entry and exit of firms, and perfect knowledge. Under perfect competition, the interaction of supply and demand determines the equilibrium price where quantity supplied equals quantity demanded. Shifts in supply or demand curves will cause the equilibrium price to change accordingly.
Competition policy, cartel enforcement and leniency programDr Danilo Samà
Competition policy, cartel enforcement and leniency program
Author:
Dr Danilo Samà (LUISS “Guido Carli” University)
Abstract:
The present assessment focuses on the antitrust action in detecting and fighting oligopolistic collusion, analyzing the development of the innovative and modern leniency policy. Following the examination of the main conditions and reasons for cartel stability and sustainability, our attempt is to comprehend under which circumstances leniency program represents a functional and successful tool for preventing the formation of anti-competitive agreements.
Keywords:
cartels enforcement, competition policy, game theory, leniency program, oligopolistic markets
JEL classification:
C70; K21; L13
Year:
2008
Pages:
1-12
Citation:
Samà, Danilo (2008), Competition policy, cartel enforcement and leniency program, LUISS “Guido Carli” University, Rome, Italy, pp. 1-12.
Capital Asset Pricing Model, CAPM Assumptions, Borrowing and Lending Possibilities, Risk-Free Lending, Borrowing Possibilities, The New Efficient Set, Portfolio Choice, Market Portfolio, Characteristics of the Market Portfolio, Capital Market Line, The Separation Theorem, Security Market Line, CAPM’s Expected Return-Beta Relationship, How Accurate Are Beta Estimates?,
Prepared by Students of University of Rajshahi
Shahin Islam
Aslam Hossain
Shahidul Islam
Amy Khatun
Sohanuzzaman Sohan
MD. Rehan
Bikash Kumar
Rahid Hasan
Ali Haider
Uttam Kumar
MD. Abdullah AL Mamun
Mamunur Rahman
presented by Mango squad
For downloading this contact- bikashkumar.bk100@gmail.com
This document provides advice and tips for achieving strong exam performance in A2 Microeconomics. It emphasizes using economic concepts and contextualizing answers with diagrams and data. Key points include defining terms, explaining answers thoroughly, annotating diagrams, and including critical evaluations. Sample multiple choice questions are provided as examples of structured responses. The document also directs students to online resources for additional help from teachers and fellow students on social media.
Financial Mgt. - Capital Asset Pricing ModelKaustabh Basu
This document presents an overview of the Capital Asset Pricing Model (CAPM). It discusses the key assumptions of CAPM, including that investors hold diversified portfolios and can borrow/lend at the risk-free rate. CAPM represents the relationship between required return and systematic risk using the formula: Ke = Rf + β(Rm - Rf). It also discusses the different degrees of market efficiency, advantages of CAPM in considering only systematic risk, and disadvantages such as its assumptions. The conclusion states that while criticisms exist, CAPM remains a useful model and stands up well to criticism.
Surveys a number of essential issues related to pricing and public policy in market economies. Begins with a brief review of the price-determination process in competitive markets, then examines a range of topics involving pricing and public policy in monopoly and oligopoly markets. Includes a number of graphs that illustrate the relationship between costs, demand, price, efficiency, and profitability under various market conditions.
LABSON Asset Valuation and the Test for Excessive Pricing Invited Paper ACER ...Stephen Labson
The document discusses asset valuation methodologies that can be used to construct price-cost tests for assessing excessive pricing under competition law. It summarizes the Sasol case, which established that "economic value" refers to the competitive market price in a hypothetical competitive market. It also notes that the court called for additional evidence on asset valuation, capital returns, and cost allocation, which are areas where regulatory economics provides tools. The document then examines the concept of long-run competitive equilibrium referenced in the Sasol case and explores alternatives to perfect competition models that are relevant to assessing excessive pricing.
Credibility in threats and commitments in sequential games is base.docxvanesaburnand
Credibility in threats and commitments in sequential games is based on
randomizing one's actions so they are unpredictable
explicit communications with competitors
effective scenario planning
analyzing best reply responses
In a game, a dominated strategy is one where:
It is always the best strategy
It is always the worst strategy
It is the strategy that is the best among the group of worst possible strategies.
Is sometimes the best and sometimes the worst strategy
The starting point of many methods for predicting equilibrium strategy in sequential games is
designing proactive reactions to rival actions
information sets
uncertain outcomes
backwards induction based on an explicit order of play
endgame analysis
If one-time gains from defection are always less than the discounted present value of an infinite time stream of cooperative payoffs at some given discount rate, the decision-makers have escaped
the Folk Theorem
the law of large numbers
the Prisoner's dilemma
the paradox of large numbers
the strategy of recusal
Which of the following pricing policies best identifies when a product should be expanded, maintained, or discontinued?
full-cost pricing policy
target-pricing policy
marginal-pricing policy
market-share pricing policy
markup pricing policy
To maximize profits, a monopolist that engages in price discrimination must allocate output in such a way as to make identical the ____ in all markets.
ratio of price to marginal cost
ratio of marginal cost to marginal utility
ratio of price to elasticity
marginal revenue
The following are possible examples of price discrimination, EXCEPT:
prices in export markets are lower than for identical products in the domestic market.
senior citizens pay lower fares on public transportation than younger people at the same time.
a product sells at a higher price at location A than at location B, because transportation costs are higher from the factory to A.
subscription prices for a professional journal are higher when bought by a library than when bought by an individual.
__ is a new product pricing strategy which results in a high initial product price. This price is reduced over time as demand at the higher price is satisfied.
Prestige pricing
Price lining
Skimming
Incremental pricing
Third-degree price discrimination exists whenever:
the seller knows exactly how much each potential customer is willing to pay and will charge accordingly.
different prices are charged by blocks of services.
the seller can separate markets by geography, income, age, etc., and charge different prices to these different groups.
the seller will bargain with buyers in each of the markets to obtain the best possible price.
Governance mechanisms are designed
to increase contracting costs
to resolve post-contractual opportunism
to enhance the flexibility of restrictive covenants
to replace insurance
When retail bicycle dealers adver.
Chapter 5 Efficiency and Equity· Using prices in markets to a.docxchristinemaritza
Chapter 5: Efficiency and Equity
· Using prices in markets to allocate scarce resources is one of many alternative methods of allocating scarce resources.
· Tools such as consumer surplus and producer surplus help evaluate efficiency.
· The outcomes from the various methods used to allocate scarce resources, especially markets, can be examined in terms of both their efficiency and fairness.
I.
Resource Allocation Methods
Resources are scarce, so they somehow must be allocated. Different methods of allocating resources include:
· Market price: The people who are willing and able to buy a resource get the resource.
· Command: a command system allocates resources by the order (command) of someone in authority. A command system works well in organizations with clear lines of authority but does not work well at allocating resources in the entire economy.
· Majority rule: resources are allocated in accordance with majority vote. Majority rule works well when the allocation decisions being made affect a large number of people and self-interest leads to bad decisions.
· Contest: resources are allocated to the winner. Contests work well when the efforts of the players are hard to measure, such as top managers being in a contest to be named CEO of a company.
· First-come, first-serve: resources are allocated to those who are first in line. This allocation method works well when the resource can serve just one user at a time in a sequence, as is the case with, say, a bank teller or an ATM.
· Lottery: resources are allocated to the people who pick the winning number, choose the lucky card, etc. Lotteries work best when there is no effective way to distinguish among potential users of a scarce resource.
· Personal characteristics: resources are allocated to people with the “right” characteristics.
· Force: resources are allocated to those who can forcibly take the resources.
II.
Benefit, Cost, and Surplus
Demand, Willingness to Pay, and Value
· The value of one more unit of a good or service is its marginal benefit. Marginal benefit is the maximum price that people are willing to pay for another unit of a good or service. And the willingness to pay for a good or service determines the demand for it. Consequently the demand curve for a good or service is also its marginal benefit curve.
· The market demand curve is the horizontal sum of the individual demand curves and is formed by adding the quantities demanded by all the individuals at each price.
· The demand curve in the figure shows that the maximum price a person is willing to pay for the 6 millionth gallon of milk per month is $3, so $3 is the marginal benefit of this gallon.
· MSB curve: In the absence of externalities, which will be discussed later, the market demand curve is also the economy’s marginal social benefit (MSB) curve. It reflects the number of dollars’ worth of other goods and services willingly given up to obtain one more unit of a good.
· The figure shows that the ...
CURRENT RESEARCH ON REVERSE AUCTIONS: PART II -IMPLEMENTATION ISSUES ASSOCIAT...ijmvsc
This article serves as the second part in a two-part series that provides an overview of the reverse auction concept, building on the best research in the field of supply chain management. In this instalment, we look at the concerns involved in making reverse auctions work in practice – the implementation issues. Frist, we look at when reverse auctions should – and should not – be utilized by a buying organization. We then examine the decision rules that should be used in determining which of the competing suppliers wins the reverse auction. Next, we look at the best research available as to how the use of reverse auctions impacts the buyer-seller relationship. Finally, we examine what is in essence a “make or buy” decision in regards to whether the purchasing organization should run an auction in-house or make use of the services of a third-party “market maker.
This presentation by Robert Porter (Professor of Economics, Northwestern University, US) was made during a workshop on “Cartel screening in the digital era” held by the OECD in Paris on 30 January 2018. More papers and presentations on the topic can be found out at oe.cd/wcsde.
Advance Market Commitments for Climate Changecgdev
Center for Global Development visiting senior associate Jan von der Goltz presents some considerations for advance market commitments in the climate change context.
This document provides an overview of monopoly market structure. It defines monopoly as a market with a single seller, no close substitutes for the product, and high barriers to entry. Barriers include legal protections like patents, economies of scale, and ownership of necessary resources. A monopoly faces a downward-sloping demand curve and sets price above marginal cost to maximize profits where marginal revenue equals marginal cost. This results in lower output and higher prices than under perfect competition, reducing consumer surplus and creating deadweight loss.
Natural monopolies arise due to high startup costs and significant economies of scale that allow only one efficient firm. They are often regulated to protect consumers. Examples include utilities, internet providers, and railroads. A natural monopoly exists naturally due to market forces, unlike regular monopolies formed by eliminating competition. Natural monopolies have high fixed costs and barriers to entry that prevent competition. They maximize profits by pricing in the elastic portion of demand rather than the inelastic portion where price changes have little effect on revenue.
The California Carbon Exchange is an online platform proposing to reduce transaction costs and risks associated with trading California carbon allowances and offsets. It aims to target small to medium covered entities currently excluded from offset markets. While the potential market is large, projections are uncertain due to market barriers. The Exchange seeks competitive advantages through exclusive relationships with an offset insurer and cooperative project operators, and by moving first. However, until more information is obtained, the author considers the risk too high to invest significantly.
This document discusses market pricing decisions and market structures using Porter's model. It covers the key market structures of perfect competition, monopoly, monopolistic competition, and oligopoly. For each structure, it examines how firms make output and pricing decisions based on factors like demand elasticity, costs, and competitors' actions. It also analyzes the implications of each market structure for public interest, including impacts on prices, output, innovation, and resource allocation. Non-price competition strategies like advertising and product development are also briefly discussed.
This document discusses monopoly market structure. A monopoly exists when a single firm is the sole producer of a product with no close substitutes. Barriers to entry like ownership of key resources or government protection allow monopolies to exist. Unlike competitive firms, monopolies are price makers and set marginal revenue equal to marginal cost to maximize profits. This results in lower output and higher prices than under perfect competition, creating welfare losses. Monopolies can further increase profits through price discrimination by charging different prices to different customer groups. Policymakers address monopoly inefficiencies through various regulatory approaches.
This document provides information about obtaining fully solved assignments from an assignment help service. It lists an email address and phone number to contact for assistance with MBA course assignments. It then provides a sample assignment for the Managerial Economics course, covering all blocks and due by April 30th, 2014. The assignment includes 6 questions relating to topics like opportunity cost, demand curves, cost functions, oligopolistic markets, and the effects of supply and demand shifts. It concludes with a request to submit the completed assignment to the study center coordinator.
This document outlines the key elements needed for a competitive electricity market, including:
1) Separating generation, transmission, and distribution with competition in generation;
2) Ensuring open access to the transmission system and power pool for coordination/dispatch;
3) The power pool providing essential services like backup power and reserves;
4) Opportunity cost pricing through the power pool; and
5) Potentially extending competition to retail customers if distribution wires are regulated.
This summarizes a document about spectrum auctions. It discusses:
1) Since 1994, the FCC has conducted 33 spectrum auctions assigning thousands of licenses to hundreds of firms, raising over $40 billion. Countries worldwide now use auctions to assign spectrum.
2) The simultaneous ascending auction design used in most FCC auctions has generally been successful, but has weaknesses when competition is weak that can reduce revenues.
3) Auctions are preferred over administrative processes or lotteries for assigning spectrum because they tend to assign it to those who value it most and generate revenues for the government.
The document provides an analysis of competition in the GB electricity retail market. It finds that while price competition is strong, barriers to entry remain, particularly for smaller suppliers, such as dealing with government policy and regulatory intervention, liquidity issues, and network charge instability. However, forcing changes to reduce barriers also carries costs, so policymakers need to ensure benefits of new entry outweigh these costs. The market is evolving rapidly due to decarbonization goals, so its future structure is uncertain. Overall competition compares well internationally, but pressure to innovate should continue.
Social welfare is maximum in case of imperfect competitionAkeeb Siddiqui
There are two main approaches to welfare economics: the early neoclassical approach and the new welfare economics approach. The early approach assumes cardinal utility can be measured, while the new approach uses ordinal utility and Pareto efficiency. Perfect competition occurs when many small buyers and sellers trade homogeneous goods, while imperfect competition arises when firms have some control over prices through monopolies, oligopolies, or natural monopolies sanctioned by governments. Imperfectly competitive markets can result in inefficiencies like deadweight loss compared to perfectly competitive markets.
The document discusses key macroeconomic concepts including:
1. Microeconomics focuses on supply and demand forces at the individual firm or industry level, while macroeconomics looks at economy-wide phenomena like GDP.
2. Excess demand occurs when price is below the equilibrium price, resulting in demand exceeding supply.
3. Consumer surplus and producer surplus represent the benefits consumers and producers realize from buying and selling goods.
4. Full employment refers to an acceptable level of natural unemployment that controls inflation, often defined as the non-accelerating inflation rate of unemployment (NAIRU).
5. Government expenditure includes final consumption, investment, and transfer payments by the state.
- Monopolistic competition describes a market with many producers offering similar but differentiated products, with each firm having some control over price. Barriers to entry are low, allowing firms to freely enter and exit the market.
- In the short run, firms maximize profits where marginal revenue equals marginal cost. In the long run with free entry and exit, firms earn zero economic profit as supply and demand equilibrate.
- Oligopoly is dominated by a few large firms. These firms are interdependent and must consider competitors' responses in decision making. Barriers to entry allow oligopolies to persist and earn economic profits.
Bidding strategies in deregulated power marketGautham Reddy
This document provides a 3-page summary of a report on bidding strategies in deregulated power markets. It includes an introduction describing electricity markets and deregulation. It then covers market structure under deregulation and operation of power systems. The remainder of the document outlines the report's contents which include an analysis of various bidding strategies and algorithms, case studies, and a literature review citing 48 relevant sources.
1) The document discusses various concepts in microeconomics including monopoly, monopolistic competition, and price discrimination.
2) Under monopoly, a profit-maximizing firm will produce the quantity where marginal revenue equals marginal cost. This maximizes profits.
3) Under monopolistic competition, firms produce differentiated products and free entry leads to zero economic profits in the long-run. However, price still exceeds marginal cost, resulting in some deadweight loss.
4) Price discrimination allows firms to charge different prices to different customers. Perfect first-degree price discrimination involves charging each customer their reservation price. This maximizes a firm's profits.
A Solid Foundation of Savings and Competition: Why Competitive Bidding Works ...FedBid
This document discusses the use of reverse auctions for procuring small, readily-specifiable construction projects in the federal government. It begins by outlining the benefits of reverse auctions that were discussed in a previous research report. It then describes the opposition to reverse auctions from major construction industry trade groups, who claim construction projects are too complex. However, the document argues that while large construction projects may be unsuitable for reverse auctions, many routine small projects procured by federal agencies could be specified clearly enough. It presents analysis of reverse auction data from the FedBid platform that shows significant savings were achieved through reverse auctions for small, fixed-price construction services across various federal agencies.
Similar to Estudio de Subasta de Energia Firme de Peter Crampton y CREG (20)
El informe resume la generación y consumo energético del 14 de agosto de 2015. Reporta datos hidrológicos como aportes y reservas por región, así como generación por combustible. También incluye gráficos comparativos de variables energéticas, consumo de combustibles, y precios de bolsa frente a escasez. Finalmente, presenta el despacho programado y real para ese día.
Este documento describe los componentes clave del almacenamiento operativo de combustibles líquidos en Colombia, incluyendo la capacidad de la red de poliductos, el esquema de bacheo, y los factores a considerar para un almacenamiento óptimo como la frecuencia de bacheo, días de inventario de seguridad, y análisis de capacidad requerida. Además, discute los roles y responsabilidades respecto al almacenamiento en terminales y la necesidad de considerar la competitividad de tarifas en la cadena de suministro.
El Consejo Nacional de Operación aprobó la incorporación del Mínimo Obligatorio (Inflexibilidad) de la central hidroeléctrica El Quimbo. Esto se debe a que EMGESA debe mantener un caudal ecológico de 36 m3/s en el proyecto para cumplir con su licencia ambiental, lo que corresponde a una inflexibilidad de 48 MW. Tanto el Subcomité Hidrológico como el Subcomité de Plantas analizaron la solicitud y dieron su concepto favorable. El valor del Mínimo Obligatorio será el má
El documento presenta el programa de la 5a Jornada Técnica de Plantas que se llevará a cabo el 19 de agosto de 2015. La jornada incluye presentaciones sobre la incorporación de energías renovables en el Sistema Interconectado Nacional, soluciones de almacenamiento de energía, geotermia como fuente de energía limpia, estrategias de SmartGrids y energías renovables, gasificación de carbón, parques eólicos, potencial de generación de energía para cañicultores y experiencia operativa e integración de tecn
Este documento describe la adaptación del modelo ENERSINC-ECS a la metodología SDDP. Presenta conceptos teóricos de SDDP, estrategia de modelación, cronograma, módulos implementados, estructura de tablas y prueba de concepto. Resume la agenda de una presentación sobre la adaptación del modelo a SDDP.
Metodologa para remunerar la transmisin de energa elctricaEquipoRegulacion
1) El documento presenta una propuesta de la Comisión de Regulación de Energía y Gas para modificar la metodología de remuneración de la actividad de transmisión de energía eléctrica. 2) La propuesta busca incentivar inversiones en reposición de activos, mejorar la calidad del servicio, lograr gastos eficientes y permitir estabilidad en las inversiones de las empresas transmisoras. 3) La nueva metodología calcula los ingresos de las empresas transmisoras considerando la remuneración de inversiones, gastos de operación
Applications of artificial Intelligence in Mechanical Engineering.pdfAtif Razi
Historically, mechanical engineering has relied heavily on human expertise and empirical methods to solve complex problems. With the introduction of computer-aided design (CAD) and finite element analysis (FEA), the field took its first steps towards digitization. These tools allowed engineers to simulate and analyze mechanical systems with greater accuracy and efficiency. However, the sheer volume of data generated by modern engineering systems and the increasing complexity of these systems have necessitated more advanced analytical tools, paving the way for AI.
AI offers the capability to process vast amounts of data, identify patterns, and make predictions with a level of speed and accuracy unattainable by traditional methods. This has profound implications for mechanical engineering, enabling more efficient design processes, predictive maintenance strategies, and optimized manufacturing operations. AI-driven tools can learn from historical data, adapt to new information, and continuously improve their performance, making them invaluable in tackling the multifaceted challenges of modern mechanical engineering.
Mechatronics is a multidisciplinary field that refers to the skill sets needed in the contemporary, advanced automated manufacturing industry. At the intersection of mechanics, electronics, and computing, mechatronics specialists create simpler, smarter systems. Mechatronics is an essential foundation for the expected growth in automation and manufacturing.
Mechatronics deals with robotics, control systems, and electro-mechanical systems.
Discover the latest insights on Data Driven Maintenance with our comprehensive webinar presentation. Learn about traditional maintenance challenges, the right approach to utilizing data, and the benefits of adopting a Data Driven Maintenance strategy. Explore real-world examples, industry best practices, and innovative solutions like FMECA and the D3M model. This presentation, led by expert Jules Oudmans, is essential for asset owners looking to optimize their maintenance processes and leverage digital technologies for improved efficiency and performance. Download now to stay ahead in the evolving maintenance landscape.
Optimizing Gradle Builds - Gradle DPE Tour Berlin 2024Sinan KOZAK
Sinan from the Delivery Hero mobile infrastructure engineering team shares a deep dive into performance acceleration with Gradle build cache optimizations. Sinan shares their journey into solving complex build-cache problems that affect Gradle builds. By understanding the challenges and solutions found in our journey, we aim to demonstrate the possibilities for faster builds. The case study reveals how overlapping outputs and cache misconfigurations led to significant increases in build times, especially as the project scaled up with numerous modules using Paparazzi tests. The journey from diagnosing to defeating cache issues offers invaluable lessons on maintaining cache integrity without sacrificing functionality.
Digital Twins Computer Networking Paper Presentation.pptxaryanpankaj78
A Digital Twin in computer networking is a virtual representation of a physical network, used to simulate, analyze, and optimize network performance and reliability. It leverages real-time data to enhance network management, predict issues, and improve decision-making processes.
Build the Next Generation of Apps with the Einstein 1 Platform.
Rejoignez Philippe Ozil pour une session de workshops qui vous guidera à travers les détails de la plateforme Einstein 1, l'importance des données pour la création d'applications d'intelligence artificielle et les différents outils et technologies que Salesforce propose pour vous apporter tous les bénéfices de l'IA.
Supermarket Management System Project Report.pdfKamal Acharya
Supermarket management is a stand-alone J2EE using Eclipse Juno program.
This project contains all the necessary required information about maintaining
the supermarket billing system.
The core idea of this project to minimize the paper work and centralize the
data. Here all the communication is taken in secure manner. That is, in this
application the information will be stored in client itself. For further security the
data base is stored in the back-end oracle and so no intruders can access it.
Null Bangalore | Pentesters Approach to AWS IAMDivyanshu
#Abstract:
- Learn more about the real-world methods for auditing AWS IAM (Identity and Access Management) as a pentester. So let us proceed with a brief discussion of IAM as well as some typical misconfigurations and their potential exploits in order to reinforce the understanding of IAM security best practices.
- Gain actionable insights into AWS IAM policies and roles, using hands on approach.
#Prerequisites:
- Basic understanding of AWS services and architecture
- Familiarity with cloud security concepts
- Experience using the AWS Management Console or AWS CLI.
- For hands on lab create account on [killercoda.com](https://killercoda.com/cloudsecurity-scenario/)
# Scenario Covered:
- Basics of IAM in AWS
- Implementing IAM Policies with Least Privilege to Manage S3 Bucket
- Objective: Create an S3 bucket with least privilege IAM policy and validate access.
- Steps:
- Create S3 bucket.
- Attach least privilege policy to IAM user.
- Validate access.
- Exploiting IAM PassRole Misconfiguration
-Allows a user to pass a specific IAM role to an AWS service (ec2), typically used for service access delegation. Then exploit PassRole Misconfiguration granting unauthorized access to sensitive resources.
- Objective: Demonstrate how a PassRole misconfiguration can grant unauthorized access.
- Steps:
- Allow user to pass IAM role to EC2.
- Exploit misconfiguration for unauthorized access.
- Access sensitive resources.
- Exploiting IAM AssumeRole Misconfiguration with Overly Permissive Role
- An overly permissive IAM role configuration can lead to privilege escalation by creating a role with administrative privileges and allow a user to assume this role.
- Objective: Show how overly permissive IAM roles can lead to privilege escalation.
- Steps:
- Create role with administrative privileges.
- Allow user to assume the role.
- Perform administrative actions.
- Differentiation between PassRole vs AssumeRole
Try at [killercoda.com](https://killercoda.com/cloudsecurity-scenario/)
Estudio de Subasta de Energia Firme de Peter Crampton y CREG
1. 1
Colombia Firm Energy Auction: Descending Clock or Sealed-Bid?
Peter Cramton1
19 July 2015
Abstract
Colombia conducts periodic firm energy auctions to assure reliable electricity supply and
coordinate long-term investment in resources. To date, the auctions have followed a descending
clock auction format. Generators are asked in a series of rounds whether they are willing to
supply at progressively lower prices. The auction continues as long as supply exceeds demand.
All winning generators are paid the resulting clearing price—the reliability charge—for taking on
the firm energy obligation, which is structured as a reliability option. This paper compares this
descending clock auction with a closely related sealed-bid format. I conclude, after weighing the
pros and cons of each format, that the sealed-bid method is preferable in the Colombia setting.
Other issues such as lumpy resources and auction frequency are also discussed.
Introduction
To assure reliable electricity supply and coordinate long-term investment, Colombia periodically conducts
a firm energy auction. The auction assigns the firm energy obligation among generators three or more
years in advance of the commitment period. The firm energy obligation is a reliability option consisting of
two components: (1) the physical capability to supply energy during periods of scarcity, and (2) the
financial obligation to deliver energy consistent with the generator’s load share at the scarcity price
whenever the spot price exceeds the scarcity price. The total firm energy obligation is set by CREG to equal
the anticipated energy need. The firm energy auction establishes the reliability charge that is paid to
resources that take on the firm energy obligation by submitting winning bids.
CREG established the firm energy auction in 2006. The first two auctions were held in 2008 and 2012.
Consistent with the auction rules, the auctions to date have used the descending clock auction format,
which is a simple price discovery mechanism that asks generators in a series of rounds whether they are
willing to supply at progressively lower prices until the point where supply is less than demand. Then the
auctioneer identifies the set of winning generators to maximize the gains from trade as reflected by the
administrative demand curve and the as-bid supply curve. Each winner is paid the reliability charge—the
clearing price in the auction that best balances supply and demand—for the period of commitment.
In this paper, I examine whether the descending clock auction is the best auction format for the Colombian
market or whether a sealed-bid auction would be preferable. My analysis is informed by Colombia’s
1
Peter Cramton is Professor of Economics at the University of Maryland; since 1983, he has conducted widely-cited
research on market design; he has applied that research to design auction-based markets of radio spectrum,
electricity, financial securities, and other products. I am grateful to CREG for funding this research and to CREG
Commissioners and staff, especially Javier Diaz Velasco and Camilo Torres Trujillo, for helpful comments. The views
expressed are my own.
2. 2
experience to date with the descending clock auction (Harbord and Pagnozzi 2008, 2012), my expectations
about the Colombia setting going forward, and the experience in similar international markets.
I begin with a brief discussion of objectives. Then I review the key features of the market. Next I compare
the two auction formats: the descending clock auction and the sealed-bid auction. I then make my
recommendations. I conclude with a brief discussion of other issues that CREG should consider in its
efforts to improve the firm energy market and encourage efficient energy investment in Colombia.
Objectives and market principles
In any auction design application, it is best to start with the objectives of the market. The auction designer
evaluates alternative auction designs with respect to these objectives, choosing the rules of market
interaction to best meet the objectives given the details of the setting. The most common objectives in
government auctions are efficiency, transparency, simplicity, and fairness. I describe each.
Efficiency
Efficiency is the most basic objective for economists. An auction design is efficient if it yields outcomes
that maximize social welfare. In a trading environment, this means that all gains from trade are realized.
In the context of the firm energy auction, it means the auction identifies the least-cost resources that
satisfy the reliability requirement.
Simplicity
The auction should be as simple as possible, but not simpler. The setting of the auction is complex; hence,
it should not be surprising that some level of complexity is needed in an efficient design. Nonetheless, it
is important that the market be made as simple as possible to solve the economic problem of the setting.
Simpler designs tend to promote efficiency by letting the bidder express preferences more simply and
effectively.
Transparency
A first requirement of transparent auctions is clear and unambiguous rules that map bids into outcomes.
With a transparent design bidders know why they won or lost and understand why their payments are
what they are. Bidders are able—at least after the event—to confirm that the auction rules were followed.
Fairness
Equal opportunity is a basic requirement of fairness. All potential participants have access to the market
rules and the rules do not inappropriately discriminate among parties. In the context of auctions, this
means that identical bids are treated the same way.
In comparing alternatives, an auction design that scores well with respect to all of these objectives is
desired. We will see that both design alternatives, the descending clock and the sealed-bid auctions,
perform well with respect to these four objectives.
3. 3
Key features of the firm energy market
With these objectives in mind, in 2006, CREG adopted a firm energy market to:
• Induce just enough investment to maintain adequate resources;
• Induce an efficient mix of resources;
• Reduce market risk;
• Avoid market power in the firm energy market;
• Reduce market power in the energy market; and
• Pay no more than necessary.
Three key elements of the firm energy market are forward procurement, a long-term commitment to new
resources, and a sloped demand curve. I discuss each in turn. For more details of the Colombia firm energy
market see Cramton and Stoft (2007); for a broader discussion of reliability markets see Cramton and Stoft
(2008) and Cramton and Ockenfels (2012).
Forward procurement—conducting the auction several years in advance of the commitment period—
allows new projects to compete in advance of entry. This makes the market contestable and allows the
cost of new entry to be properly reflected in the clearing price. New projects are bid before major
investment costs are sunk. In this way, forward procurement improves competition in the market and the
pricing process. Forward procurement also coordinates entry. This results in less uncertainty in achieving
the clearing target. The tendency for a pronounced boom/bust cycle is reduced. Finally forward
procurement can offer a long-term commitment for new resources. This reduces investor risk and sends
a better price signal for new investment.
The Colombia market lets generators select a commitment period of up to 20 years at the time of
qualification. This long-term commitment lets new resources lock-in the firm energy price (capacity
charge), thereby reducing risk and encouraging investment. The price is indexed to adjust for inflation. In
contrast existing resources get a one-year commitment. Existing resources do not need a long-term
commitment, since their costs are already sunk. Indeed, the short commitment period reduces risk, since
it allows existing resources more draws from the price distribution. Importantly, both existing and new
resources receive the same prices in the long run. There is no discrimination against existing resources.
4. 4
Figure 1: Demand curve
The quantity procured is determine from the demand curve shown in Figure 1. The demand curve depends
on two administratively set parameters: (1) the target quantity—the amount of firm energy needed to
satisfy the reliability criterion, and (2) the cost of new entry (CONE), an engineering-economic estimate of
the cost of an efficient thermal resource. Importantly, the clearing price is determined from the bids of
the generators. CONE plays only a supporting role in price determination. Quantity on the other hand is
primarily determined by the administratively set target. This is as it should be as the target is the key
planning parameter. To address the unilateral exercise of market power, discussed in the next section, a
modest amount of uncertainty (±1.5 percent) is added to the target by the auctioneer at the time of the
descending clock auction. Thus, bidders know the planned target, but not the actual target with the added
uncertainty. The demand curve is defined by a price ceiling of two times CONE for all quantities less than
96 percent of the target and a price floor of ½ CONE at quantities greater than 104 percent of the target.
The price ceiling provides protection to rate payers in the event of insufficient supply. The price floor
prevents the price from falling excessively in response to surplus. Between the floor and the ceiling, the
price is set by the offer of the marginal generator. The sloped demand curve reflects the marginal benefit
of supply around the target quantity. To mitigate market power of existing generators, existing supply can
only exit during the clock stage at prices below 80 percent of CONE.
Comparison between descending clock and sealed-bid formats
I now compare the two auction formats. Both are based on the same uniform-price auction methodology
in which all winners are paid the clearing price at which supply and demand balance. The difference is in
how the bids are collected.
5. 5
Figure 2: Auctioneer’s perspective of descending clock auction
First consider the descending clock format, shown in Figure 2. In this case, generators are asked in a
sequence of rounds which resources are willing to supply at prices between a start of round price and an
end of round price. The initial start of round price is the price ceiling. At lower prices, a generator may
decide to reduce supply and indicate the resource and price at which the supply reduction occurs—this is
an exit bid. After each round, the auctioneer forms the aggregate supply curve from the start of round
price to the lower end of round price. Exit bids are indicated by the horizontal steps in the supply curve.
Initially, at high prices, supply is apt to exceed demand, as indicated in the red portion of the supply curve.
As the price is reduced with each round, supply can fall. The auction ends when in the last round, the
auctioneer asks for the final interval of prices, down to the price floor. The clearing price is determined as
the highest bid accepted, PC, in the figure. Due to the lumpiness of supply, the quantity, QC, does not
perfectly balance supply and demand, but nearly so. More specifically, the set of winners is chosen to
maximize gains from trade, as described in the final section of this paper. The figure is drawn from the
auctioneer’s perspective in that only the auctioneer observes the actual demand curve and the full supply
curve.
One feature of the auction is that supply can only decrease or stay the same as price falls. A resource that
is “in” at a lower price must be willing to supply at a higher price. This natural requirement is enforced by
the auction rules as it limits gaming behavior and improves price discovery. It also guarantees that the
supply curve is weakly increasing as drawn in the figure.
6. 6
Figure 3: Bidder’s perspective of descending clock auction
Figure 3 shows the same descending clock auction from a bidder’s perspective. After each round, the
auctioneer reports the aggregate supply at the end of round price. These are the sequence of blue dots
starting with the highest at P1 at the end of the first round, then at P2, then at P3, and finally at P4. In the
fifth and final round of this example, the auctioneer asks for any exit bids between P4 and P5—the floor
price. At this point the full supply curve has been collected and the auctioneer reports the winning bids
and the clearing price. The uncertainty in demand is illustrated with the multiple lines in the sloped portion
of the supply curve. Actual demand can fall anywhere within this range. This uncertainty is introduced to
mitigate somewhat the exercise of market power, as described below.
Figure 4: Auctioneer’s perspective of sealed-bid auction
Figure 4 shows the same example, but conducted with the sealed-bid format. Rather than conduct a series
of rounds, the auction is conducted in a single round. The auctioneer simply asks each generator to name
exit bids for each resource for prices between the price ceiling and the price floor. As before, a resource
that is “in” for a lower price must be “in” for all higher prices. Notice that Figure 2 (descending clock) and
Figure 4 (sealed-bid) appear identical when drawn from the auctioneer’s perspective. Indeed, they are apt
to be nearly identical in practice. However, differences can arise because of the extra information—the
7. 7
supply at the end of round price—that is revealed by the auctioneer in the descending clock auction.
Indeed, the two formats only differ to the extent generators change exit bids in response to the end-of-
round supply information revealed after each clock round.
Figure 5: Unilateral exercise of market power in descending clock auction
Figure 5 shows one reason why the as-bid supply curves may differ between the two formats. The figure
depicts the following possibility. A generator, learning the end of round demand, recognizes that supply
is close to demand and the exit of the generator’s unit likely causes supply to fall below demand and set
the clearing price. As a result, the generator may decide it is better-off raising its exit bid to P’C rather than
PC. The unit is apt to be accepted at either price and the generator would prefer the higher price. This is a
classic example of the unilateral exercise of market power. The generator has adjusted its bid recognizing
its likely impact on price. The difference between the descending clock and the sealed-bid auctions is that
in the descending clock the bidders have some additional information on which to determine their bids.
In this case that information was used in a potentially harmful way to increase prices above competitive
levels and possibly distort the auction outcome. This behavior is not just a theoretical possibility. It
appears to have occurred in the first auction in Colombia (Harbord and Pagnozzi 2008, p. 11).
The extra information, however, may have positive effects (see Cramton 1998 and Ausubel and Cramton
2004). The beneficial source is from a reduction in uncertainty, which allows for improved decision
making. Information about supply can reduce common value uncertainty. For example, stronger bidding
may reveal a general optimism about future electricity prices and thereby lower the investor’s exit bid;
whereas, weaker bidding may reveal market pessimism and raise the investor’s exit bid. In both cases,
uncertainty about the future is reduced because the supply information conveys some valuable market
information. The reduction of uncertainty reduces the winner’s curse—a form of adverse selection.
Bidders can bid with greater confidence with less uncertainty about common value.
The second reason that more supply information may improve decision making is the improved outcome
discovery. The supply information helps the bidder form price expectations and the likelihood of winning.
For a generator with many units, the generator can then make more informed decisions in setting exit
8. 8
prices for the various units. This is especially the case when the units are complementary or the bidder
faces aggregate constraints such as budget or portfolio constraints.
Both of these factors are good reasons for the adjustment of exit bids. And these adjustments are
consistent with economic efficiency. However, neither of these reasons seem important in the Colombia
setting. First, unlike oil lease auctions where common value uncertainty is of first order importance, the
firm energy auction is one characterized by private values—projects have particular attributes that
warrant different exit bids. Second, there is only one product being procured and a single merit order.
Hence, even generators with multiple resources can manage risk and budget and portfolio constraints
nearly as well with the sealed-bid format.
There are three other factors to consider in comparing the clock and sealed-bid formats: privacy,
transparency, and simplicity.
Privacy. At least in theory clock auctions respect the privacy of infra-marginal bids—exit bids that are
better (lower) than the clearing price. Only the high (rejected) portions of the supply curve are revealed.
The auction ends when supply equals demand. Winning bidders reveal only, “I am willing to supply at the
clearing price.” In practice, however, due to the lumpiness of resources and to mitigate market power, in
the last round of bidding the auctioneer asks for all exit bids between the start of round price and the
price floor. Hence, there is no privacy difference between the descending clock and sealed-bid formats in
Colombia. The full range of exit bids is revealed to the auctioneer in both cases.
Transparency. Higher levels of transparency are achieved in auction designs with excellent outcome
discovery—both with respect to prices and prospects for winning. Outcome discovery is encouraged with
dynamic auctions, such as clock auctions, in which substantial information is provided to bidders to
understand prices and winning prospects during the auction. Still the auction designer must recognize
that the release of some information could potentially be used to foster collusion or improper
coordination among bidders. For this reason it is common to release anonymous information that is
relevant to understanding demand in a forward auction or supply in a reverse auction. Transparent
auctions have an information policy that reveals information that is most helpful in understanding
demand and supply. Such designs promote outcome discovery, which generally promotes auction
participation and competition.
However, in the case of Colombia’s firm energy auction there is little difference in transparency between
a clock and sealed-bid format. Regarding supply, only slightly more information is revealed: the end of
round supply at the end of each round. Regarding demand, the clock auction is less transparent, since
demand uncertainty is introduced in the demand curve to mitigate the exercise of market power. With
the sealed-bid format, it is unnecessary to introduce this additional uncertainty. The true demand curve
can be revealed. This has an efficiency gain, since then the market is cleared against the true demand,
rather than a curve that has been distorted to increase uncertainty and mitigate market power.
Simplicity. Simplicity is best measured in terms of the simplicity of participating in the auction. Clear rules
that make it straightforward to develop an effective bidding strategy get high marks for simplicity. Simpler
auction designs tend to avoid guesswork. For example, the descending clock format facilitates outcome
9. 9
discovery, both with respect to clearing prices and the prospects for winning. This is simpler for bidders,
especially when auctioning multiple interrelated products. These designs help bidders avoid substantial
guesswork and speculation in bidding strategy.
Simpler designs also limit risks to bidders. Again dynamic designs with good outcome discovery often let
the bidder better manage budget and portfolio constraints. Executing a particular business plan is often
more straightforward in such designs.
However, in the Colombia setting with just a single product, the outcome discovery is not especially useful.
In terms of simplicity the two designs are quite close. In two respects the sealed-bid design is simpler:
bidders can prepare bids on their own schedule and without the introduction of demand uncertainty.
Recommendations
Both the descending clock and its sealed-bid variant score well with respect to the four objectives:
efficiency, simplicity, transparency, and fairness. First, both auctions are simple methods for determining
winners and prices. The clock variation has the further advantage of improved price discovery, but this
advantage is somewhat offset by features added to mitigate market power: discrete rounds with large
decrements near the end of the auction and the introduction of demand uncertainty. Bidding strategy in
both cases amounts to figuring out the lowest acceptable reliability charge for a resource and then exiting
when that reservation price is reached. Second, both variations are highly transparent. The rules are clear
and it is easy to see why a bidder won or lost at a particular price. The revelation of end of round aggregate
supply promotes price discovery in the clock version, although this is offset by the introduction of demand
uncertainty. Third, the auction is fair. Every potential bidder faces the same rules and all trade takes place
at the market-determined clearing price. And finally, the auction is highly efficient. Given the
straightforward and effective bidding strategy of exiting when reservation values are reached, the auction
is fully efficient, maximizing total surplus.
10. 10
Table 1: Summary of pros and cons of auction formats
Table 1 provides a summary of the advantages of the two auction formats. The decisive element is the
descending clock’s greater vulnerability to exercise of market power toward the end of the auction.2
As a
result of this vulnerability, the descending clock uses a large decrement near the end and adds demand
uncertainty. These efforts to limit market power offset the advantage that the descending clock would
otherwise enjoy. The descending clock does hold an advantage in revealing more common value
uncertainty and outcome discovery, but in this setting with a single product the advantage is slight. On
the issues of privacy and transparency it is a draw. For practical reasons, because of lumpiness and market
power, all exit bids are revealed to the auctioneer. And the transparency advantage of the clock auction
is wiped away with the introduction of demand uncertainty to address market power. Finally, with respect
to simplicity, the sealed-bid auction has the edge. It is easy to implement, easy for the bidders, at least in
this single product case, and it avoids the need to have demand uncertainty.
My overall recommendation is that Colombia should switch to the sealed-bid auction format. Further,
CREG should eliminate the demand uncertainty that was introduced to mitigate the exercise of market
power with the descending clock format. Demand uncertainty is no longer needed or desirable.
International experience
Both descending clock and sealed-bid auctions are used in today’s reliability markets. Colombia, New
England, and the United Kingdom currently use a descending clock. Brazil uses a hybrid with descending
clock followed by sealed bids. PJM is a good example of a major market that has used the sealed-bid
format for many years. As in Colombia, both New England and Ireland are currently considering whether
it makes sense to adopt a sealed-bid format.
Other issues
In the course of my review, I identified three other issues worth discussing: lumpy supply, auction
frequency, and performance incentives.
2
It should be noted that the sealed-bid approach does not eliminate market power problems, see Ausubel et al.
2014. However, it does mitigate somewhat the unilateral exercise of market power near the end of the auction.
11. 11
Addressing lumpy supply
The sealed-bid format works well with lumpy supply. As a result of lumpy supply it is desirable to collect
all the exit bids between the floor and the ceiling so that the entire aggregate supply curve is in hand.
Then the auctioneer can identify the winning units as the set of resources that maximizes net value—the
gains from trade, which is the area between the demand curve and the as-bid supply curve. The clearing
price typically is set at the price where supply and demand cross, although a common variation is to set
the price at the bid of the highest exit bid accepted.
Figure 6: Three examples illustrating clearing rule to maximize net value
Figure 6 gives three examples of how the clearing rule works to maximize net value. In example 1, the first
two resources are accepted (in green) and the third (in red) is rejected. The price is PC with the standard
rule that sets the price where supply and demand cross; however, in the variation setting the price at the
highest accepted bid, the price is P’C. In example 2, the first two resources are accepted and the price is
PC. Example 3 shows an interesting case where a large lumpy resource is rejected and a smaller resource—
bid at a higher price—is accepted. The smaller resource better matches the residual demand and only
increases the price slightly to PC.
12. 12
Figure 7: To maximize net value, resource A is rejected; then resource B is rejected
Formally, the maximization of net value is a combinatorial optimization problem (see Cramton, et al.
2006). Figure 7 illustrates the tradeoffs in a simple example. The left panel considers whether the resource
A should be accepted. Accepting A causes supply to exceed demand. There is an incremental gain shown
by the green triangle for the portion of A where demand exceeds supply and an incremental loss shown
by the red polygon where supply exceeds demand. Since the green triangle has less area than the red
polygon, net value is improved by rejecting A. The right panel then considers resource B, which is priced
higher than A, but may improve net value. However, since the incremental benefit (the green triangle) is
smaller than the incremental cost (the red triangle), resource B is rejected too.
Auction frequency
In the Colombian firm energy market, auctions are conducted when it is projected that there is a future
need. As a result of lumpy supply, such as large hydro projects, and slower economic growth as a result
of the global financial crisis, this has led to only two auctions, an initial auction in 2008 and a second
auction in 2012. I believe there is a downside to such infrequent auctions. First it causes ratepayers to pay
too high a reliability charge in periods of surplus, such as in the years immediately after the financial crisis.
Second, it prevents entry during these periods without an auction.
The reliability markets in other parts of the world, such as the US and the UK, have annual auctions.
Auctions are held regardless of whether new entry is required to meet demand. These annual auctions
provide a steady opportunity for entry and exit. With the annual auctions, a price is set each year based
on the market fundaments. The price is higher when new entry is required; the price is lower during
periods of surplus and retirements may be desirable. With an annual auction, new and existing generators
compete in all years. This better sustains an ecosystem for new investment in the Colombian market.
I recommend that Colombia consider shifting to an annual market.
Performance incentives
A recent development in reliability markets around the world is the recognition that strong performance
incentives are a requirement of a successful market. Reliability markets other than Colombia’s market
13. 13
began with performance incentives there were two weak. The rules had performance requirements to
deliver energy during scarcity periods, but typically there were long lists of excuses for not delivering that
would exempt a resource from any penalty. This led to poor performance and near crisis situations in New
England and PJM, especially during winter cold snaps when there would be insufficient gas to fuel the gas
generators.
Many markets have now adopted strong performance incentives, which like Colombia’s reliability option,
eliminates excuses. In the following markets there is a requirement to deliver during times the system is
short of operating reserves and there is a high shortage price to settle deviations from obligations:
• New England’s pay-for-performance rule with a shortage price of about $5400/MWh.
• PJM’s capacity performance rule with a shortage price of about $2700/MWh.
• Texas’ scarcity pricing rule with a shortage price of about $9000/MWh.
In each of these markets, the high spot price during reserve shortages has proved essential to motivate
operational reliability in these thermal systems. These systems are characterized by short and more
frequent shortage events—on the order of 20 per year. In Colombia’s hydro dominated system, the
shortage events are better characterized as long and rare—on the order of one major event every 10
years. For this reason, the reliability option approach is best in Colombia, where obligations to deliver
energy are triggered by a high scarcity price that is comparable to that of a peaker with a high marginal
cost.
In all markets, it is important that load is properly hedged. This is accomplished in the reliability markets
with a load-following obligation that covers 100% of load. The Colombia market has been an early example
of this successful design.
Conclusion
This paper considered whether Colombia’s firm energy auction should follow a descending clock or sealed-
bid format. The two auction variations are in fact remarkably similar. Indeed the sealed-bid format is
equivalent to a descending clock auction in which in the initial round the bidders are asked to name all
exit bids from the price ceiling to the price floor. The difference between the two formats rests on how
bidders make use of the extra information revealed at the end of each round—the end of round supply.
In many applications, this extra information is beneficial in improving bidder decision making to increase
the efficiency of the auction outcome. However, in the Colombia setting, the beneficial use of the extra
information about supply is not great. Furthermore, the risk of negative use of the extra information to
exercise market power is relatively high in this setting given the lumpiness of resources relative to the size
of the market. For these reasons, I recommend that Colombia in future auctions switch to the sealed-bid
format.
One other change that I believe Colombia should consider is a switch to annual auctions. This will provide
a regular and predictable means of entry into and exit from the market. It also will mean that he reliability
charge will better track market fundamentals. And it is more apt to support a healthy ecosystem for
investing in generation assets.
14. 14
References
Ausubel, Lawrence M. and Peter Cramton (2004), “Auctioning Many Divisible Goods,” Journal of the European
Economic Association, 2, 480-493, April-May.
Ausubel, Lawrence M., Peter Cramton, Marek Pycia, Marzena Rostek, and Marek Weretka, “Demand Reduction and
Inefficiency in Multi-Unit Auctions,” Review of Economic Studies, 81:4, 1366-1400, 2014.
Cramton, Peter (1998), “Ascending Auctions,” European Economic Review, 42:3-5, 745-756, May.
Cramton, Peter and Axel Ockenfels (2012) “Economics and Design of Capacity Markets for the Power Sector,”
Zeitschrift für Energiewirtschaft, 36:113-134.
Cramton, Peter, Yoav Shoham, and Richard Steinberg (2006), Combinatorial Auctions, Cambridge, MA: MIT Press.
Cramton, Peter and Steven Stoft (2007), “Colombia Firm Energy Market,” Proceedings of the Hawaii International
Conference on System Sciences.
Cramton, Peter und Steven Stoft (2008). “Forward Reliability Markets: Less Risk, Less Market Power, More Efficiency”
Utilities Policy, 16, 194-201.
Harbord, David and Marco Pagnozzi (2008), “Review of Colombian Auctions for Firm Energy,” Report for CREG, 12
November 2008.
Harbord, David and Marco Pagnozzi (2012), “Second Review of Firm Energy Auctions in Colombia,” Report for CREG,
18 December 2012.