Download as PPSX, PPTX
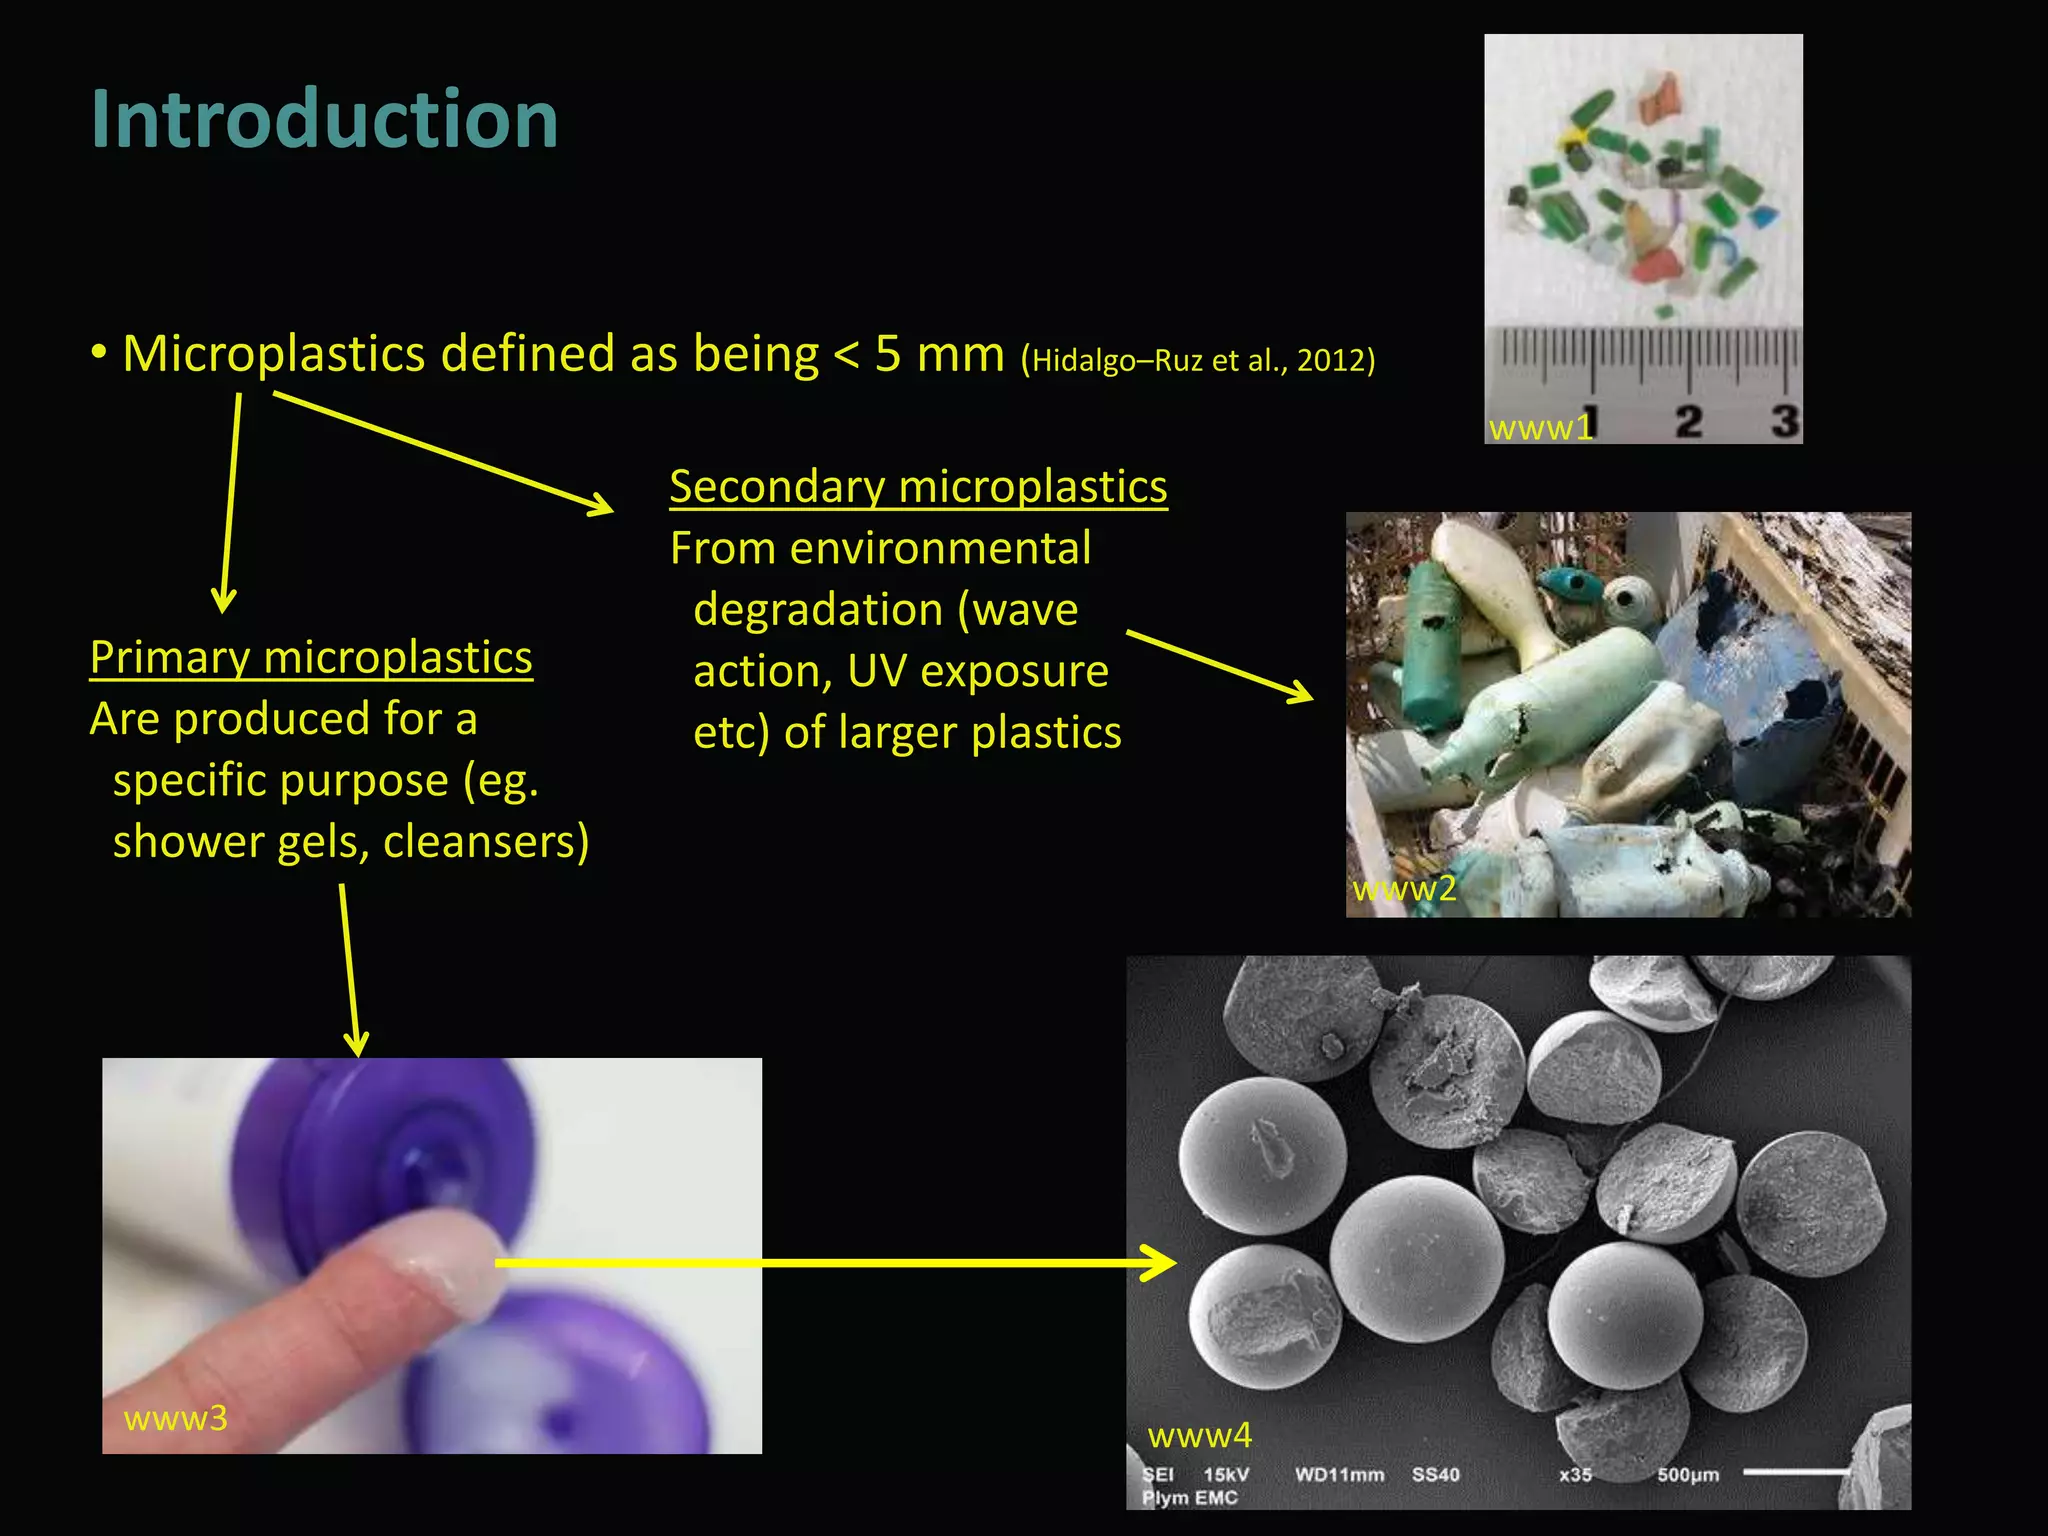
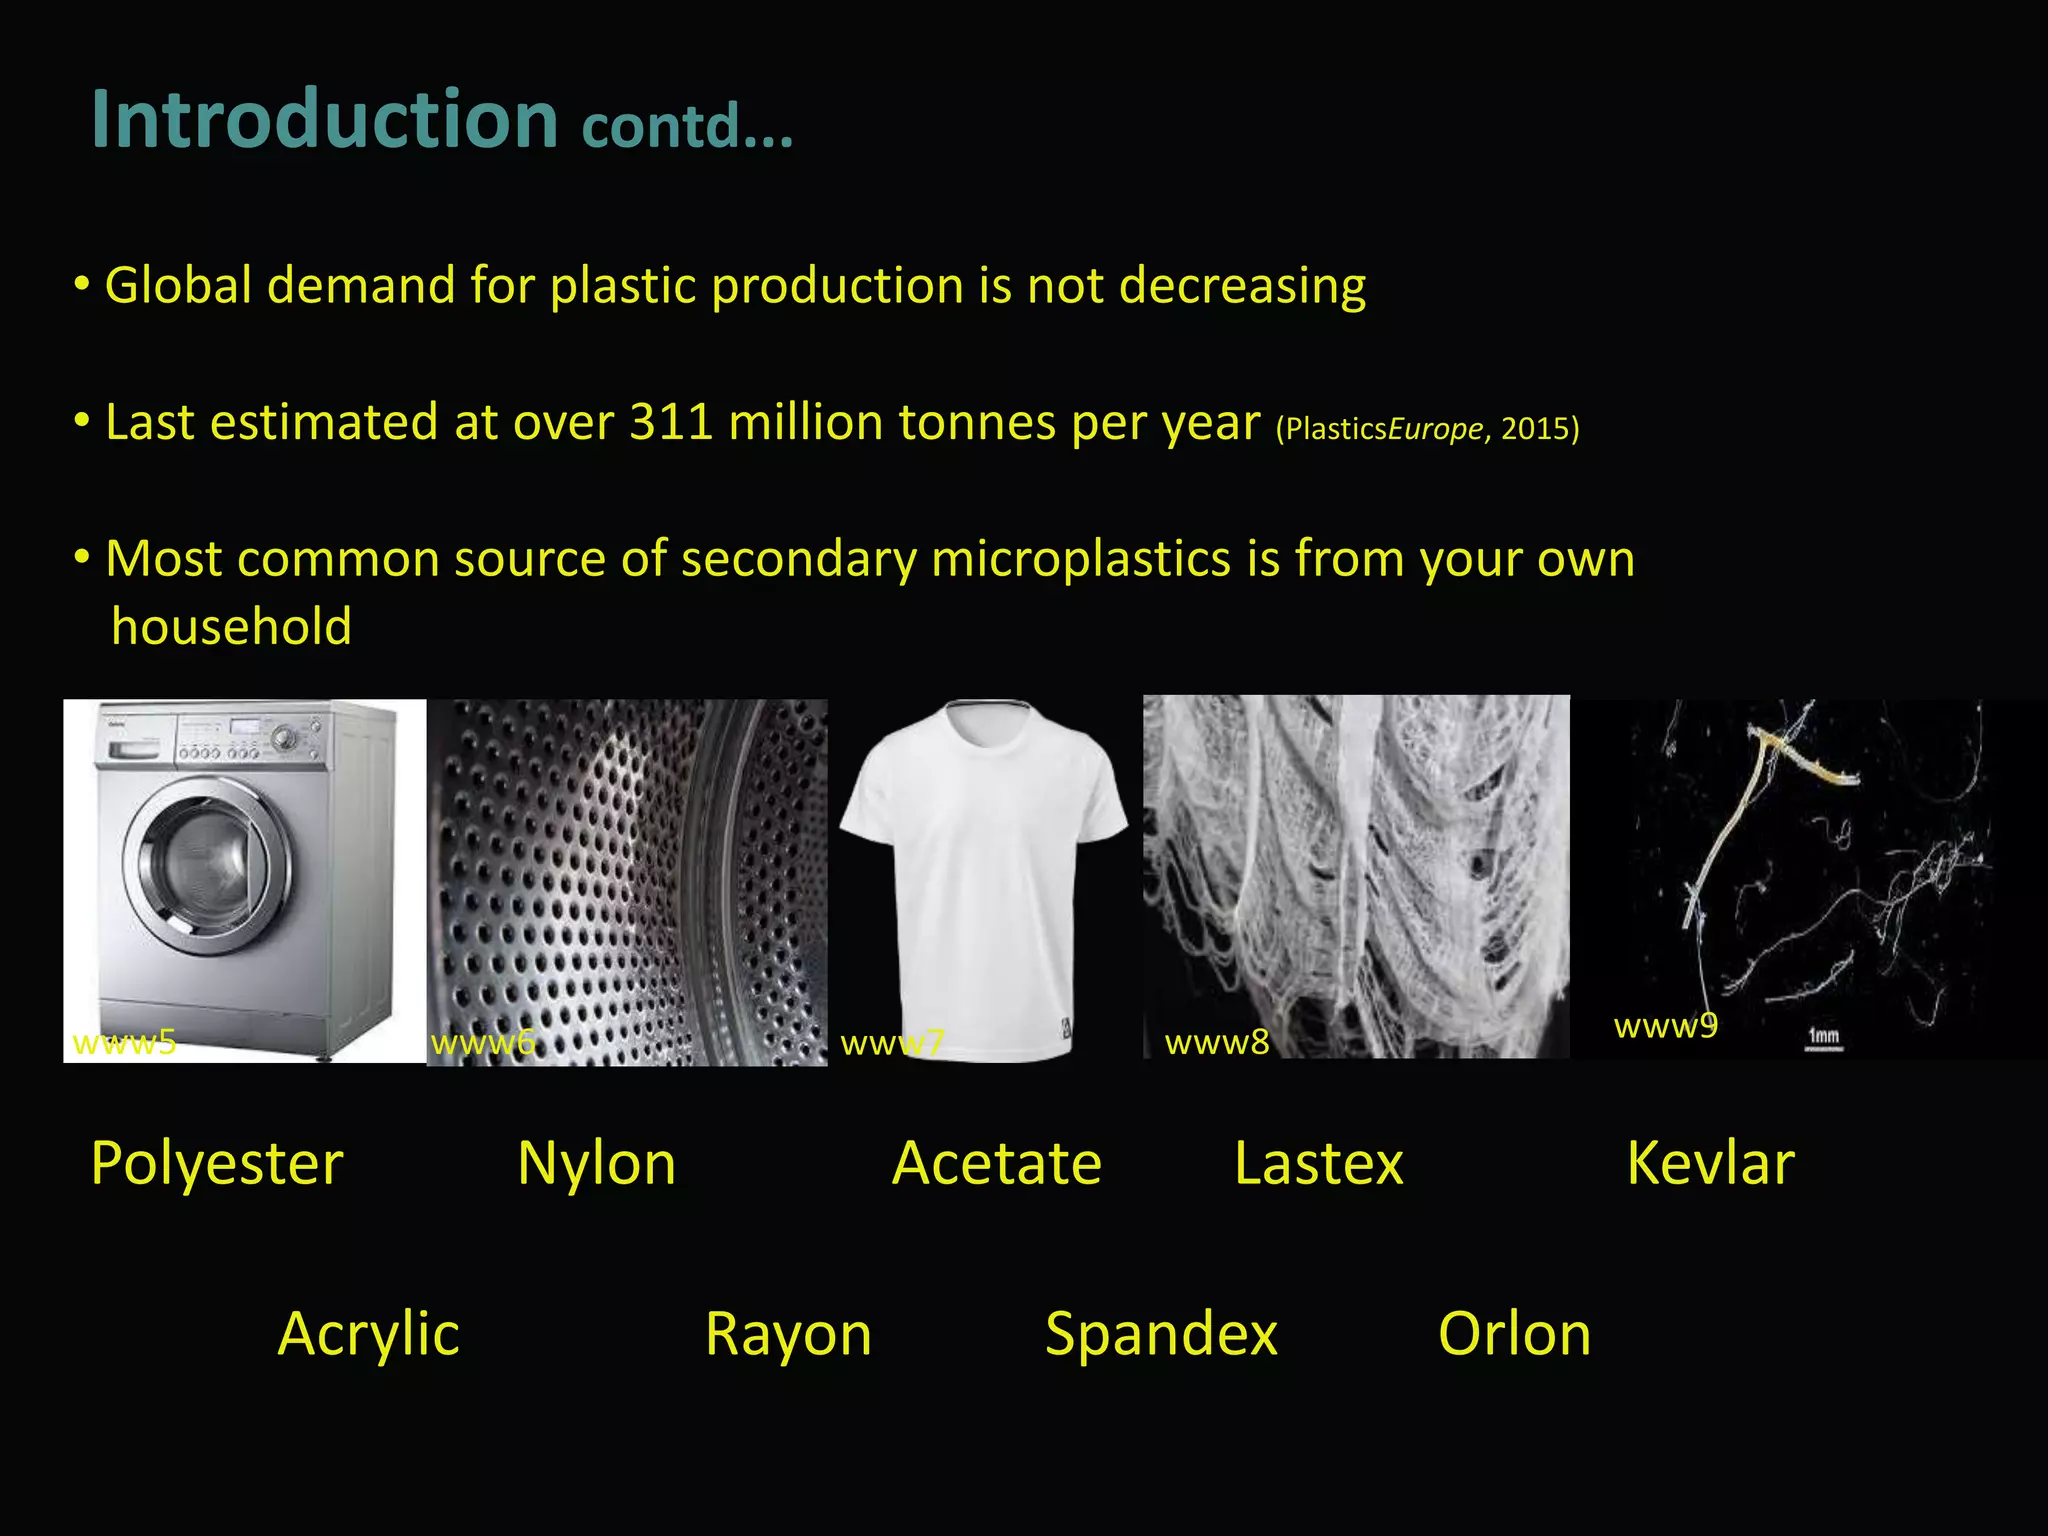
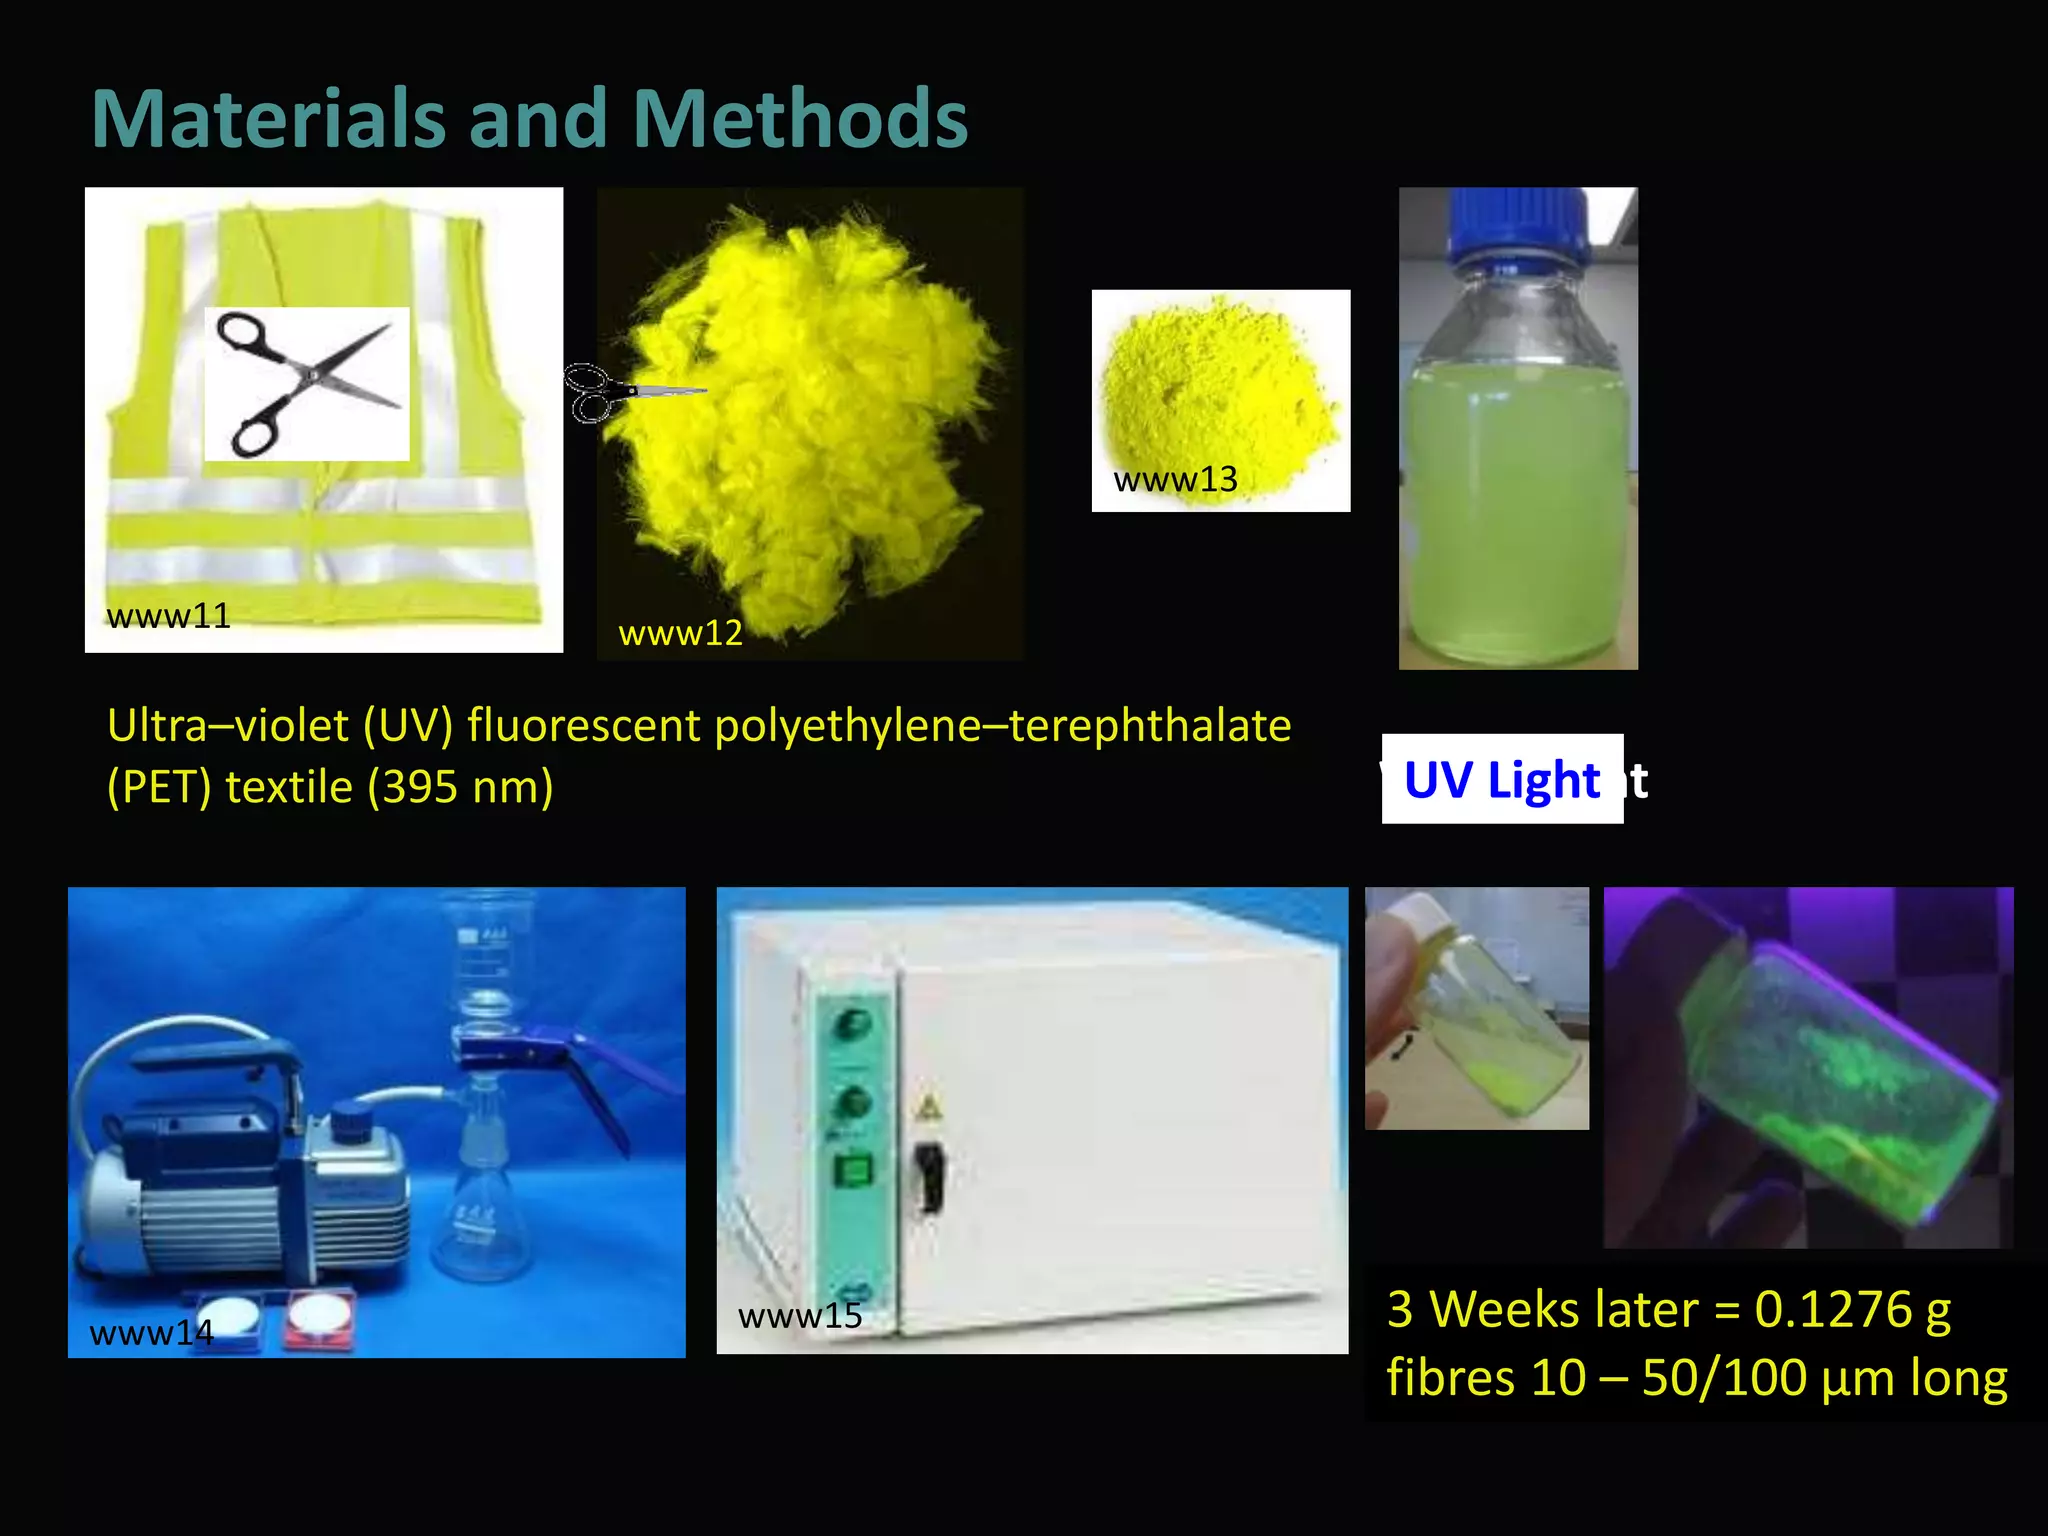
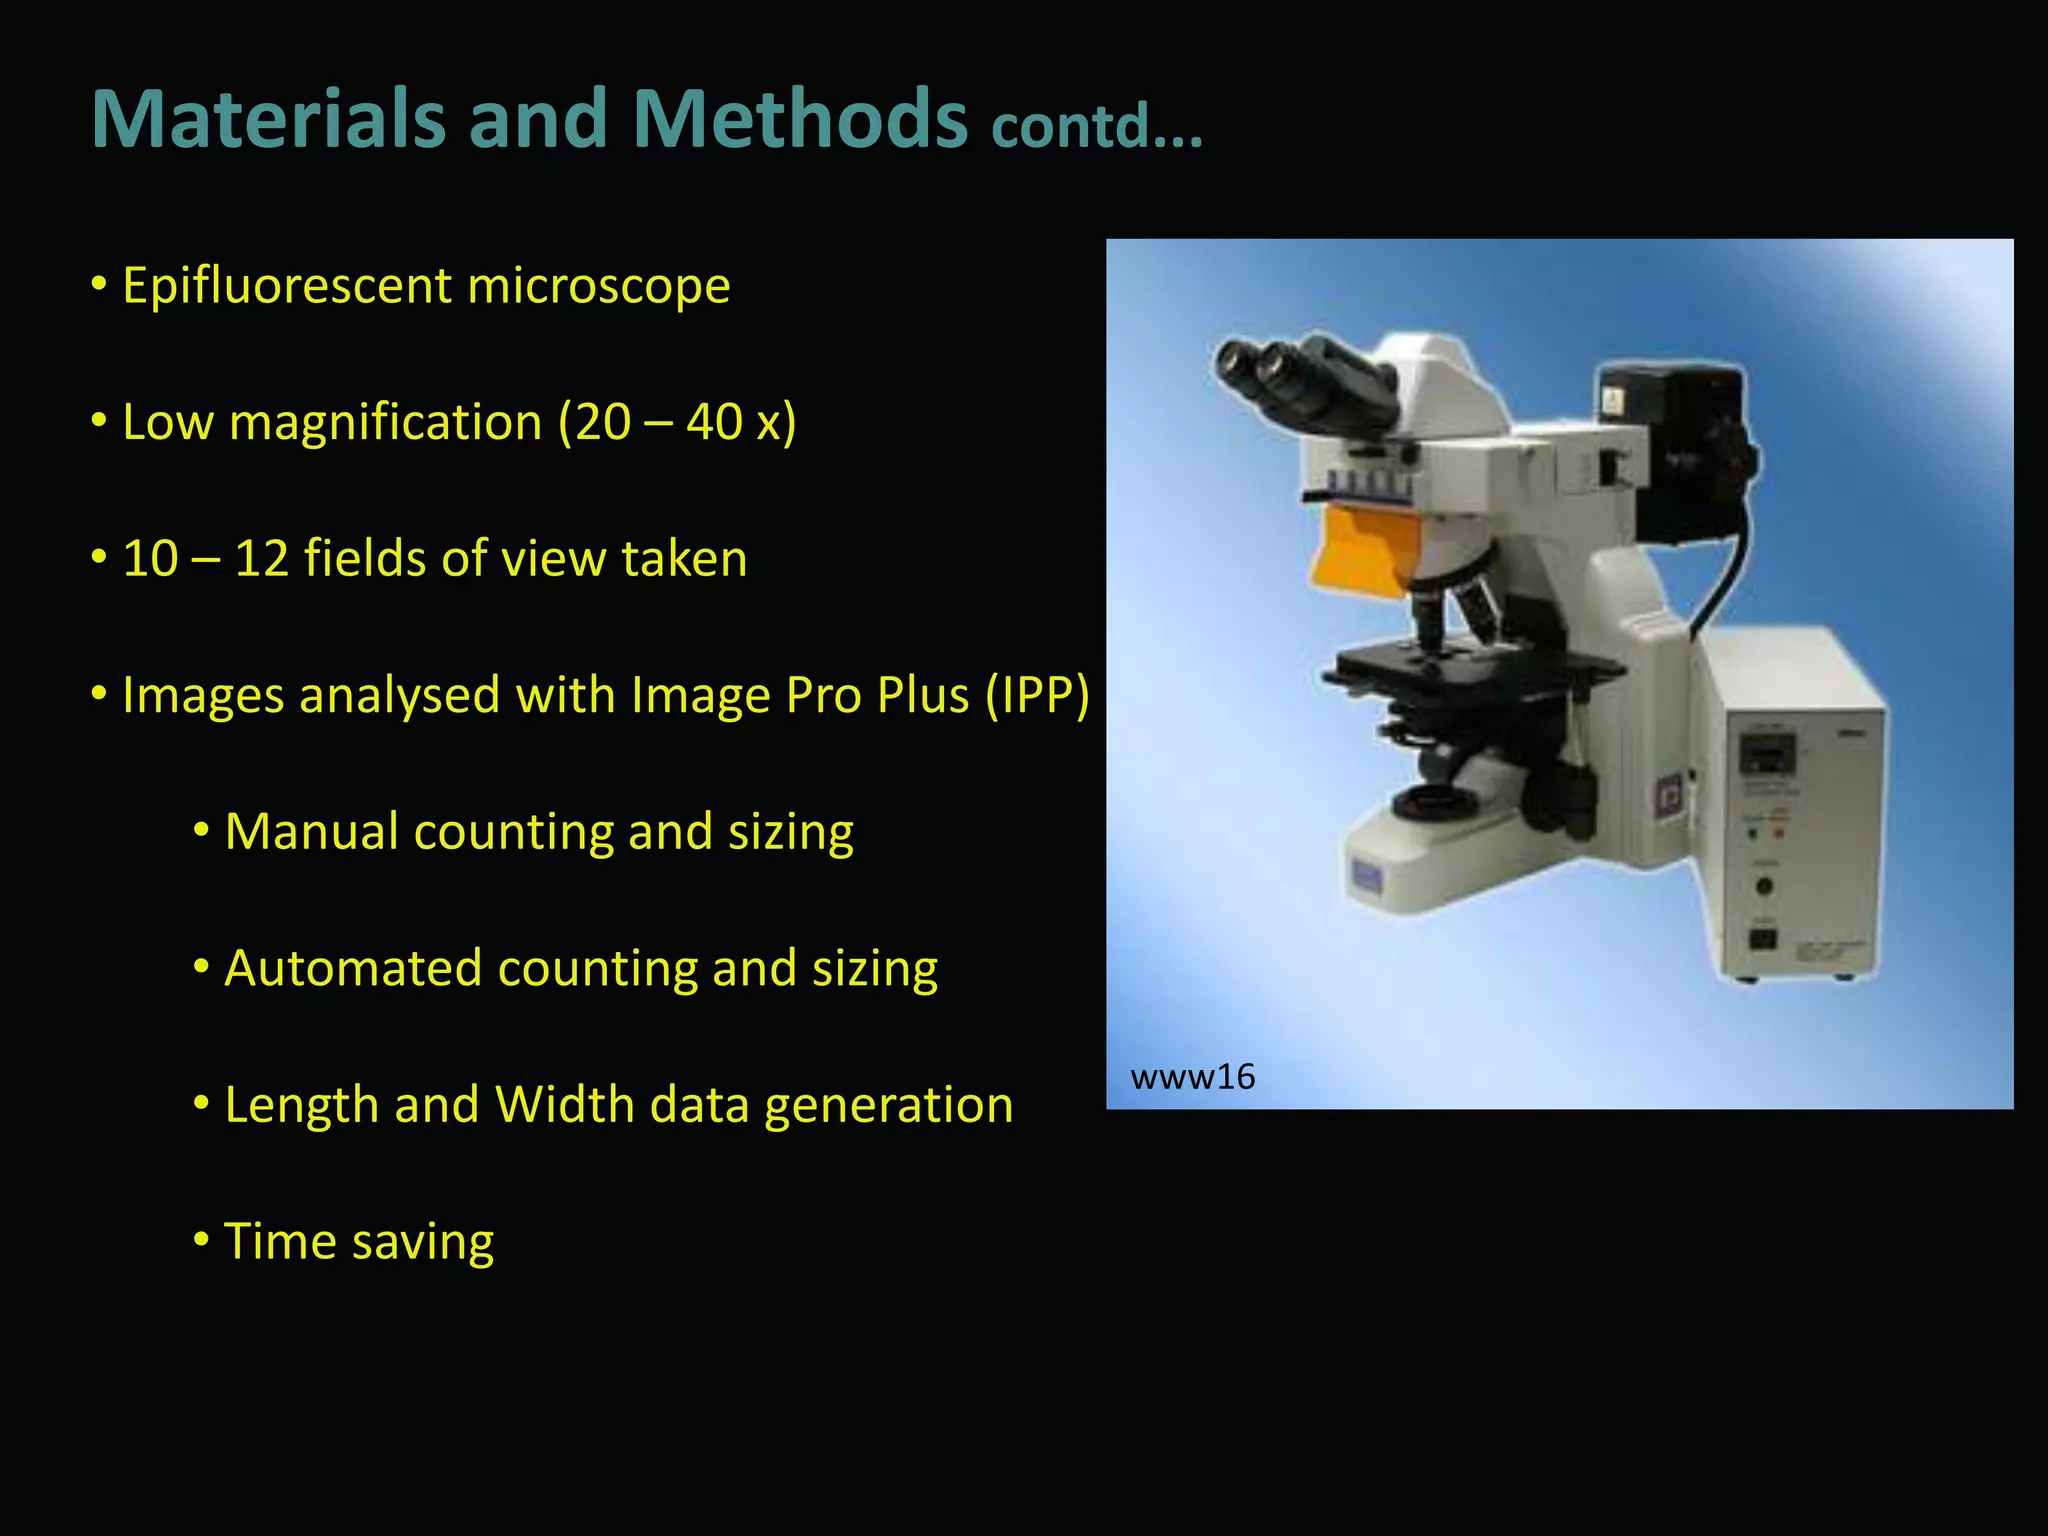
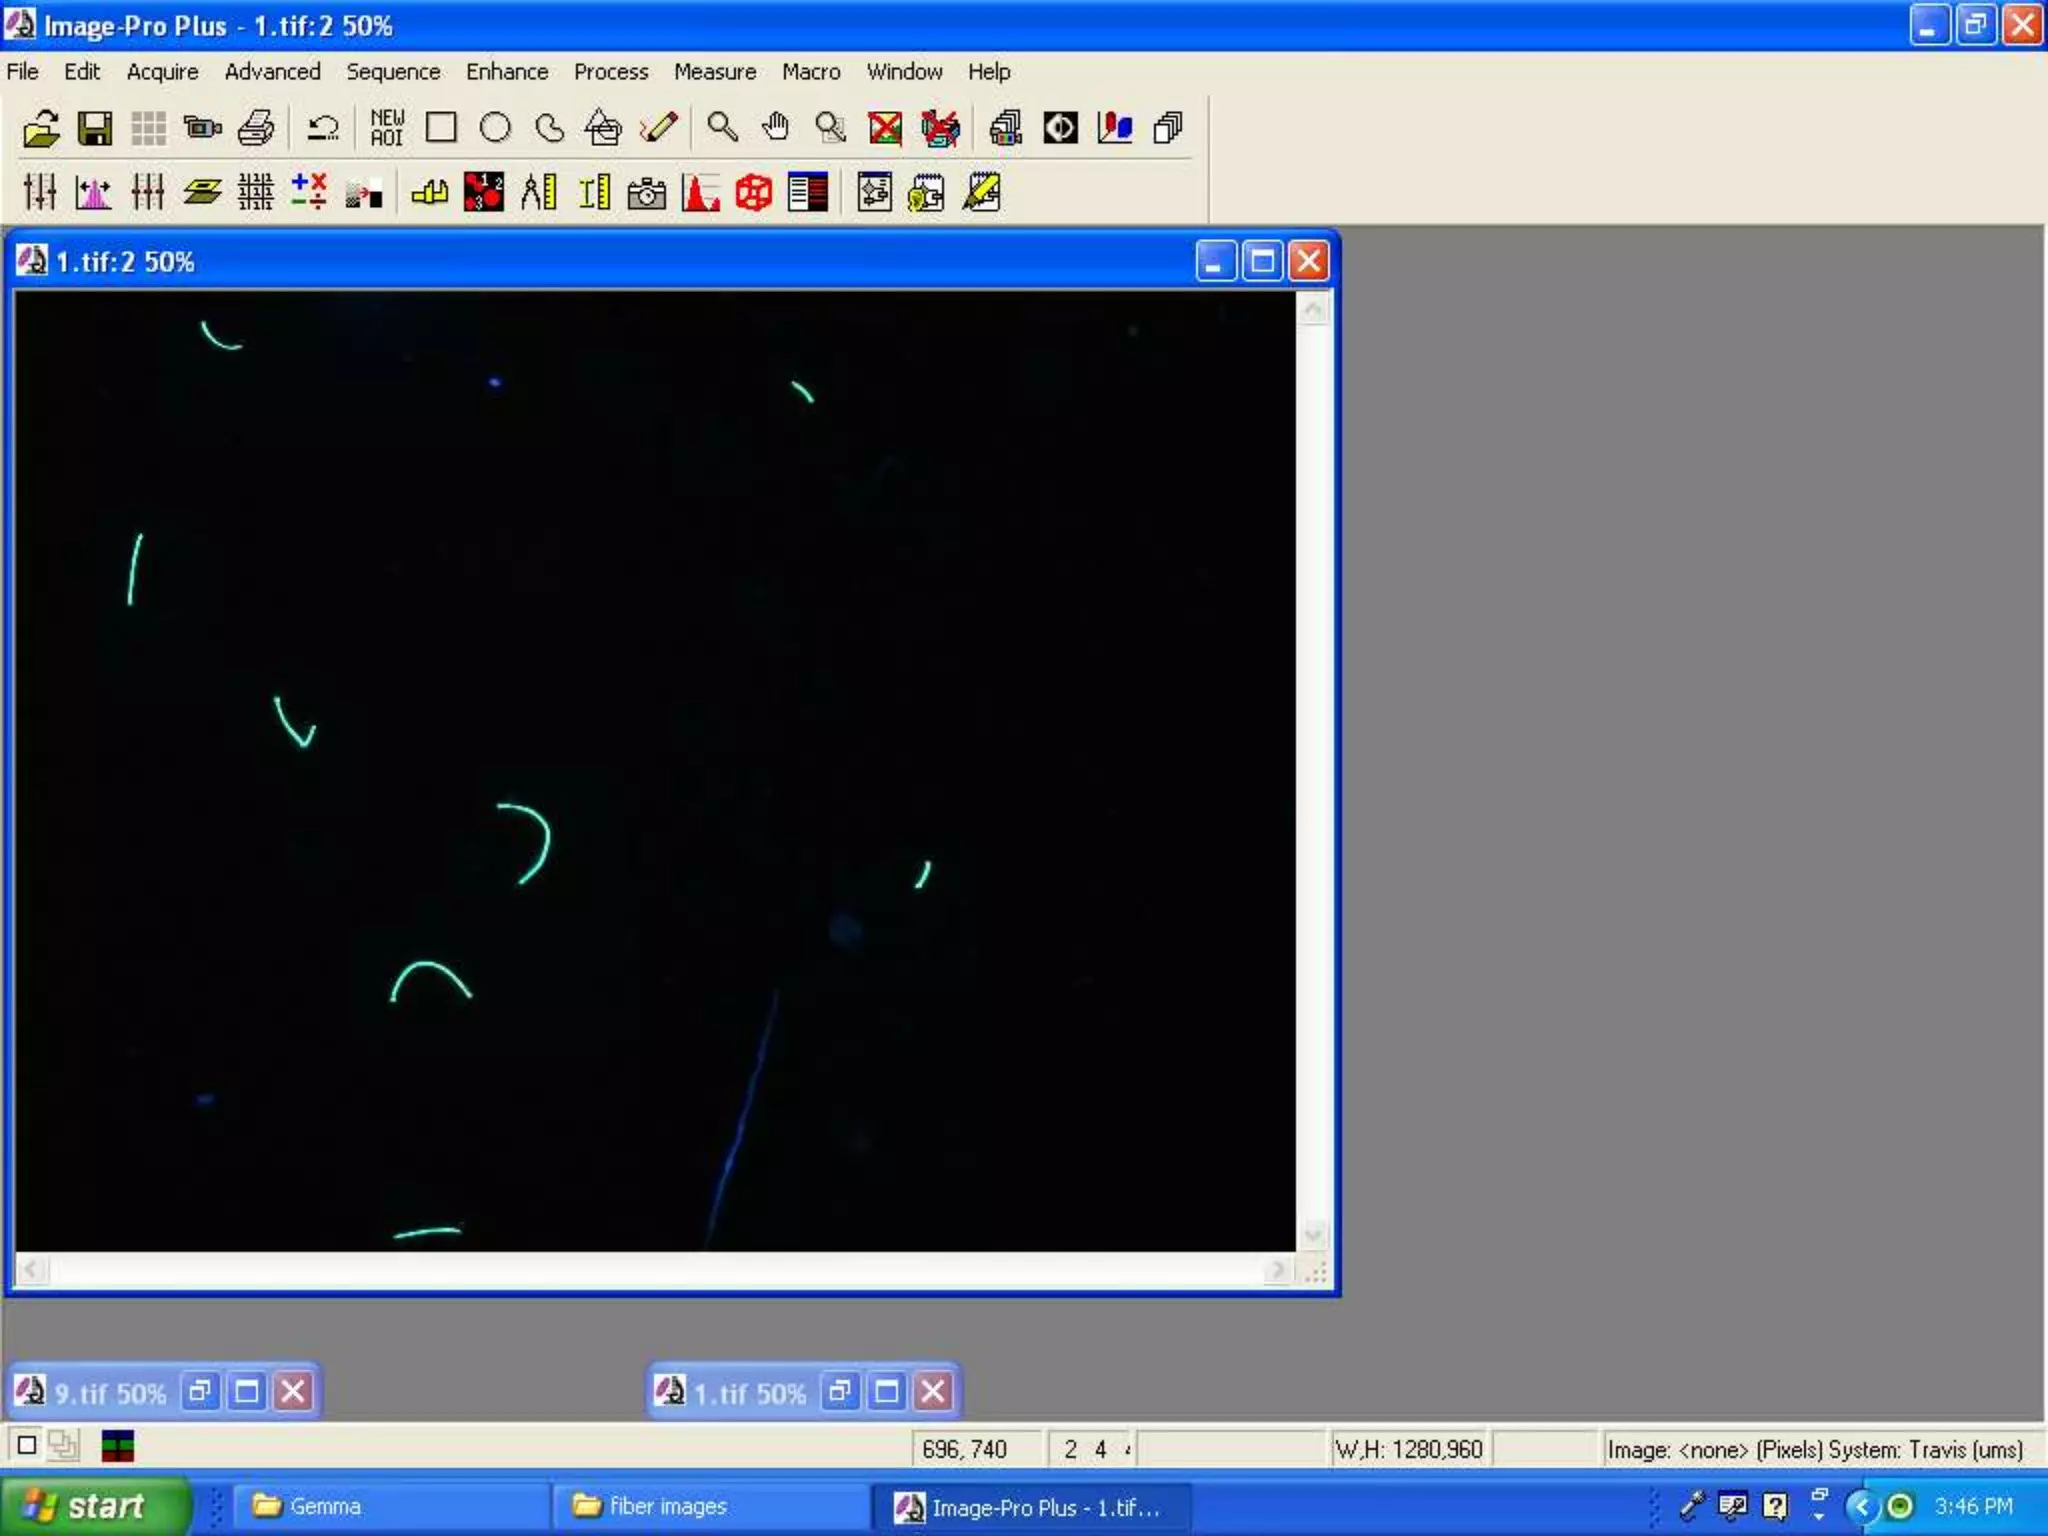
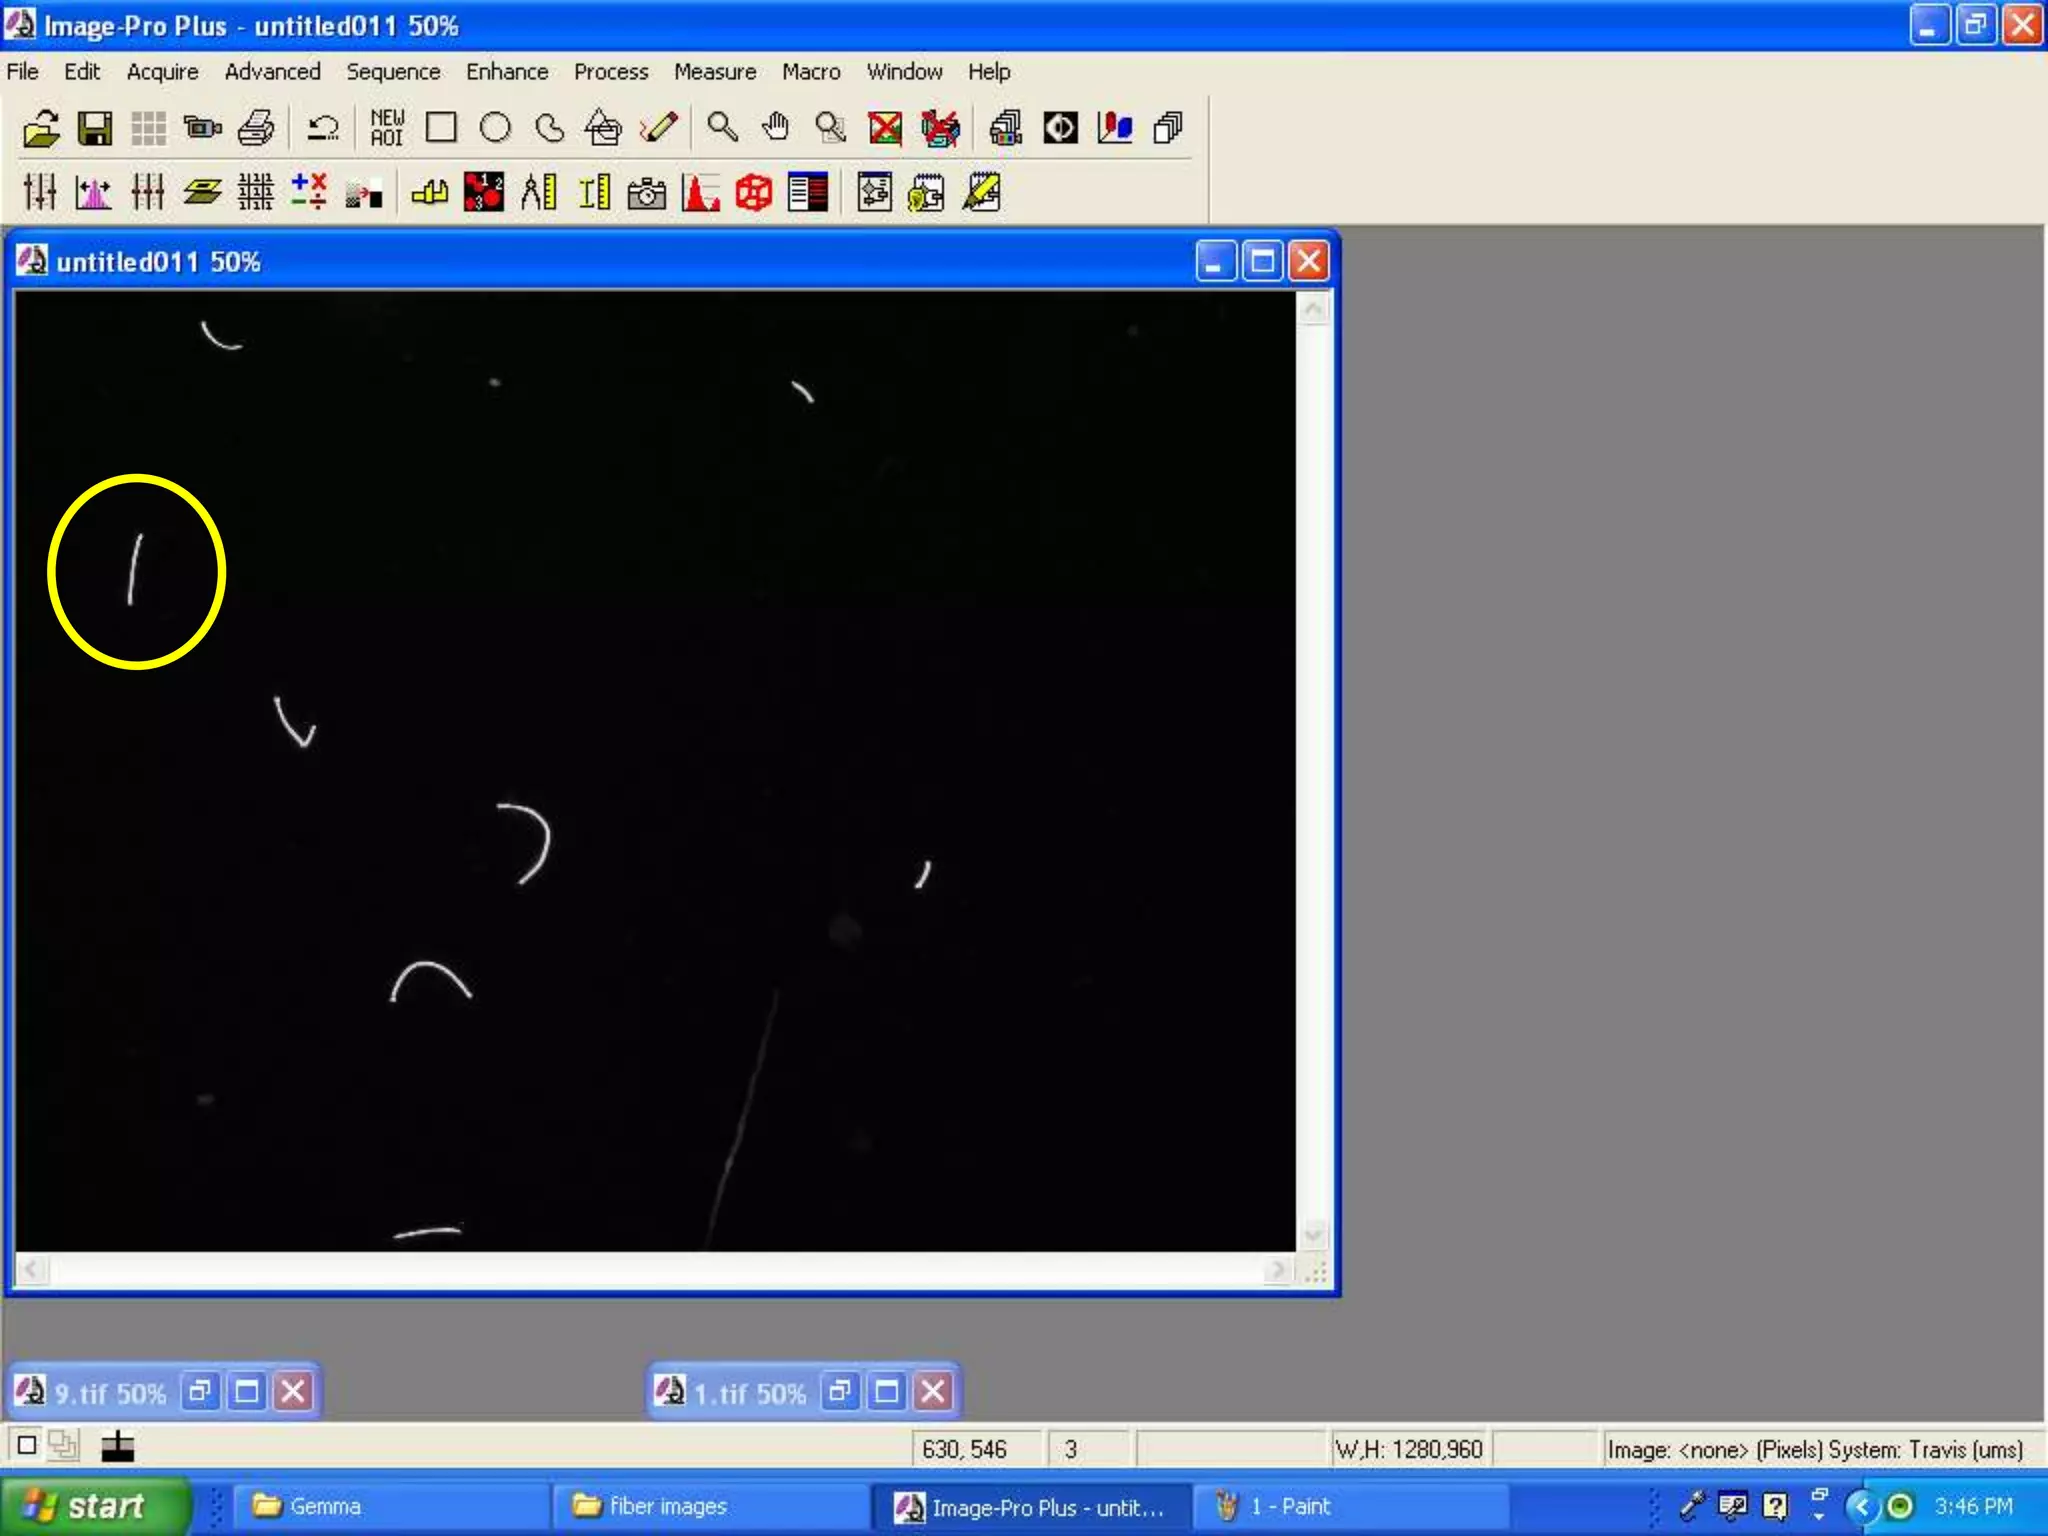
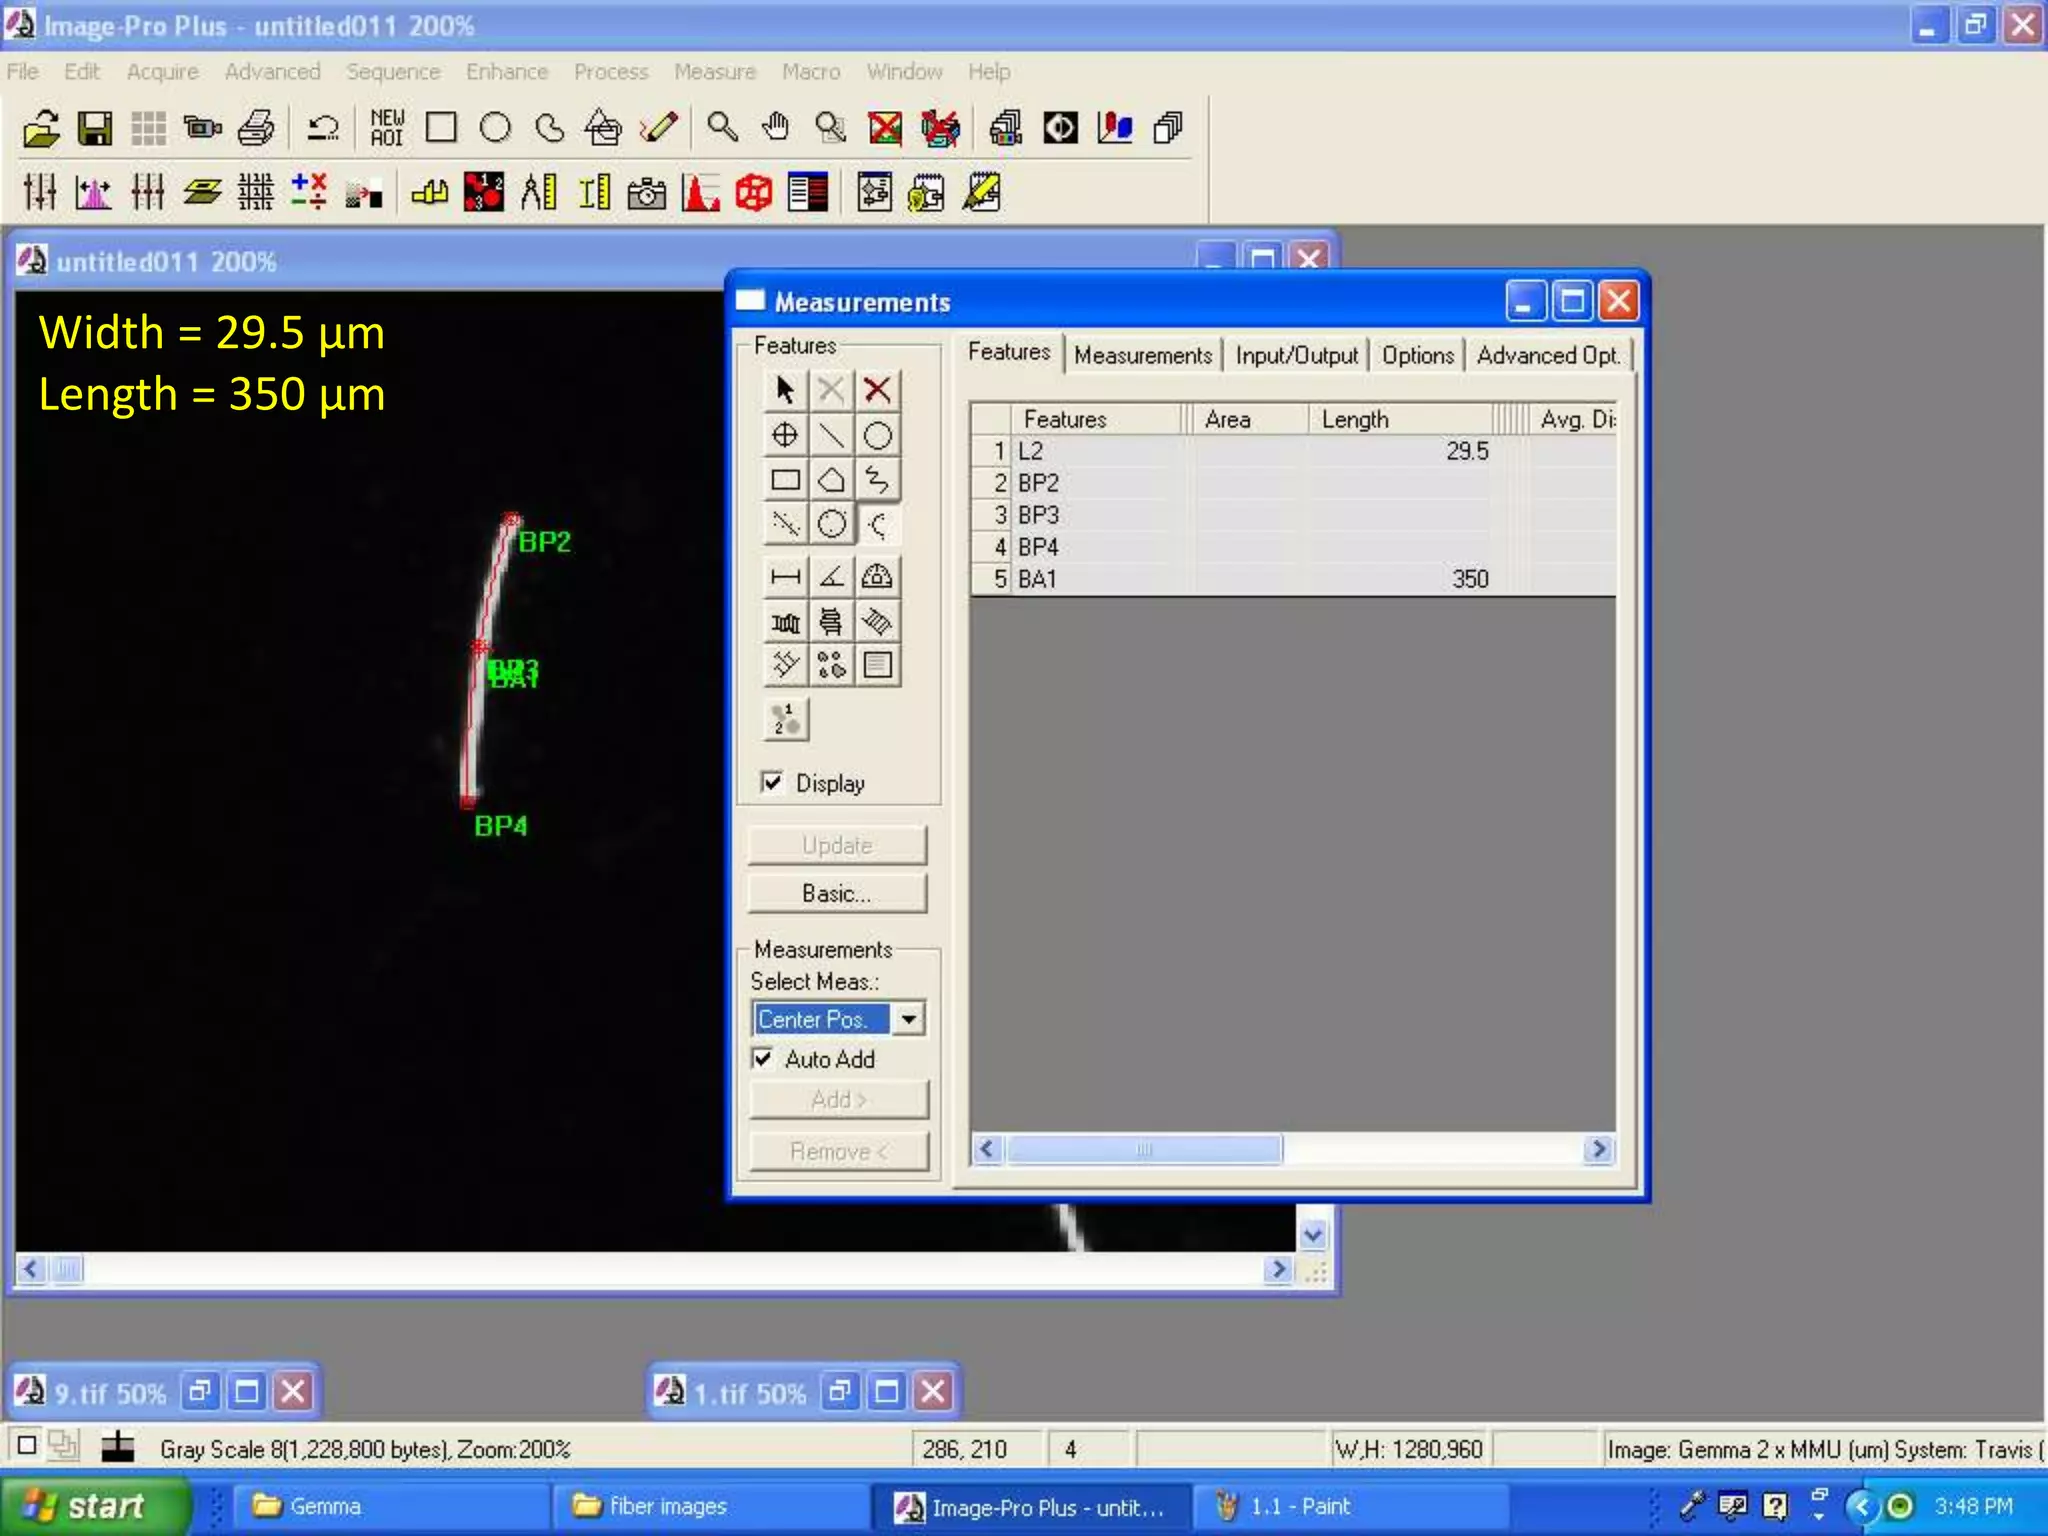
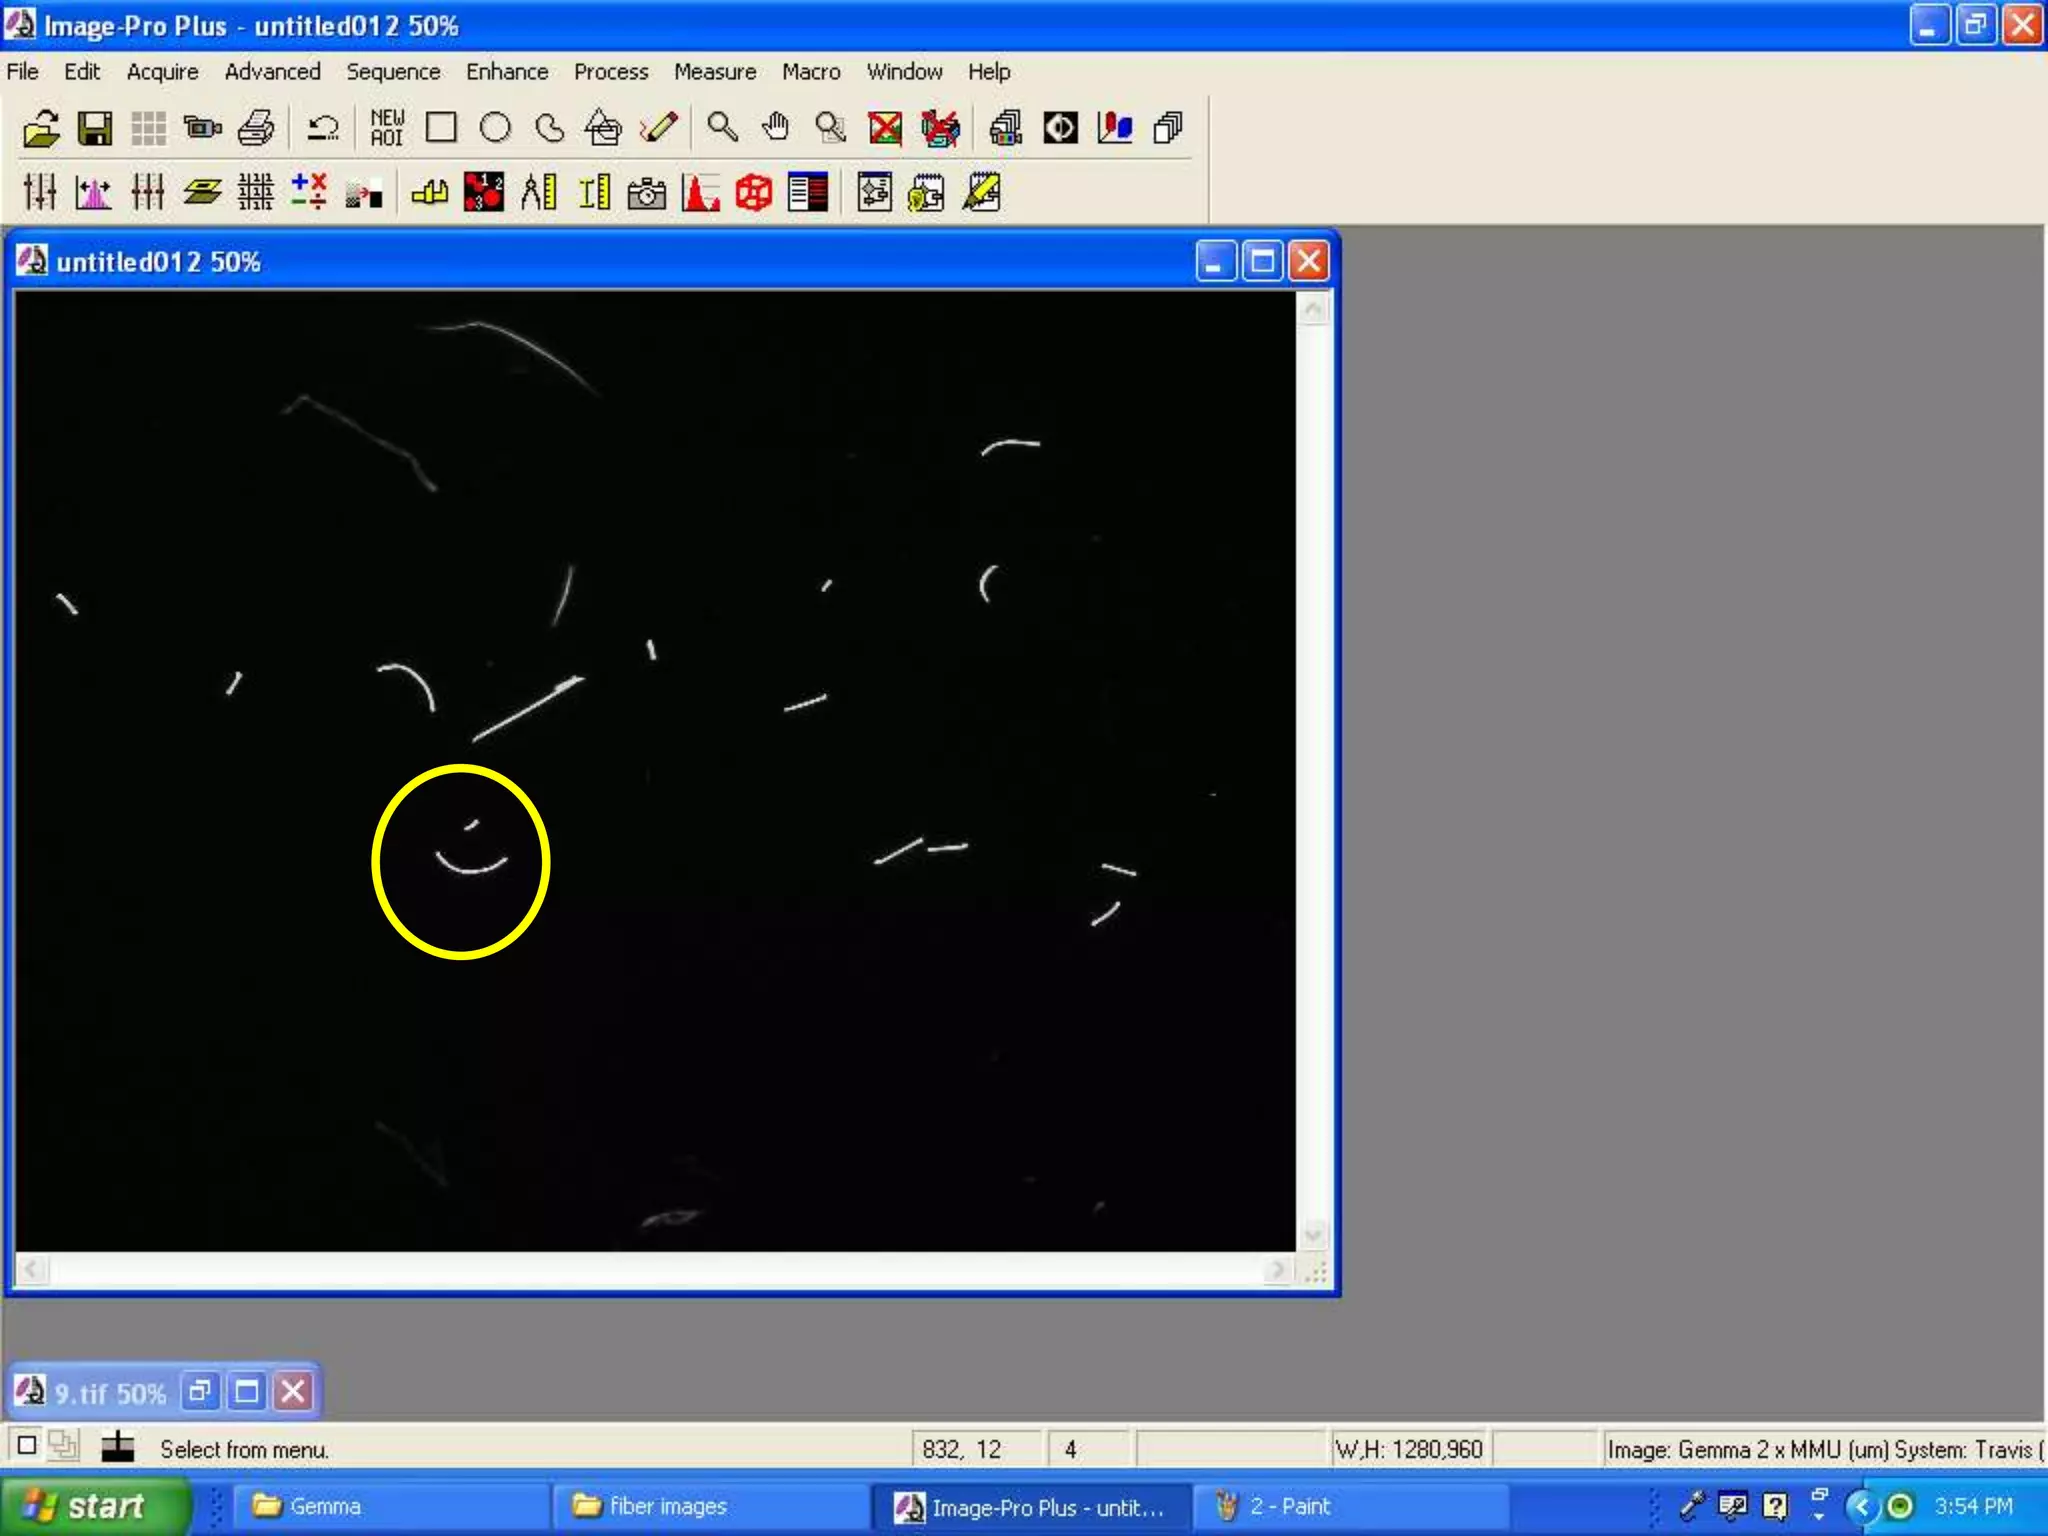
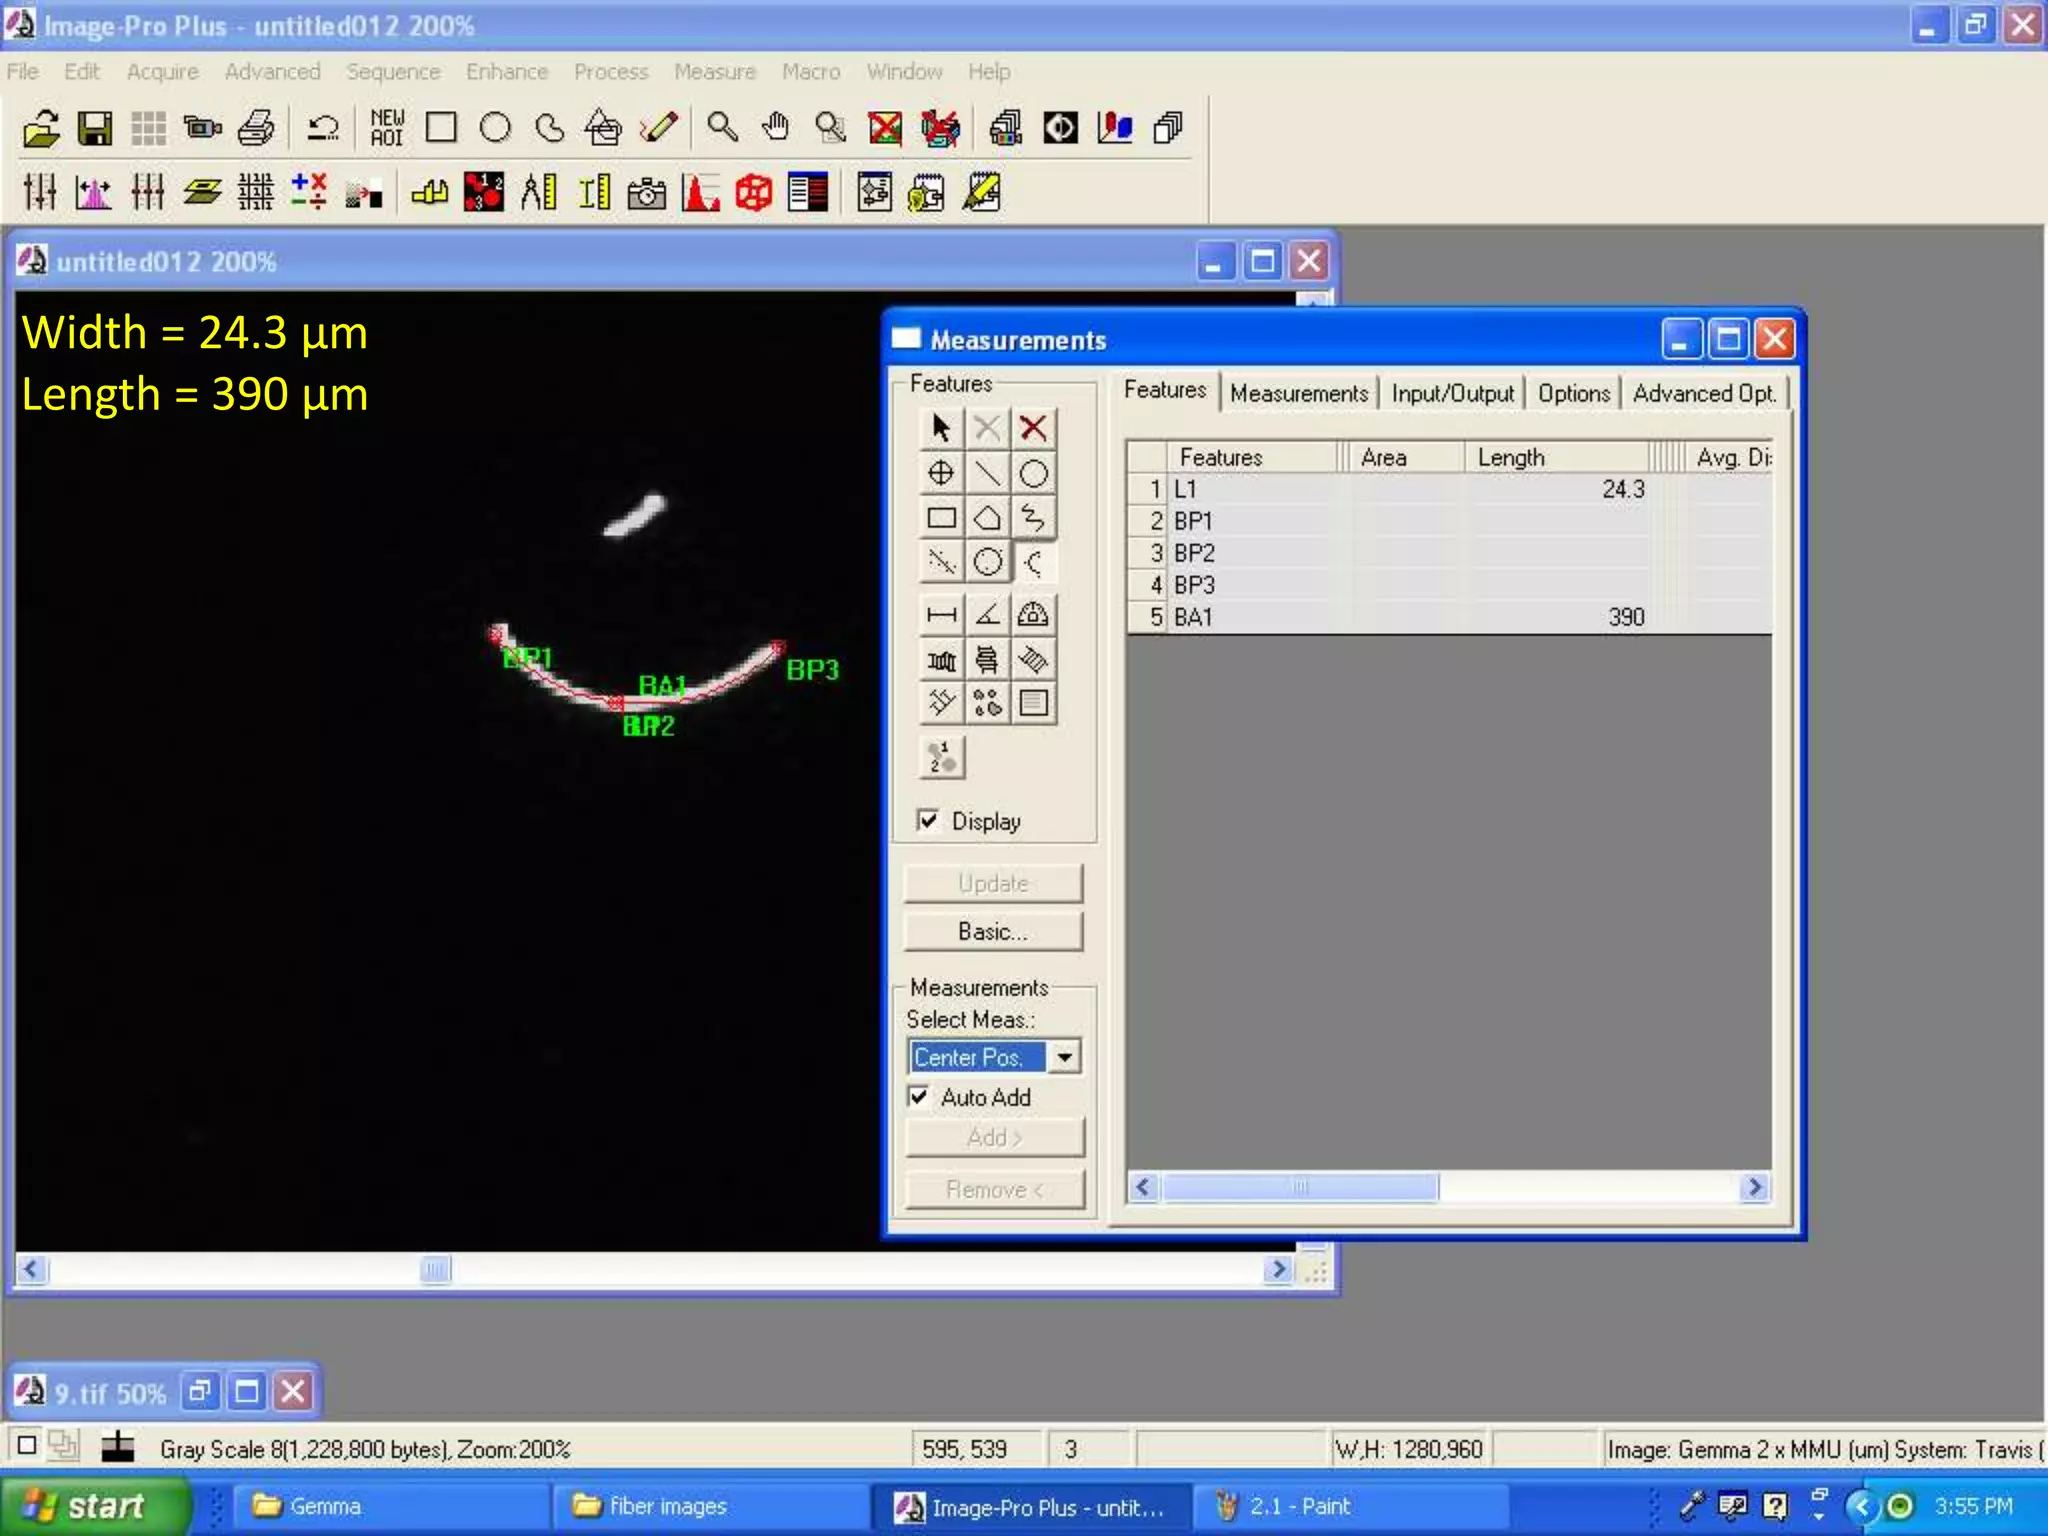
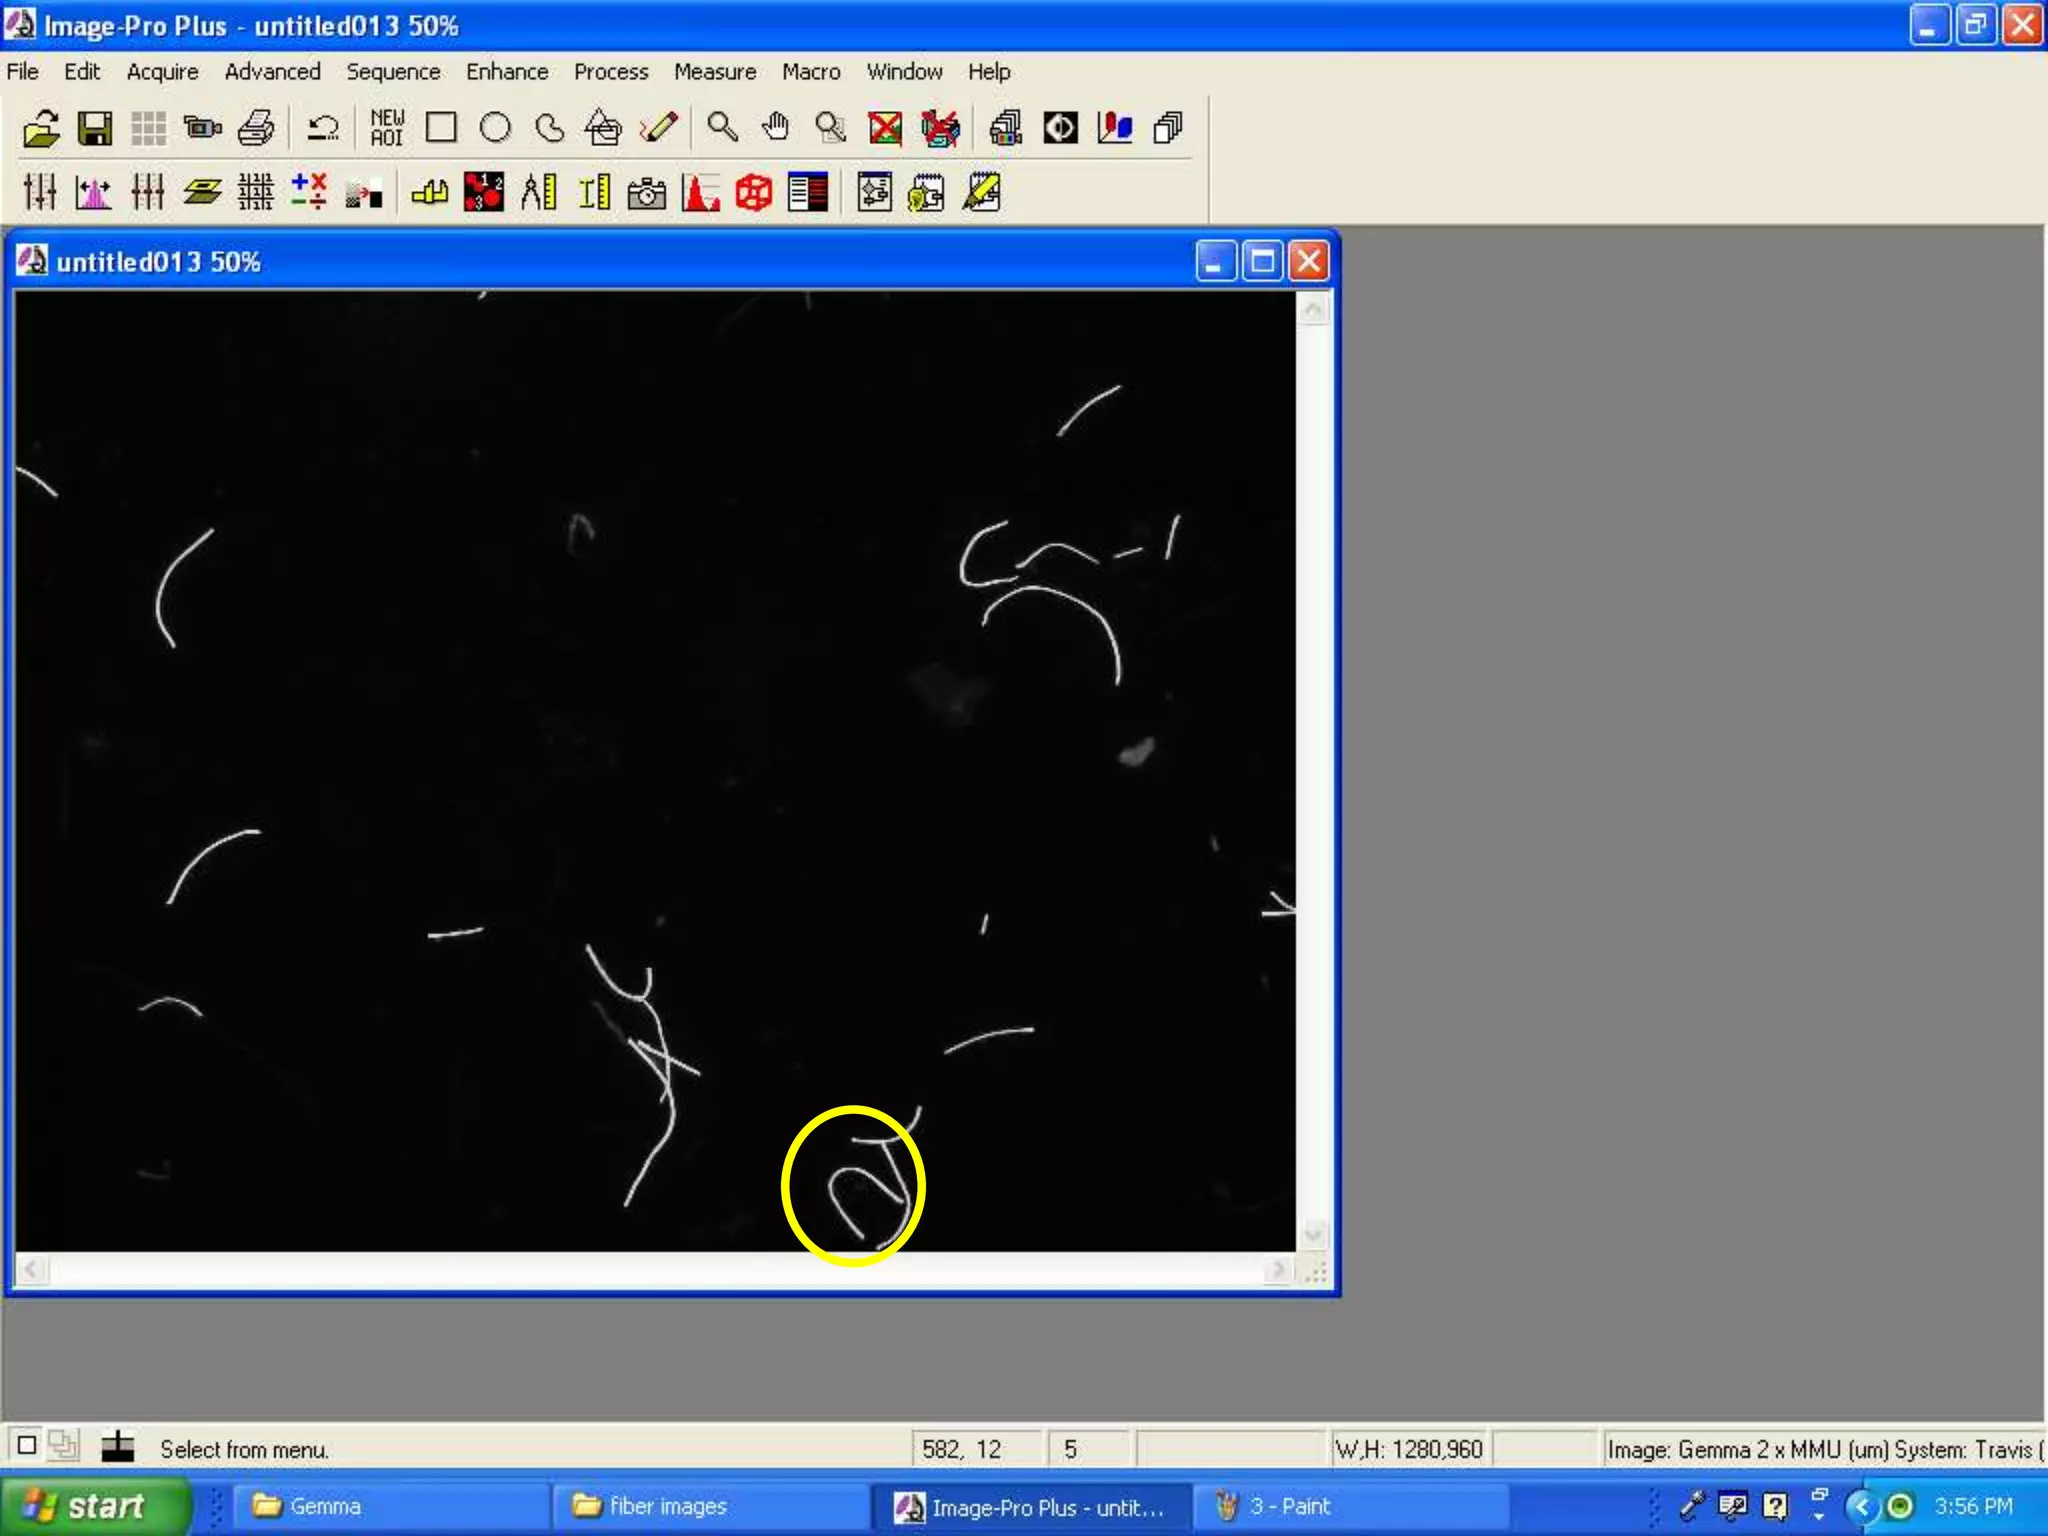
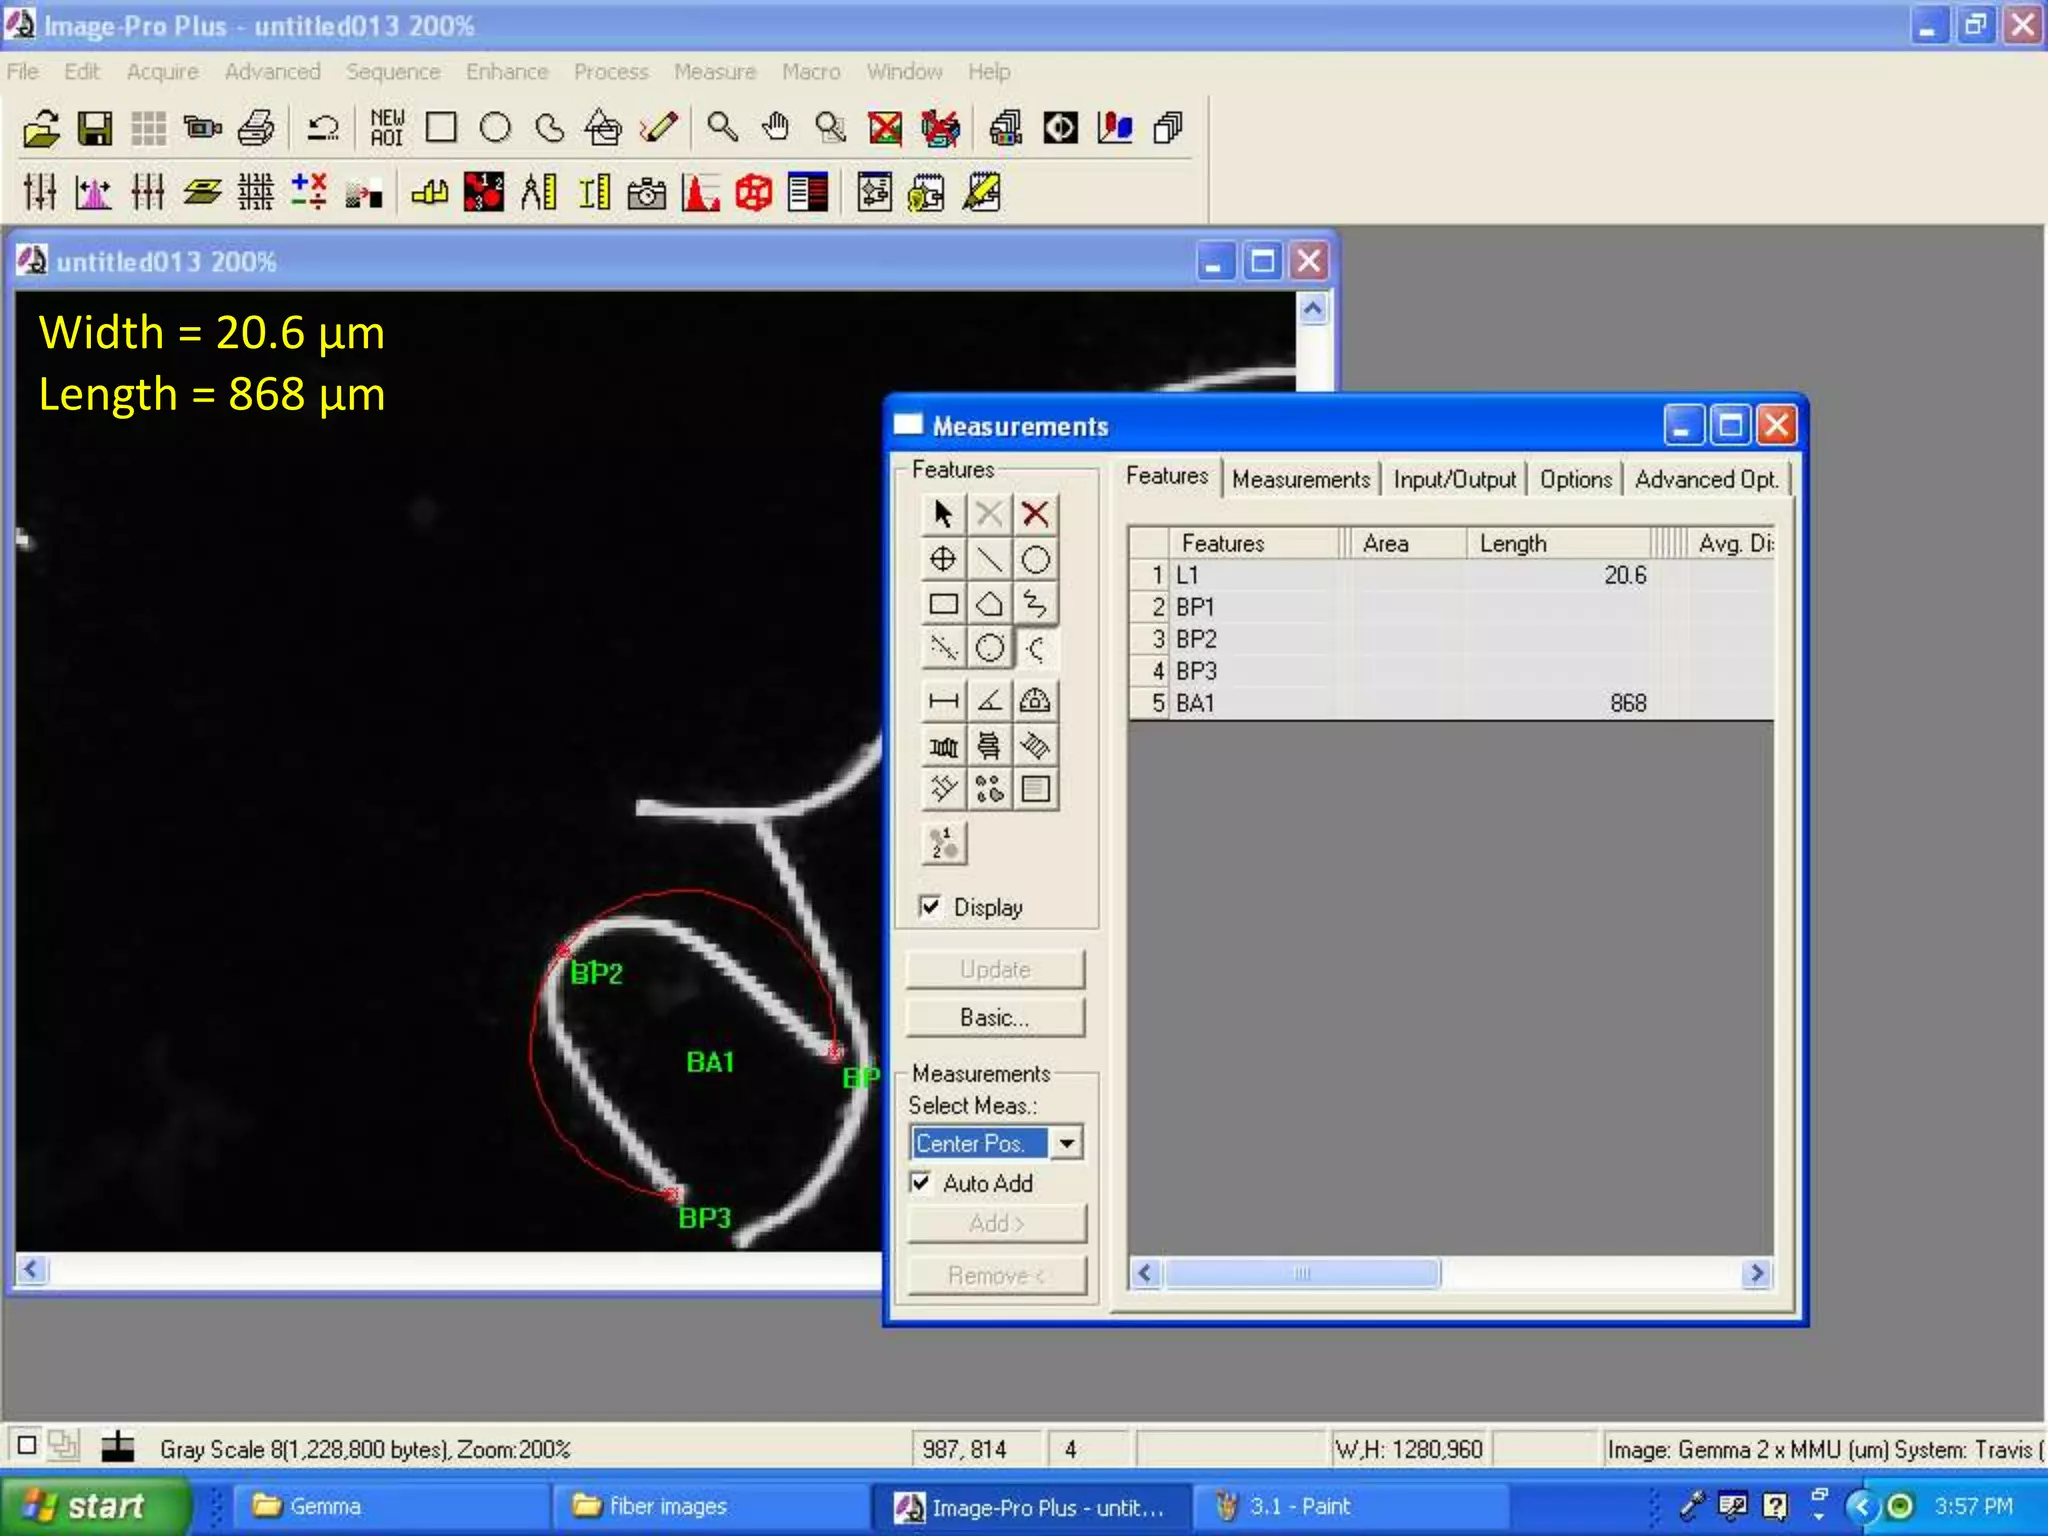
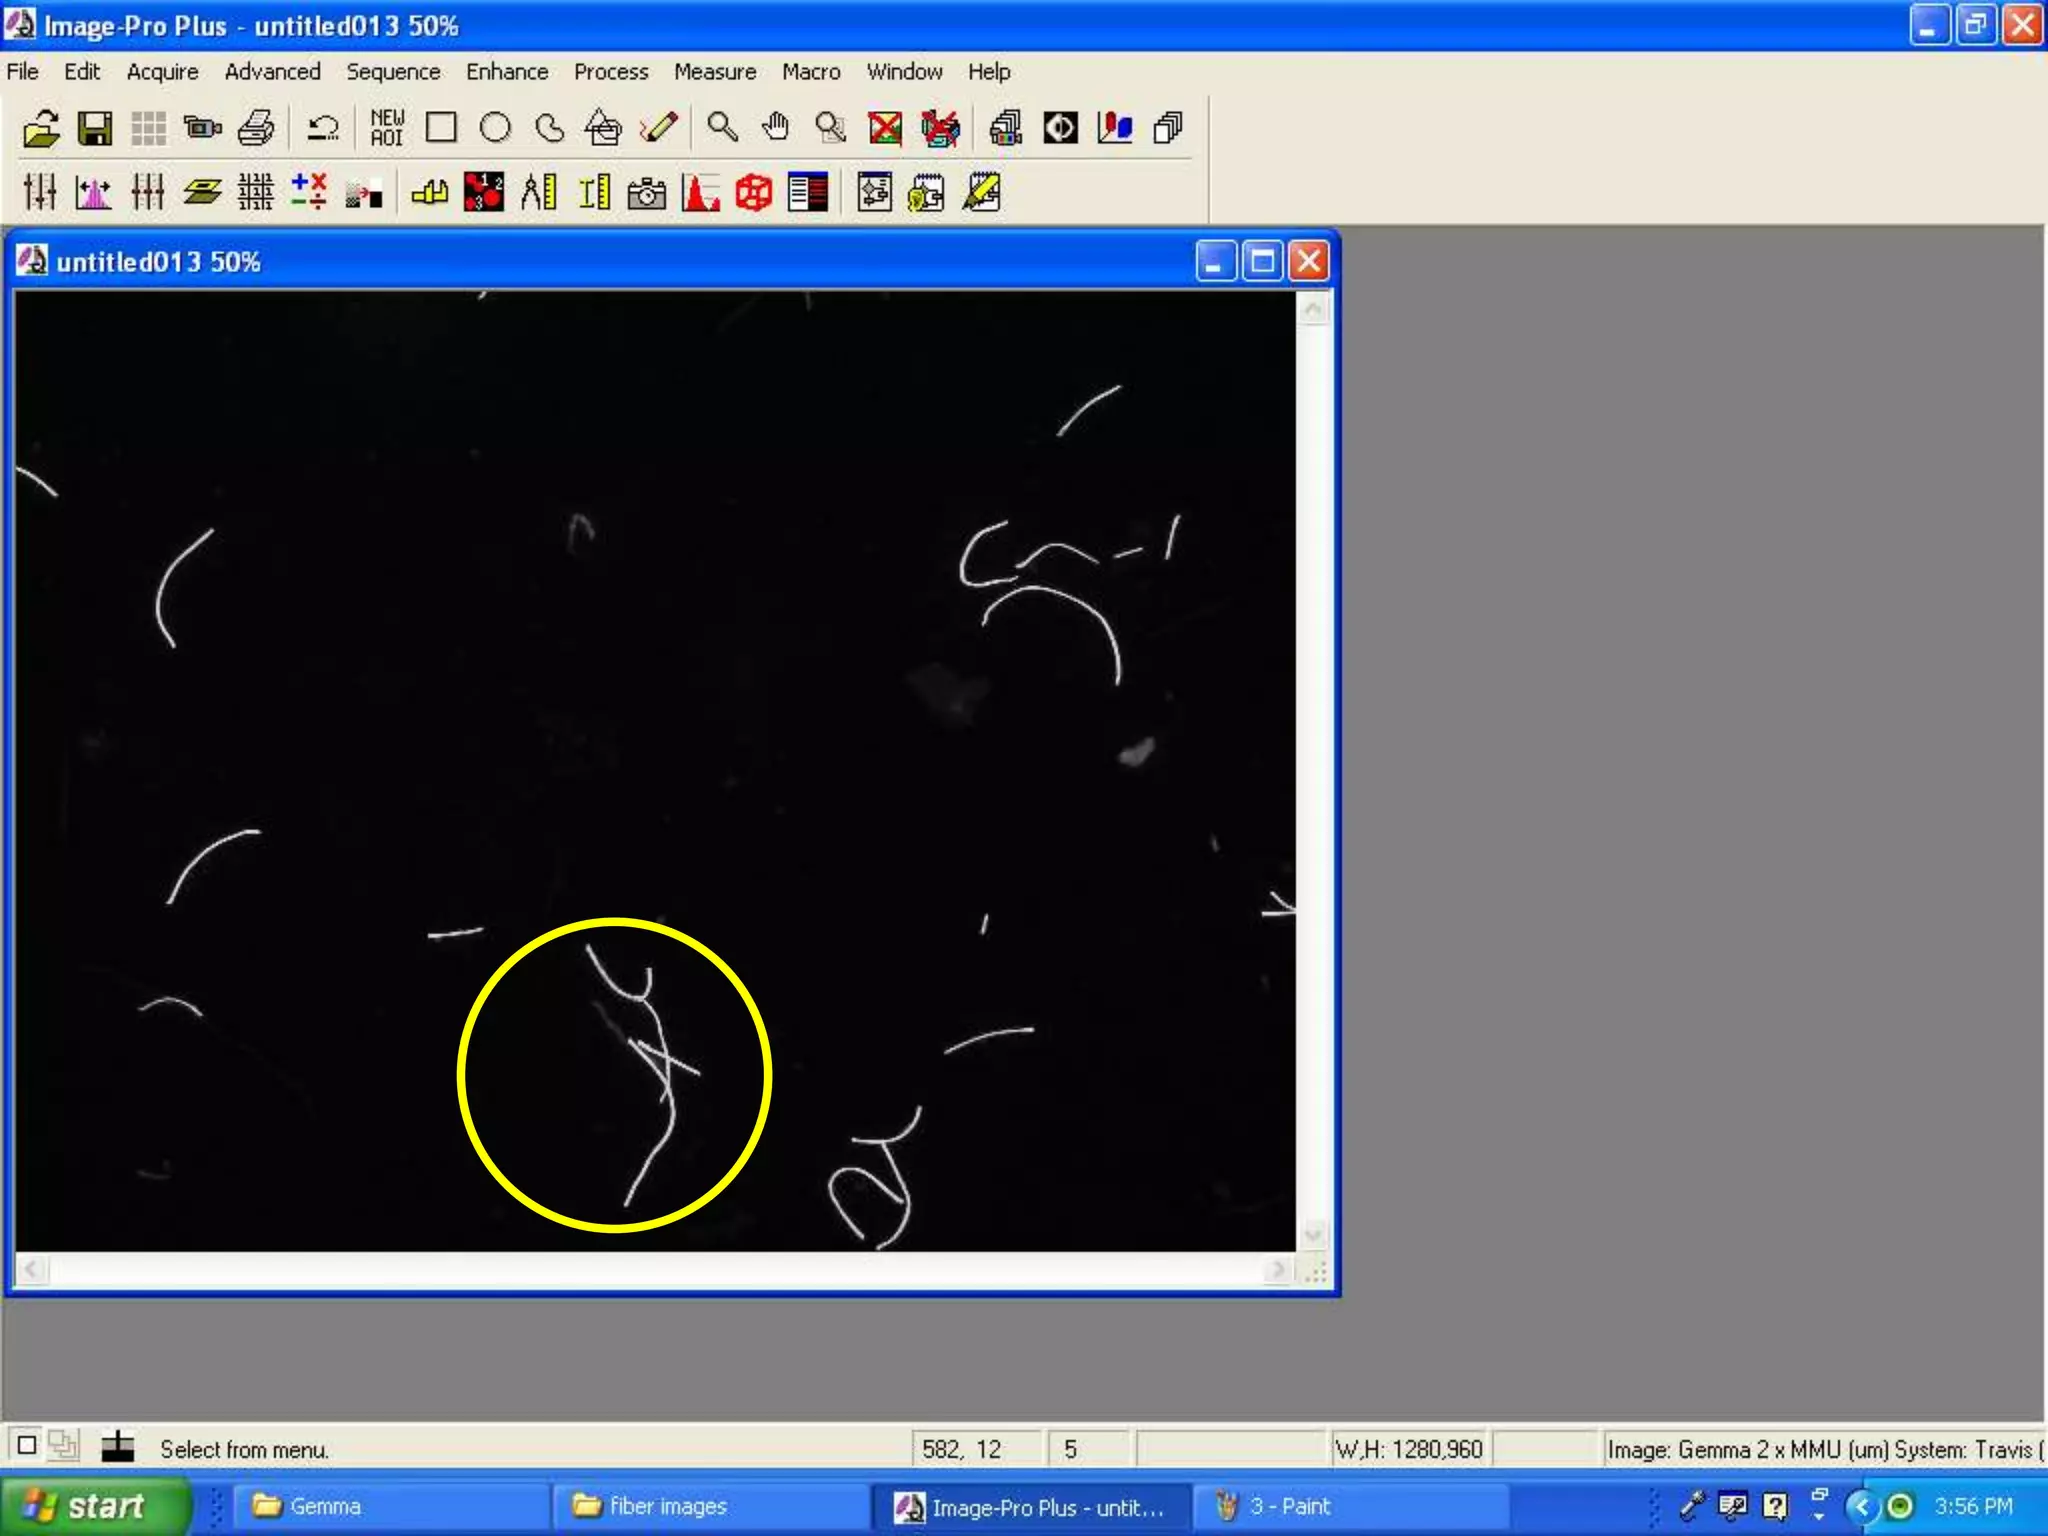
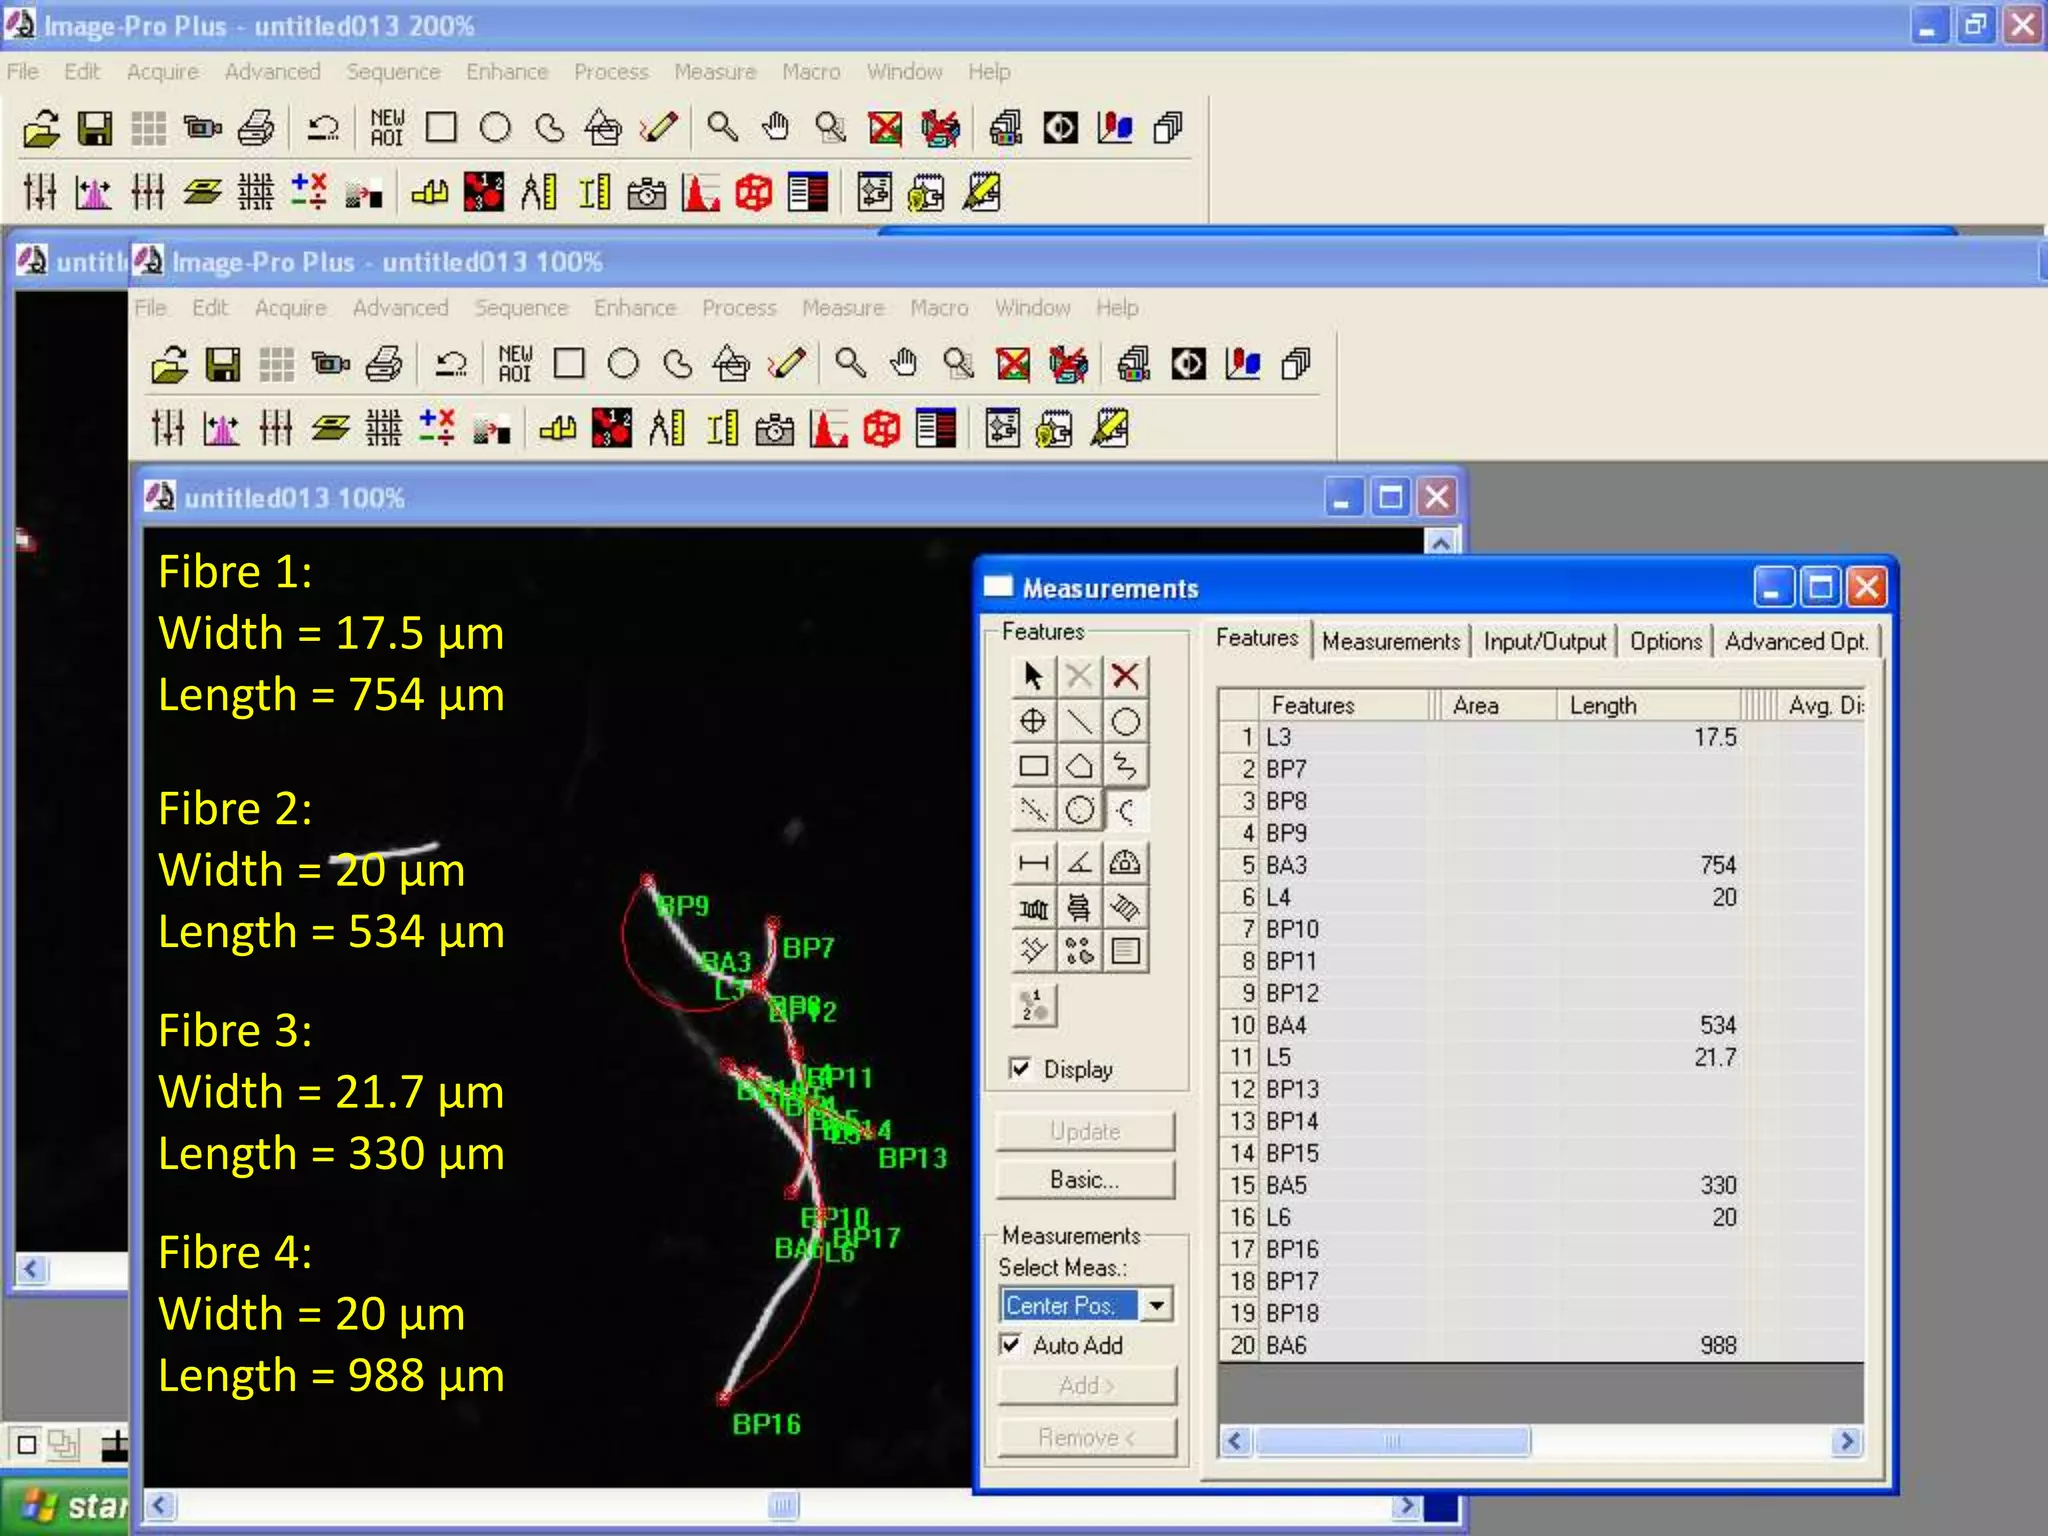
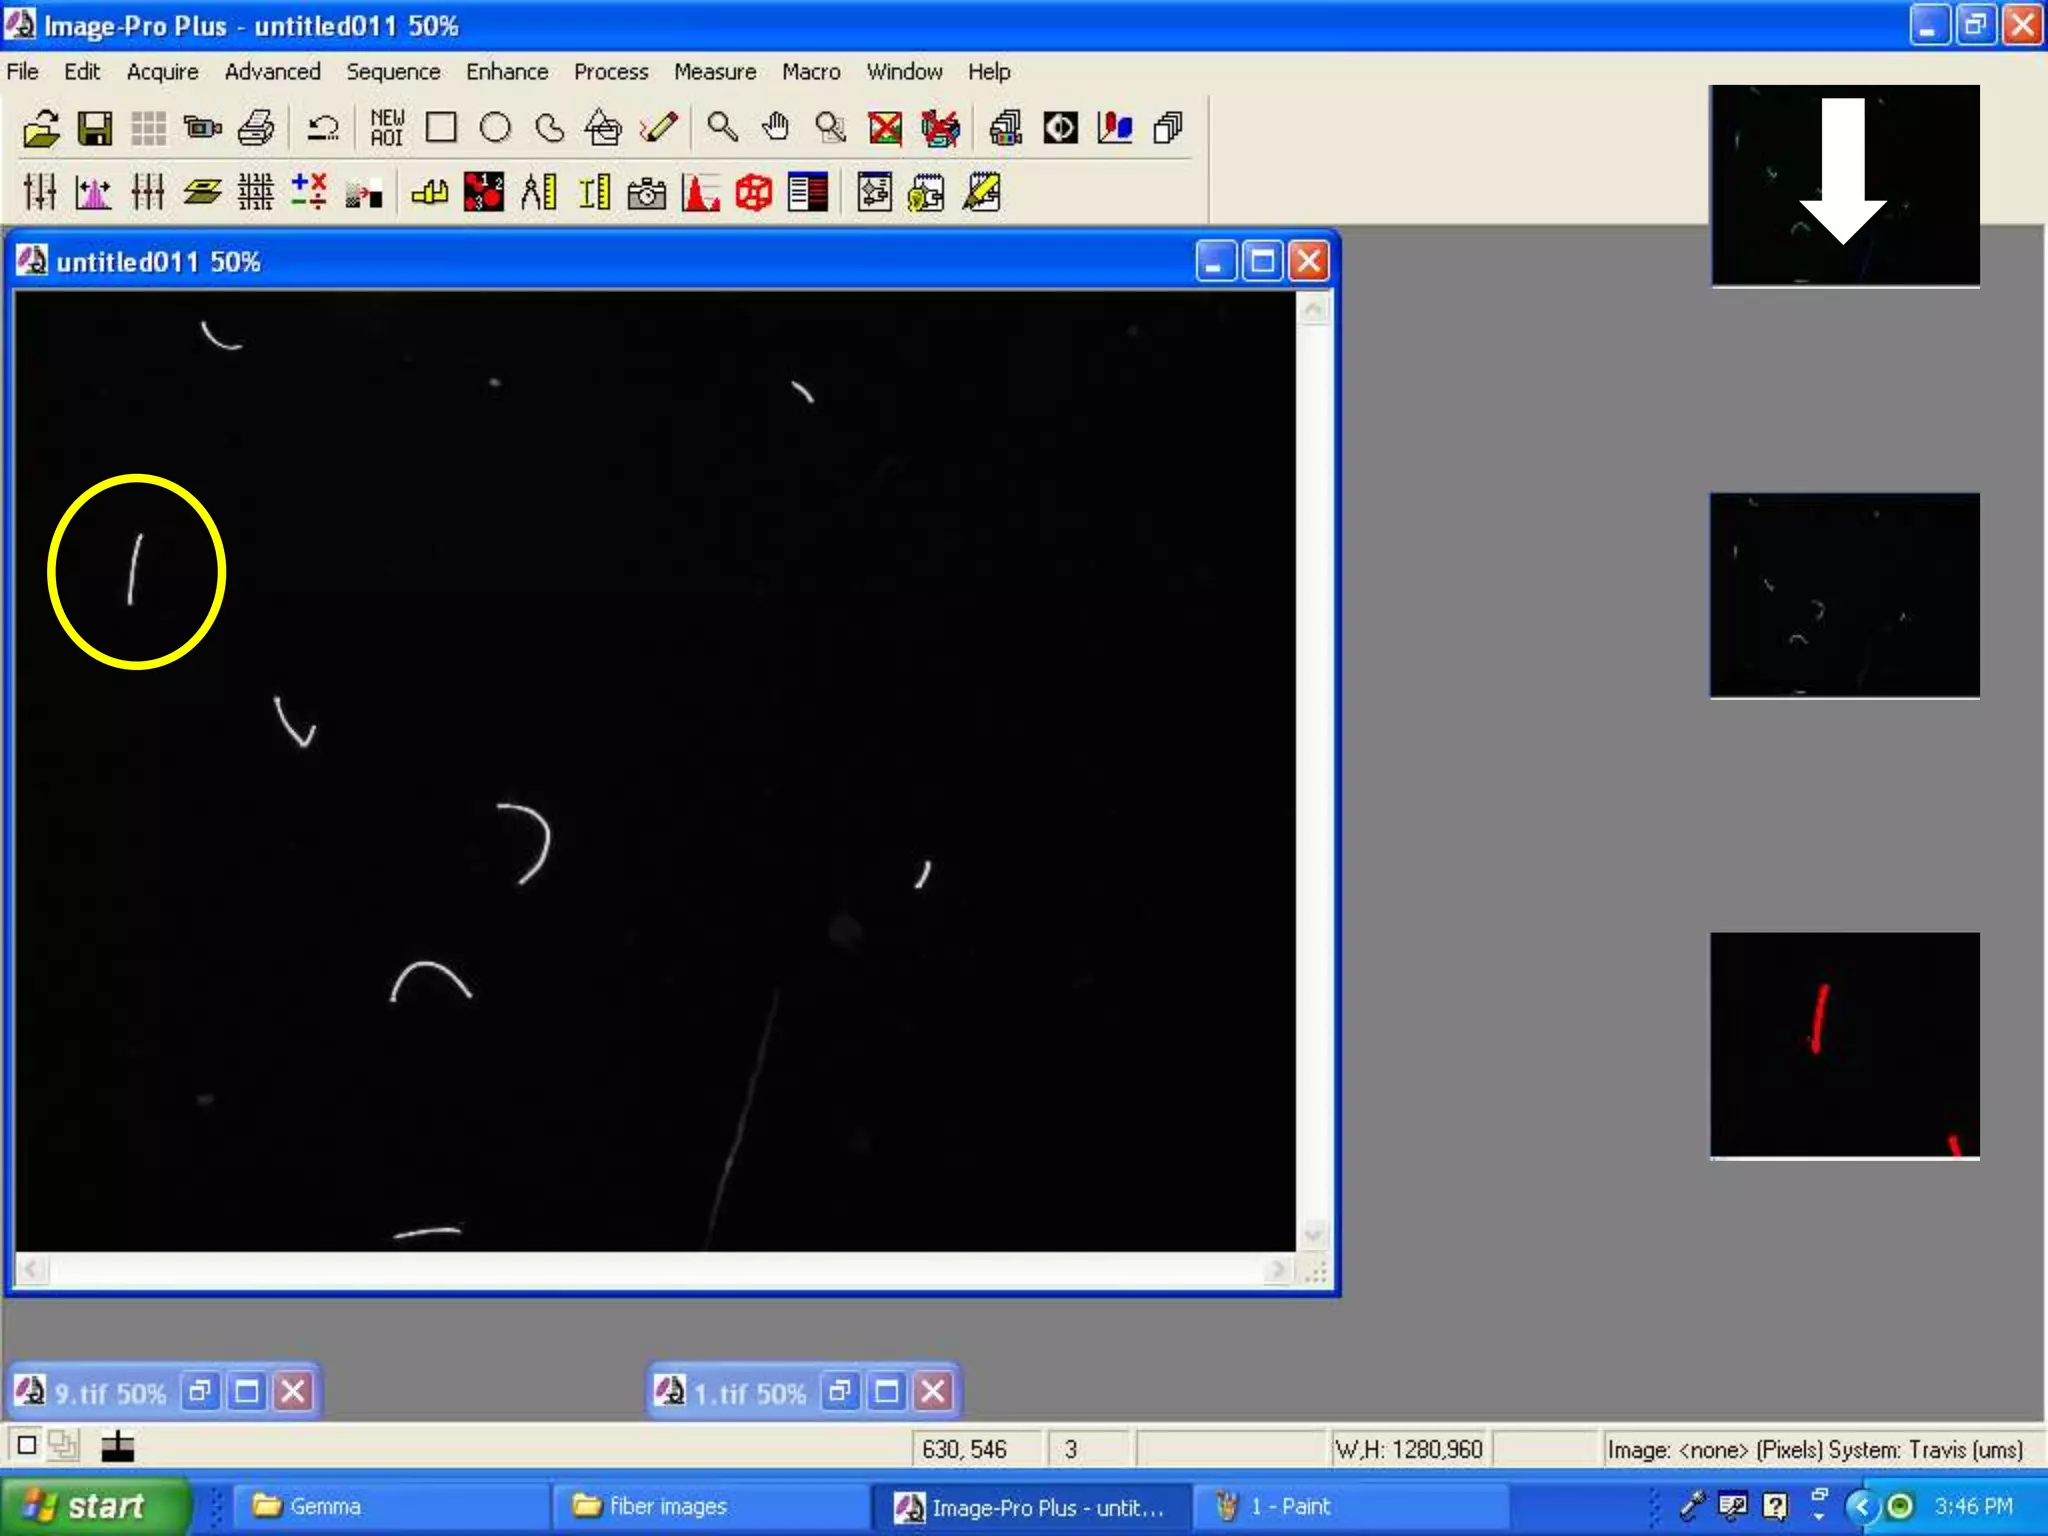
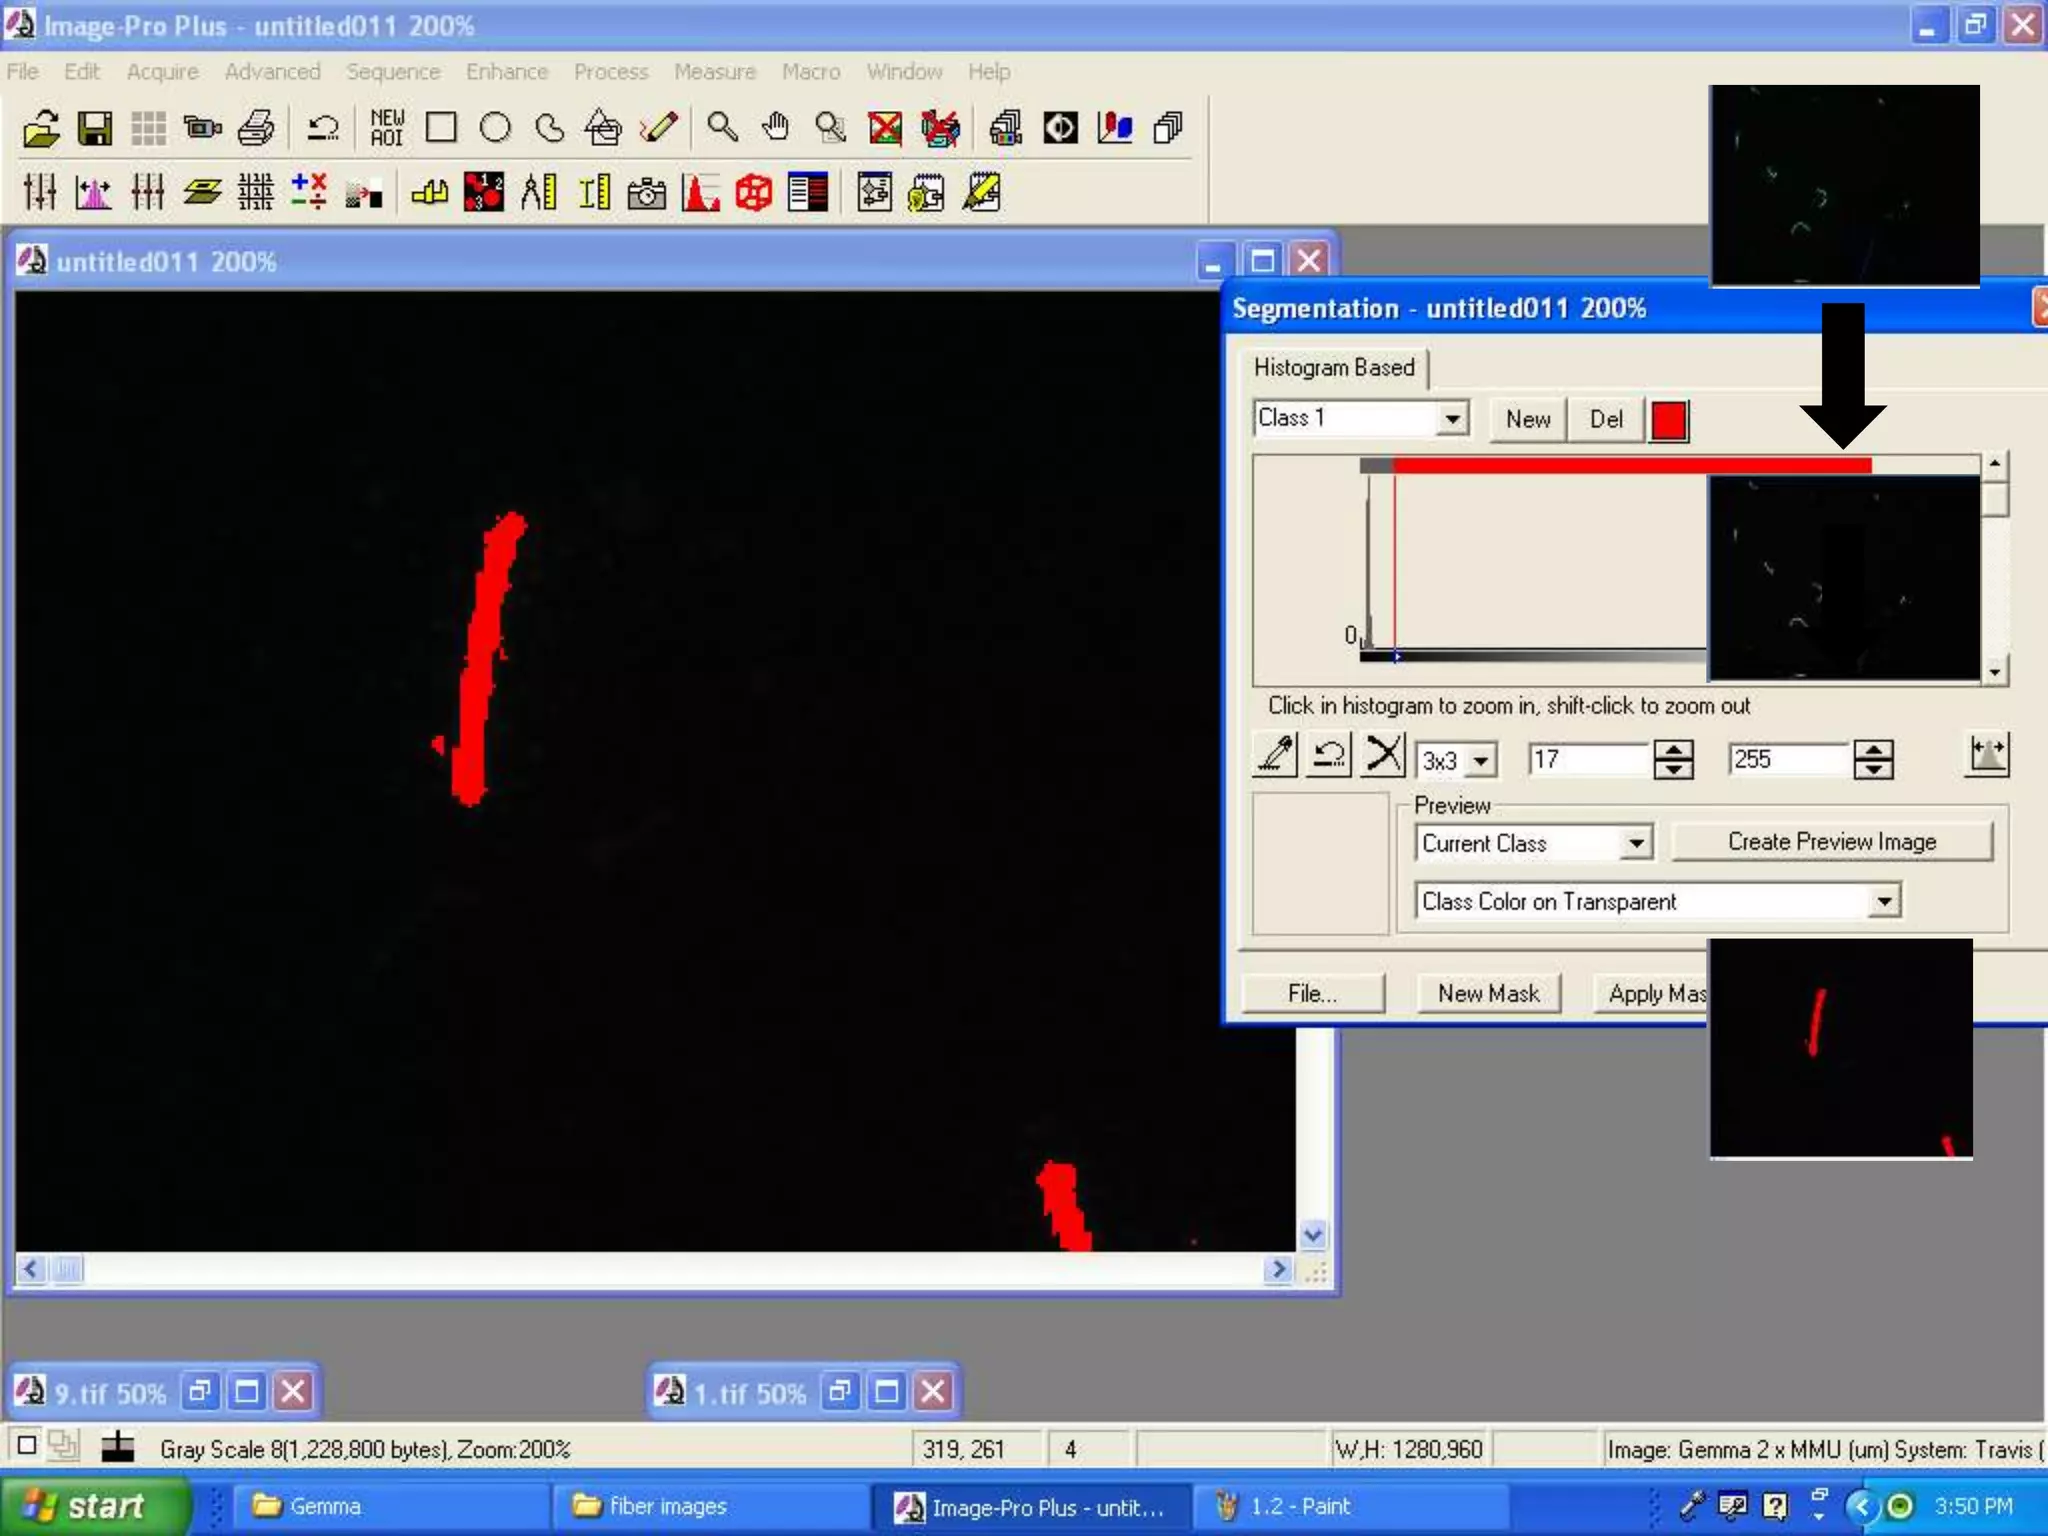
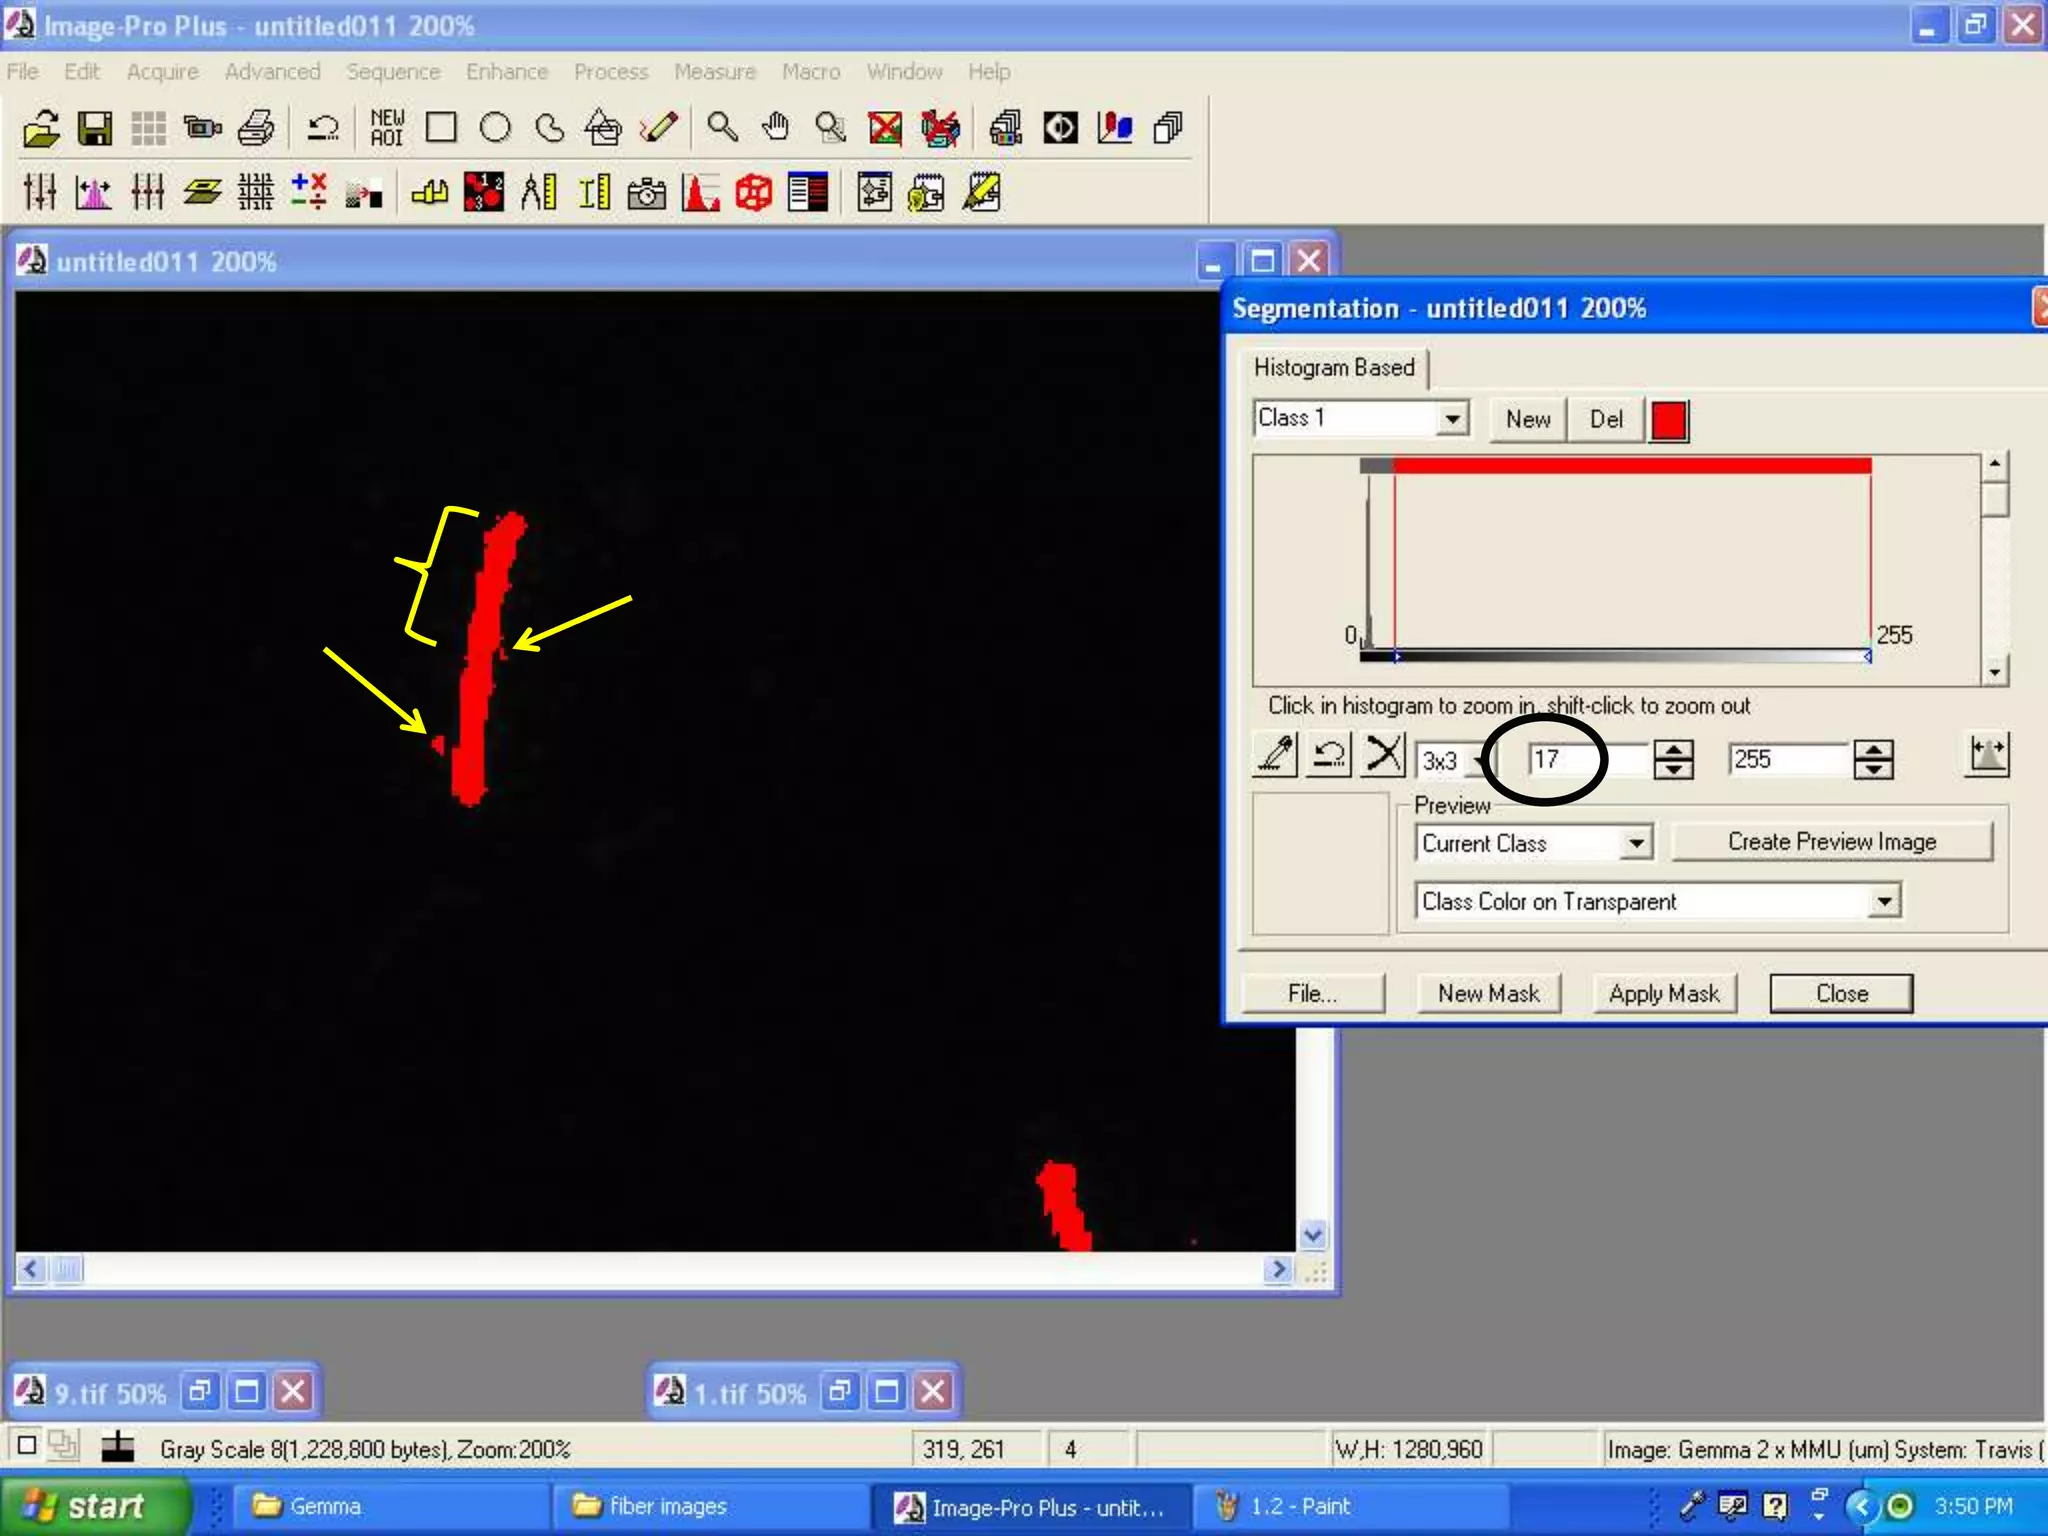

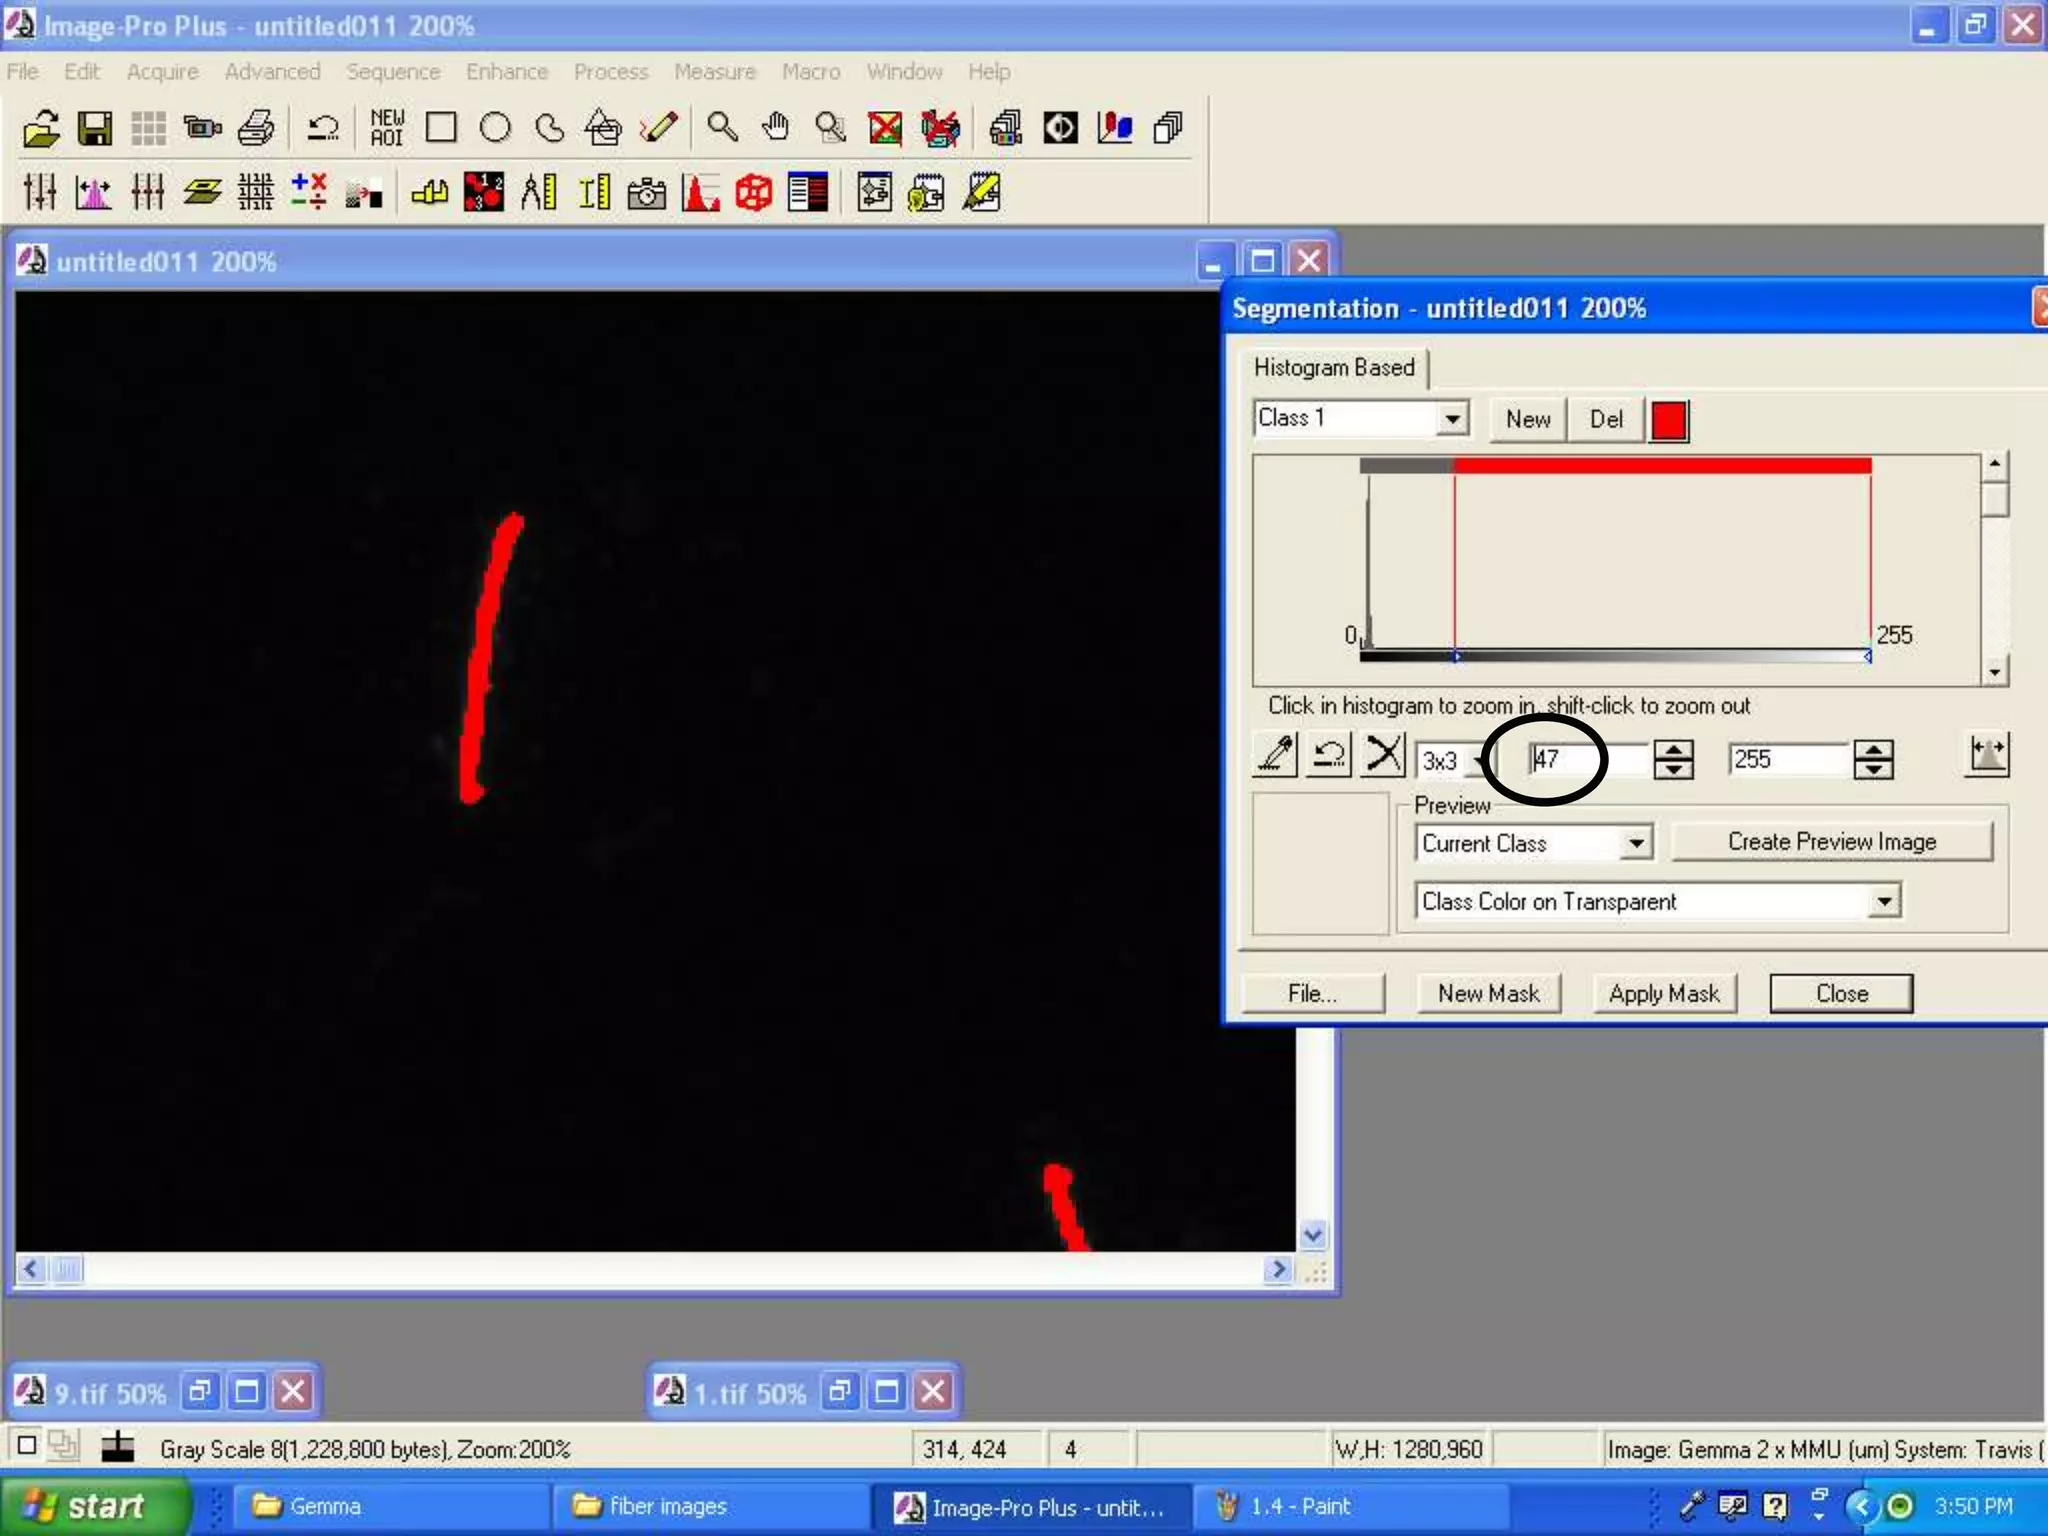
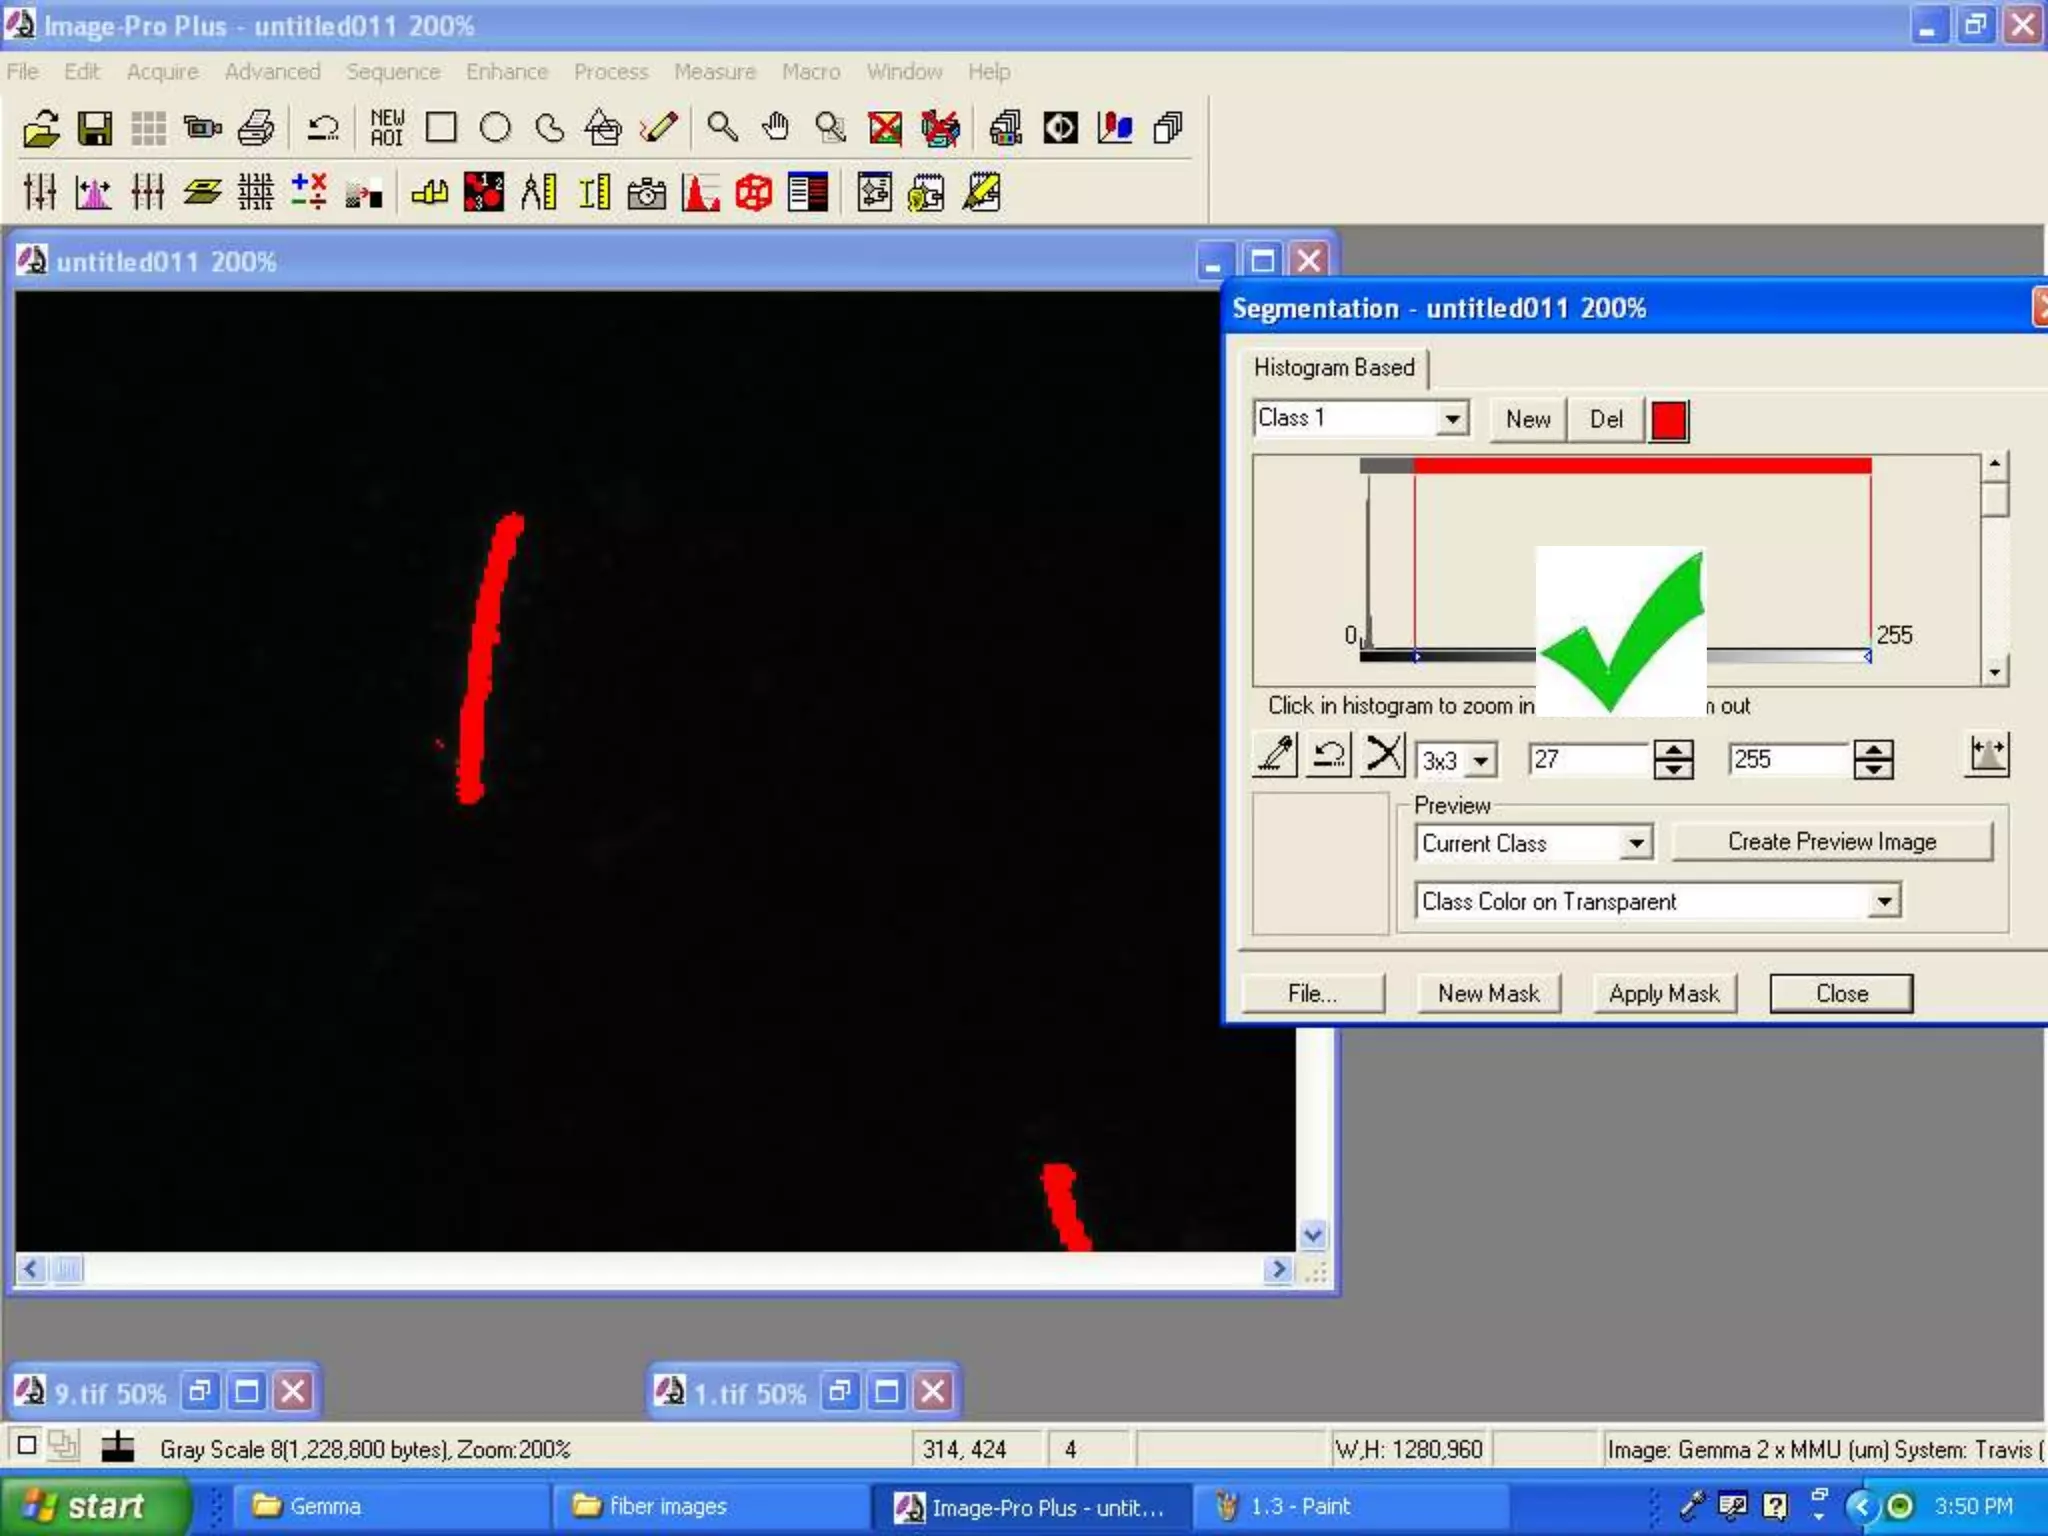
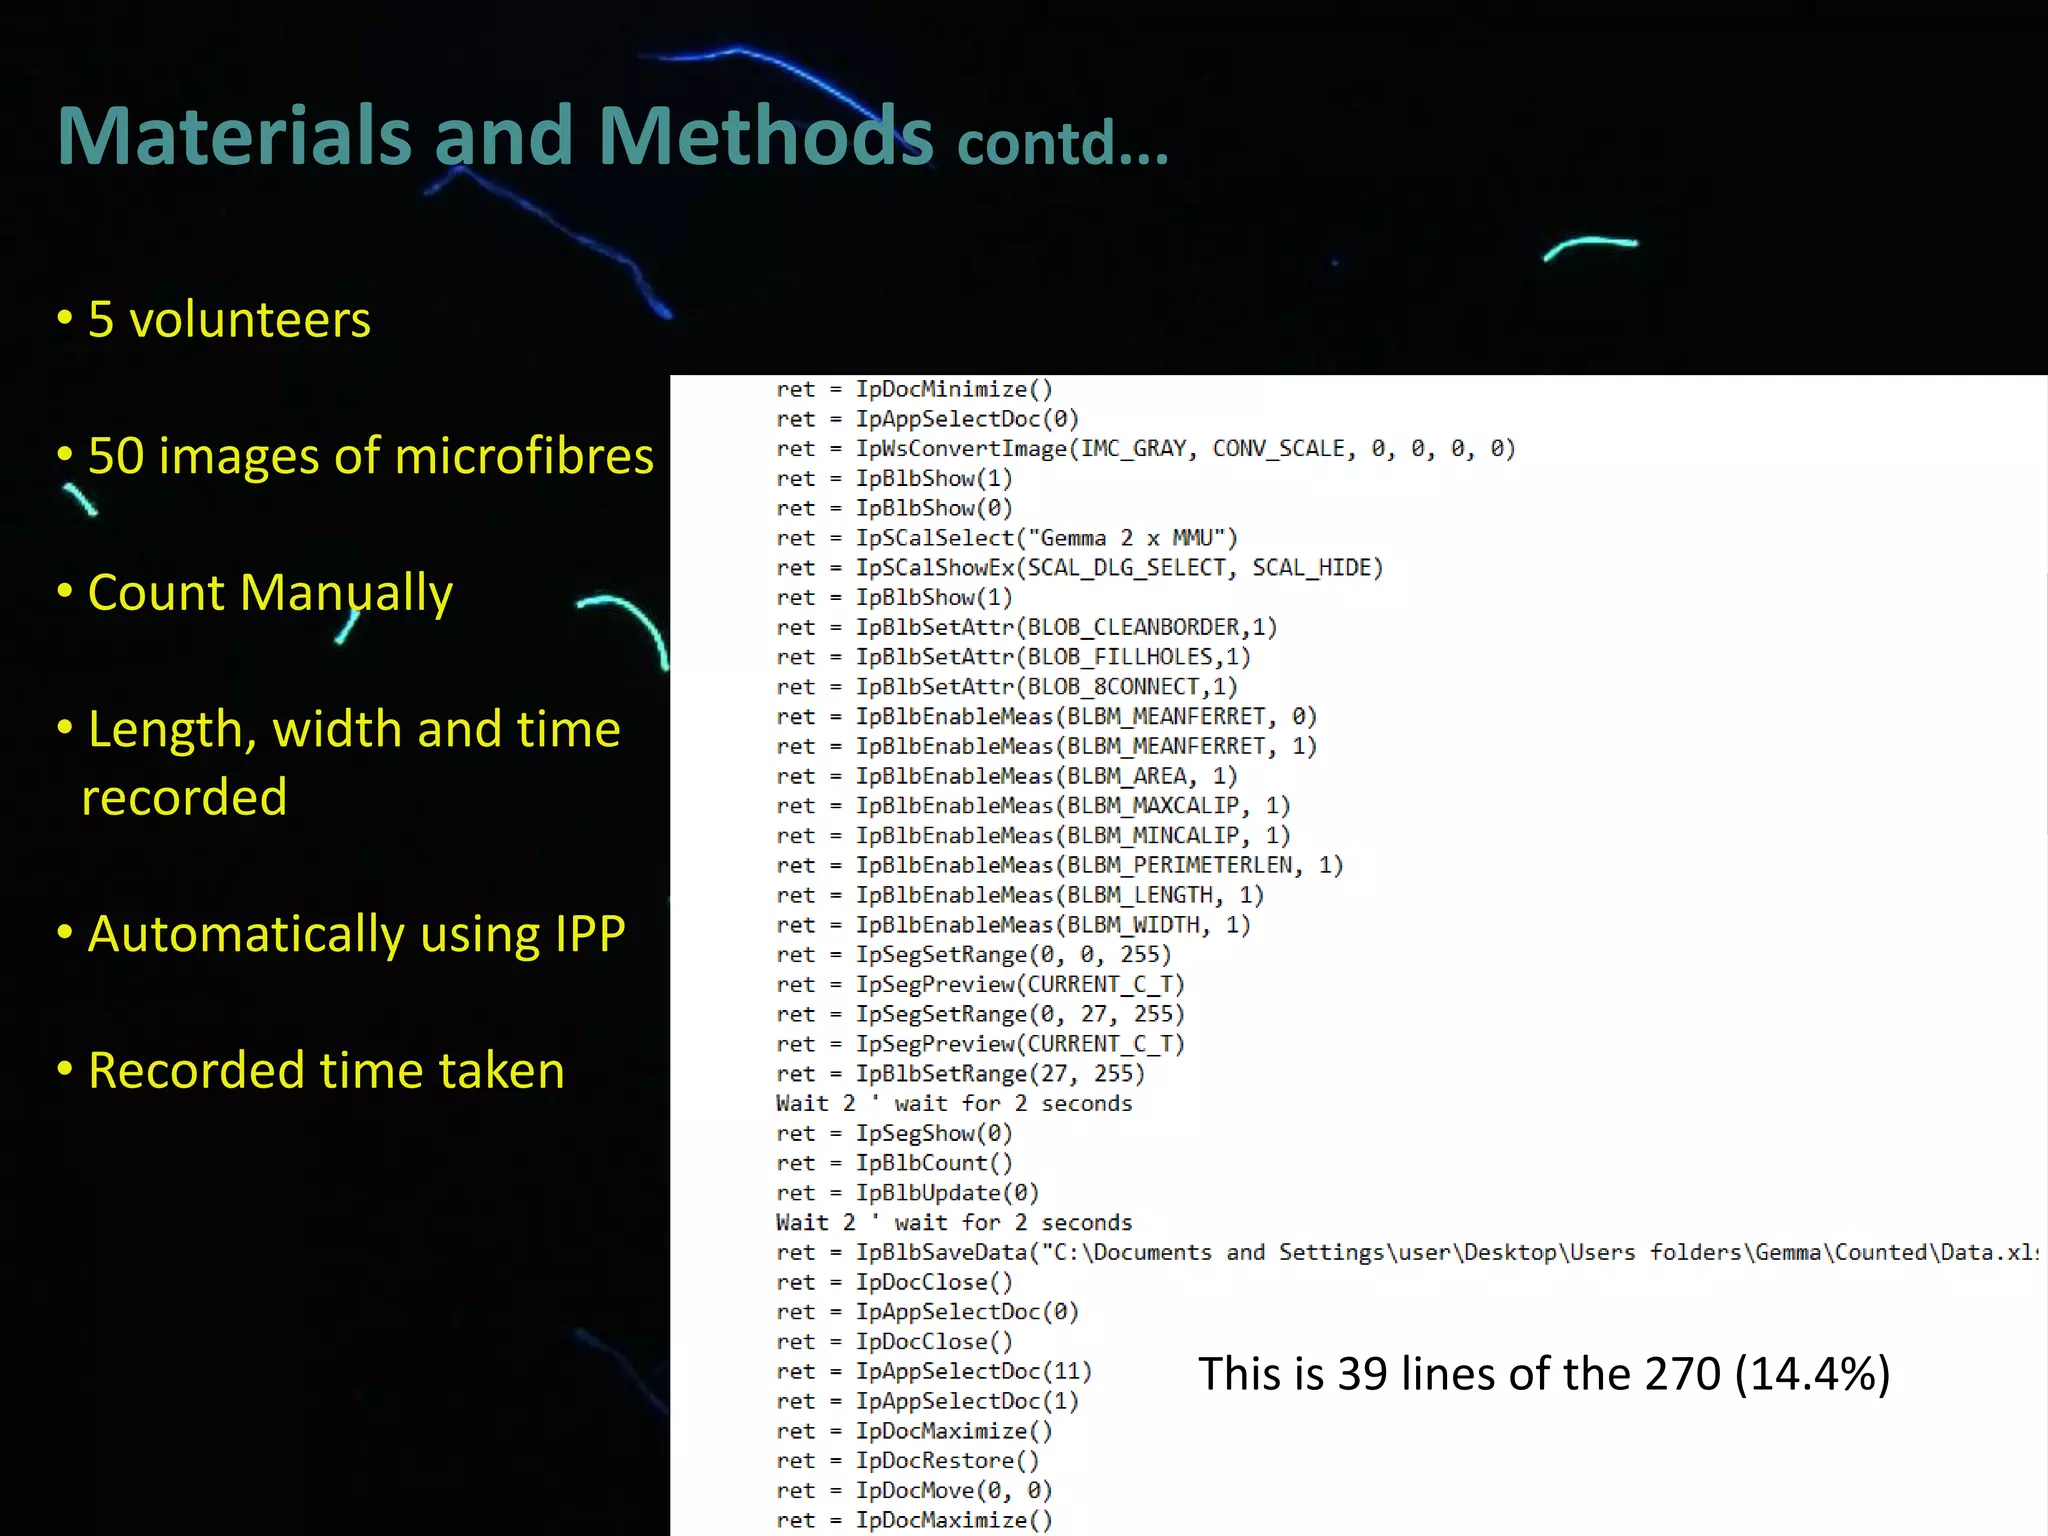
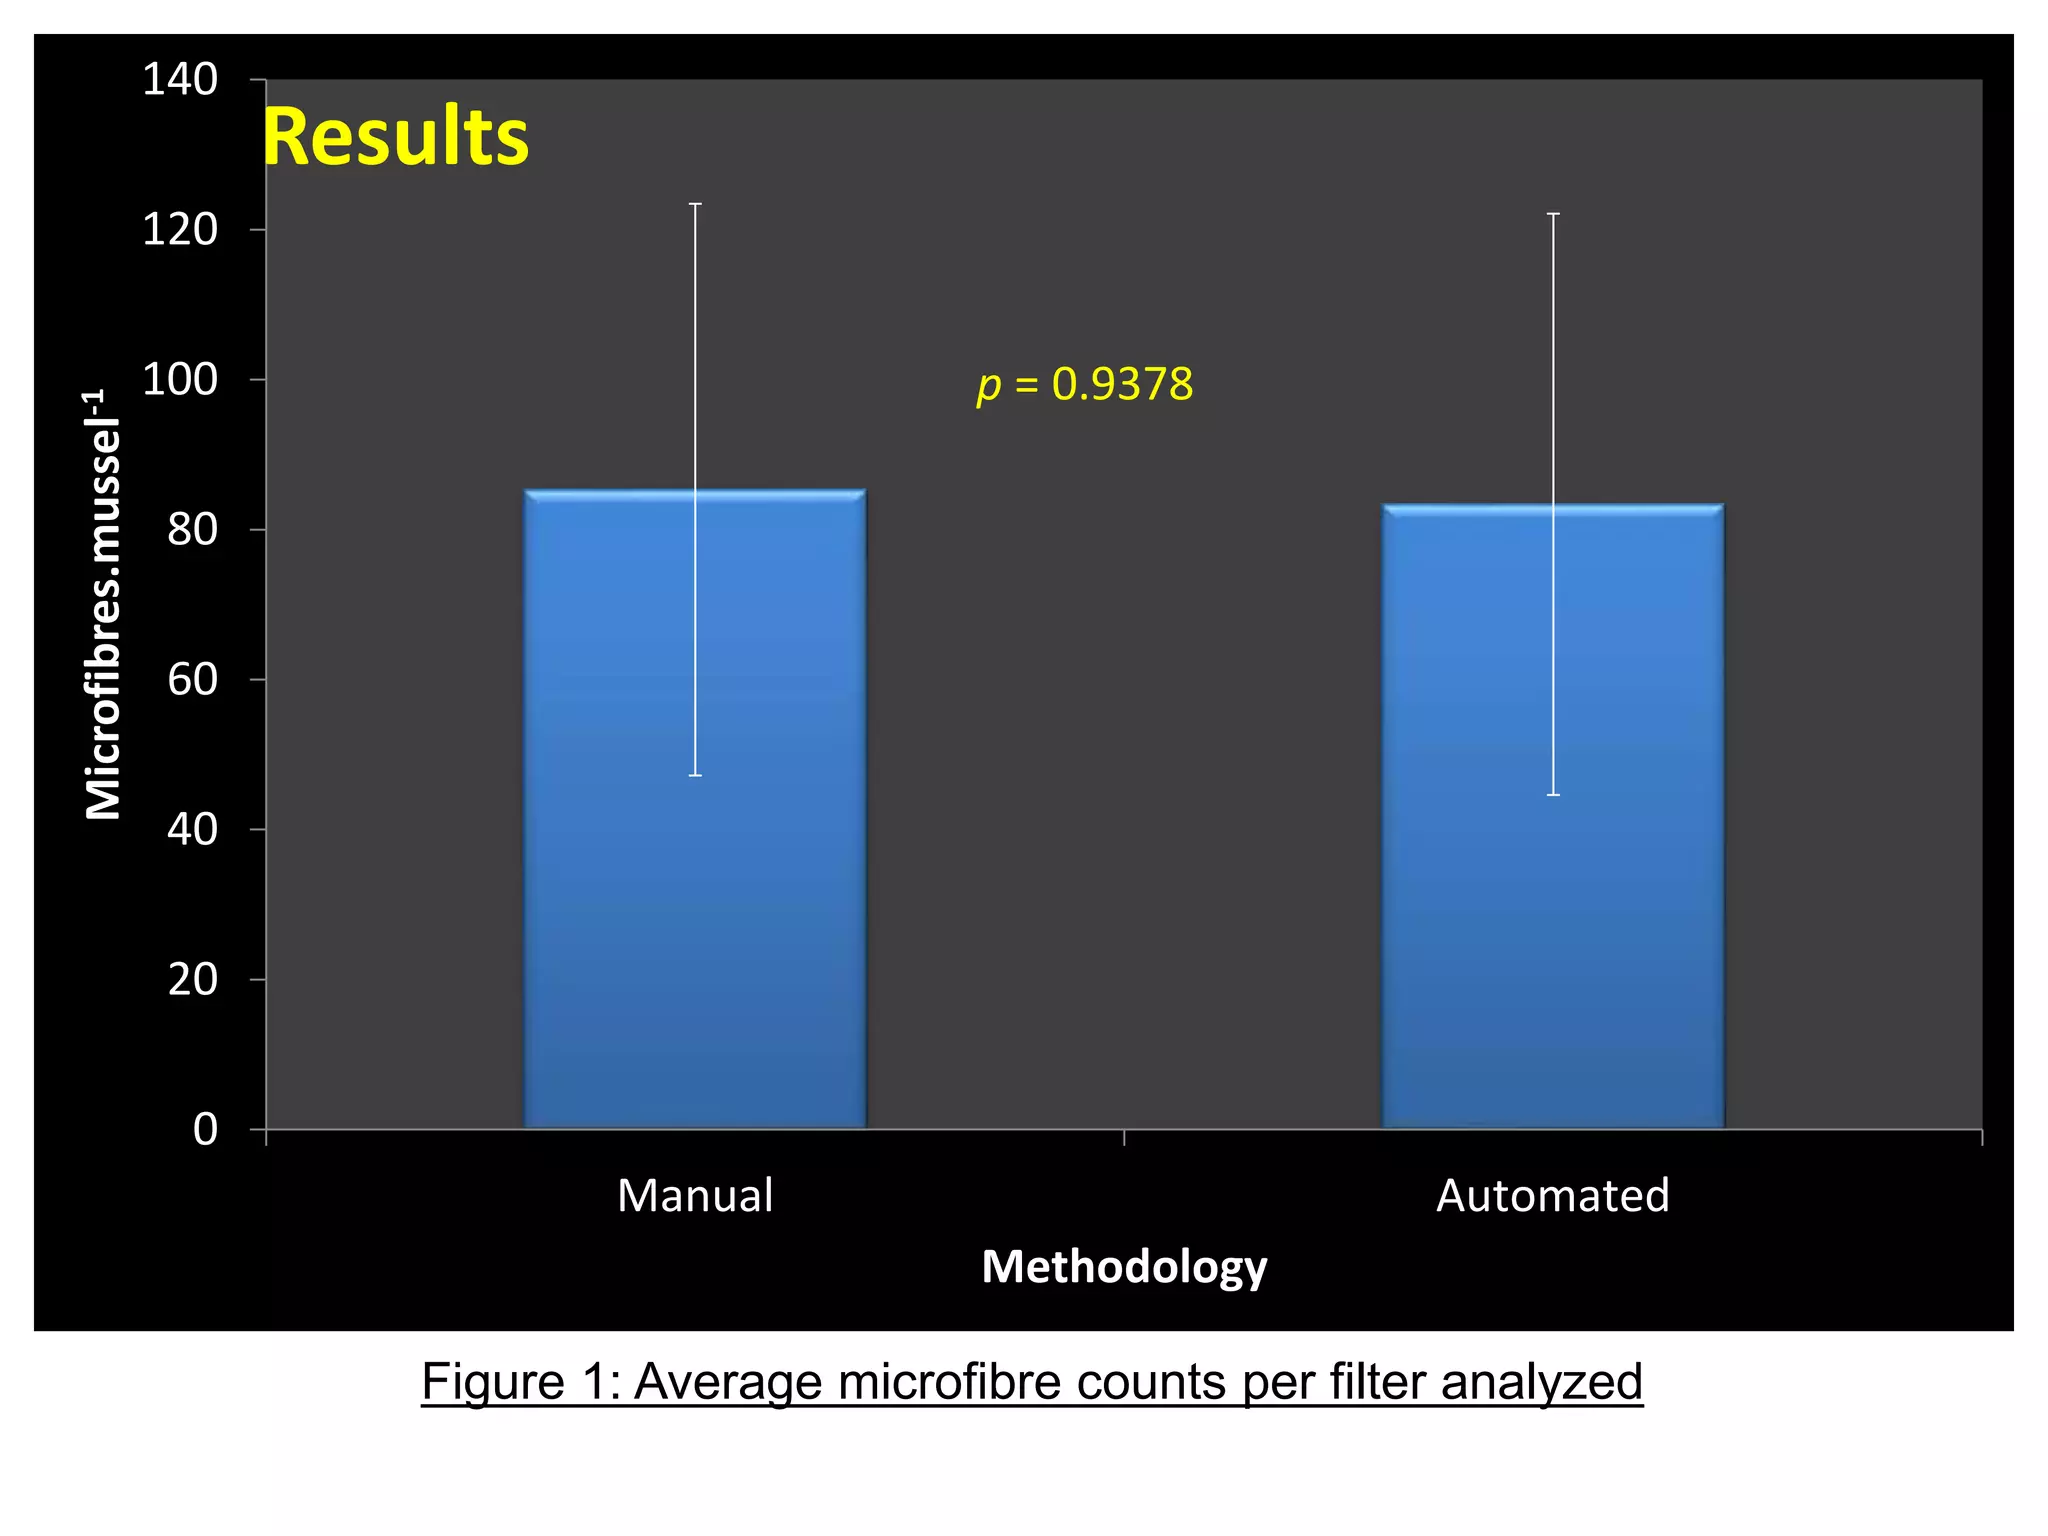
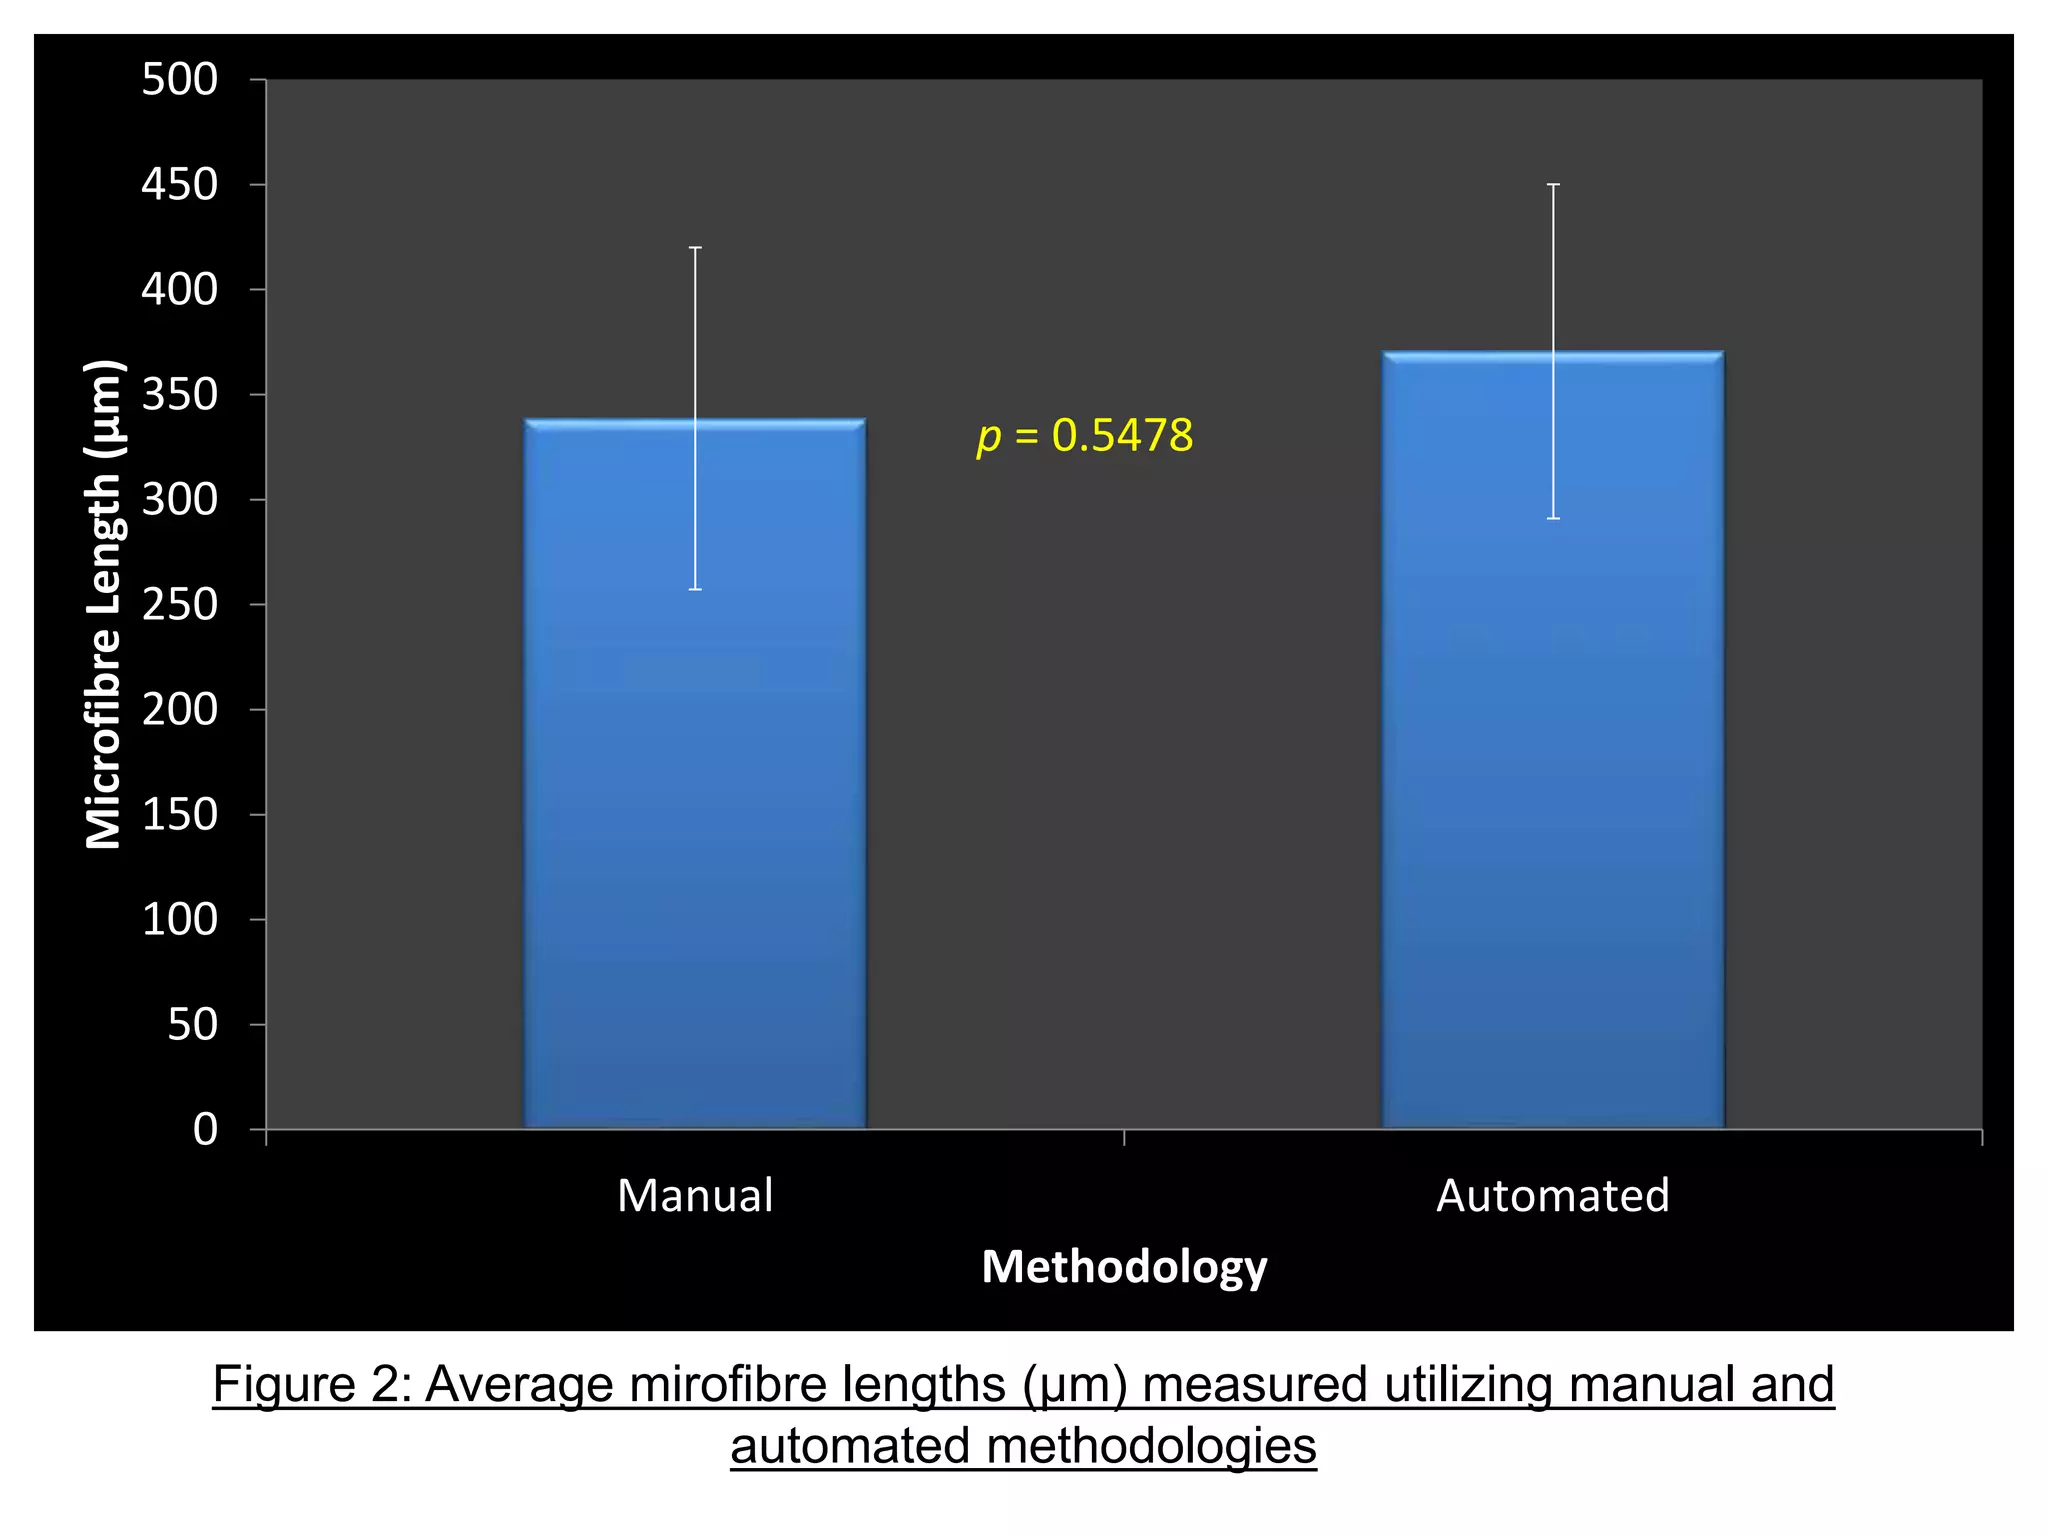
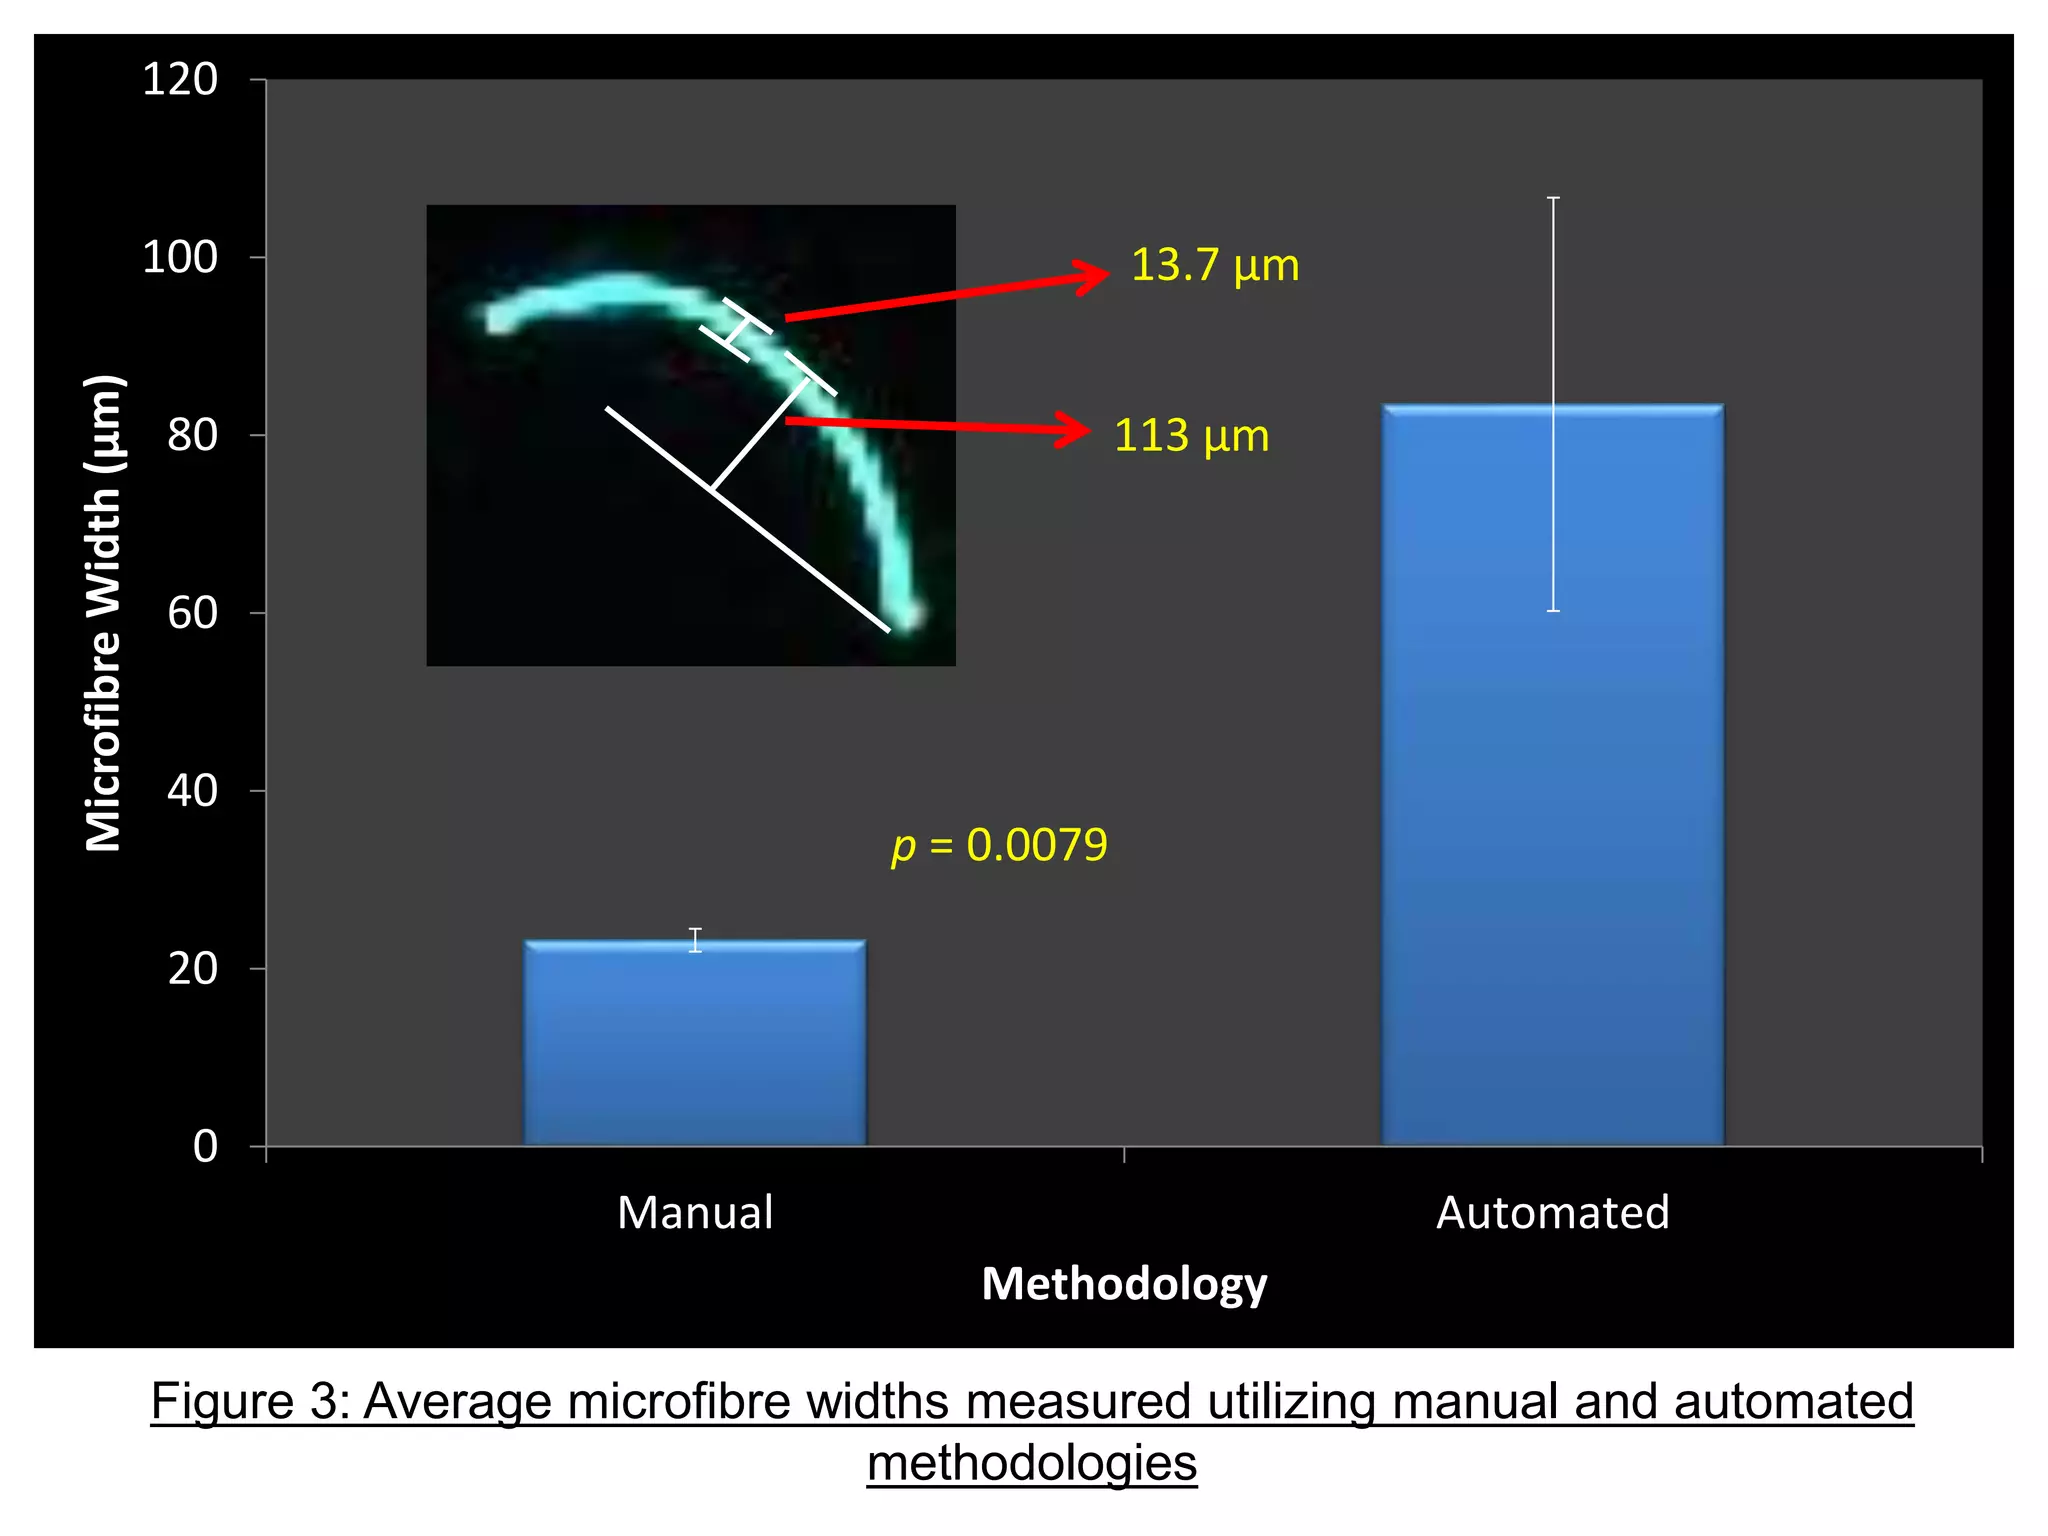
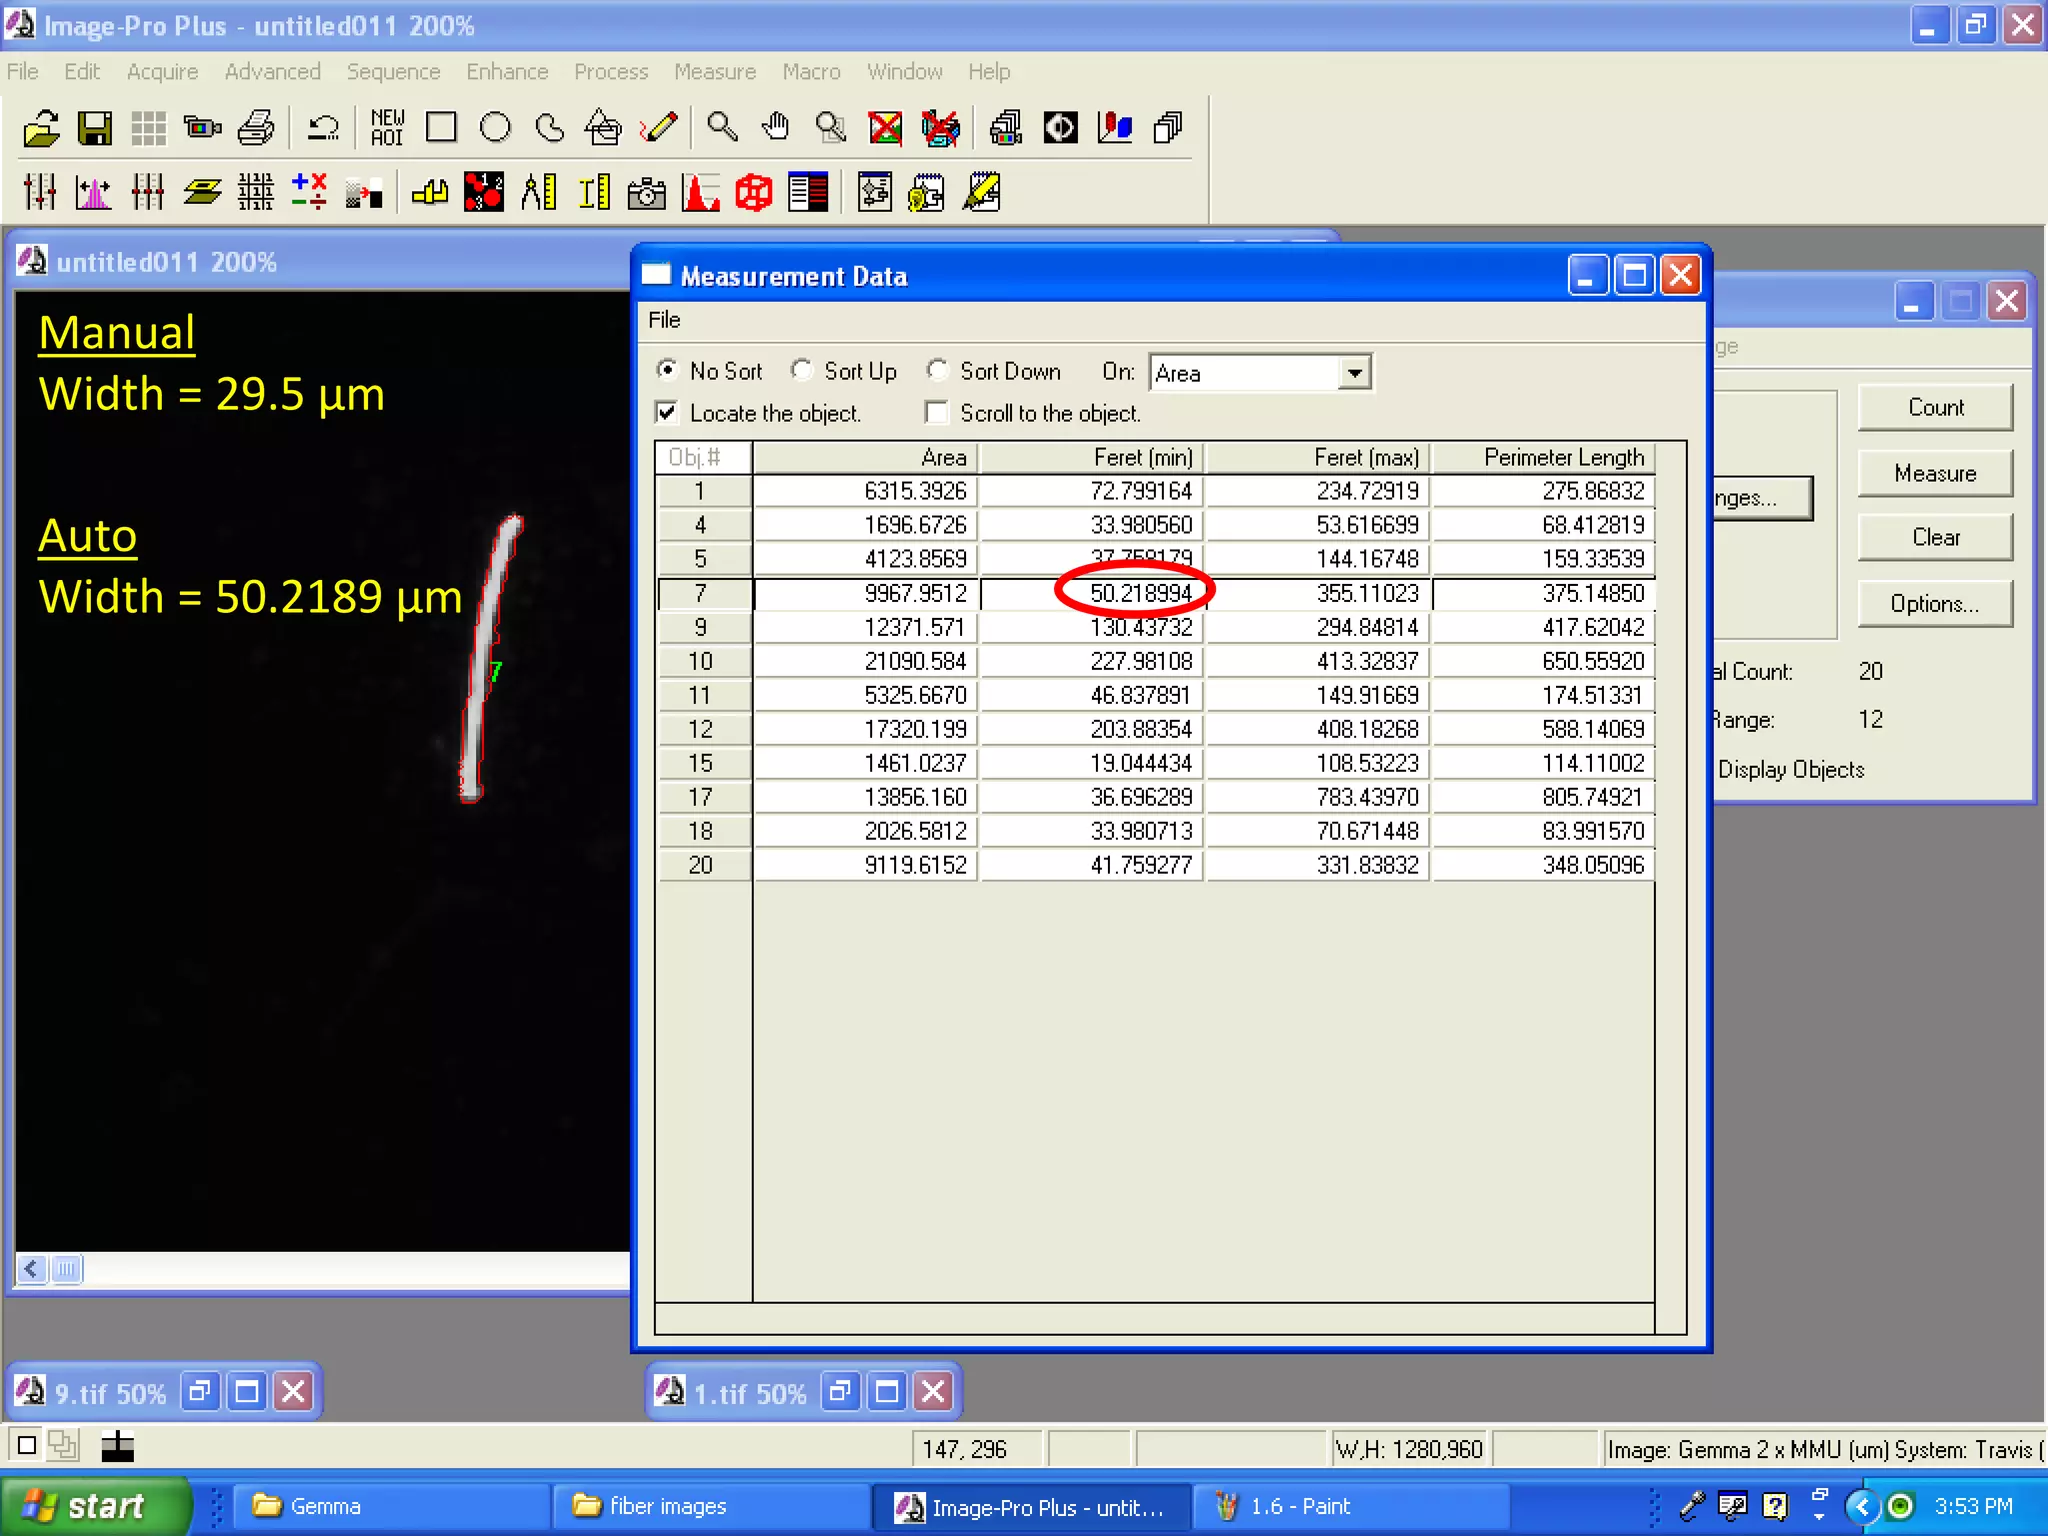
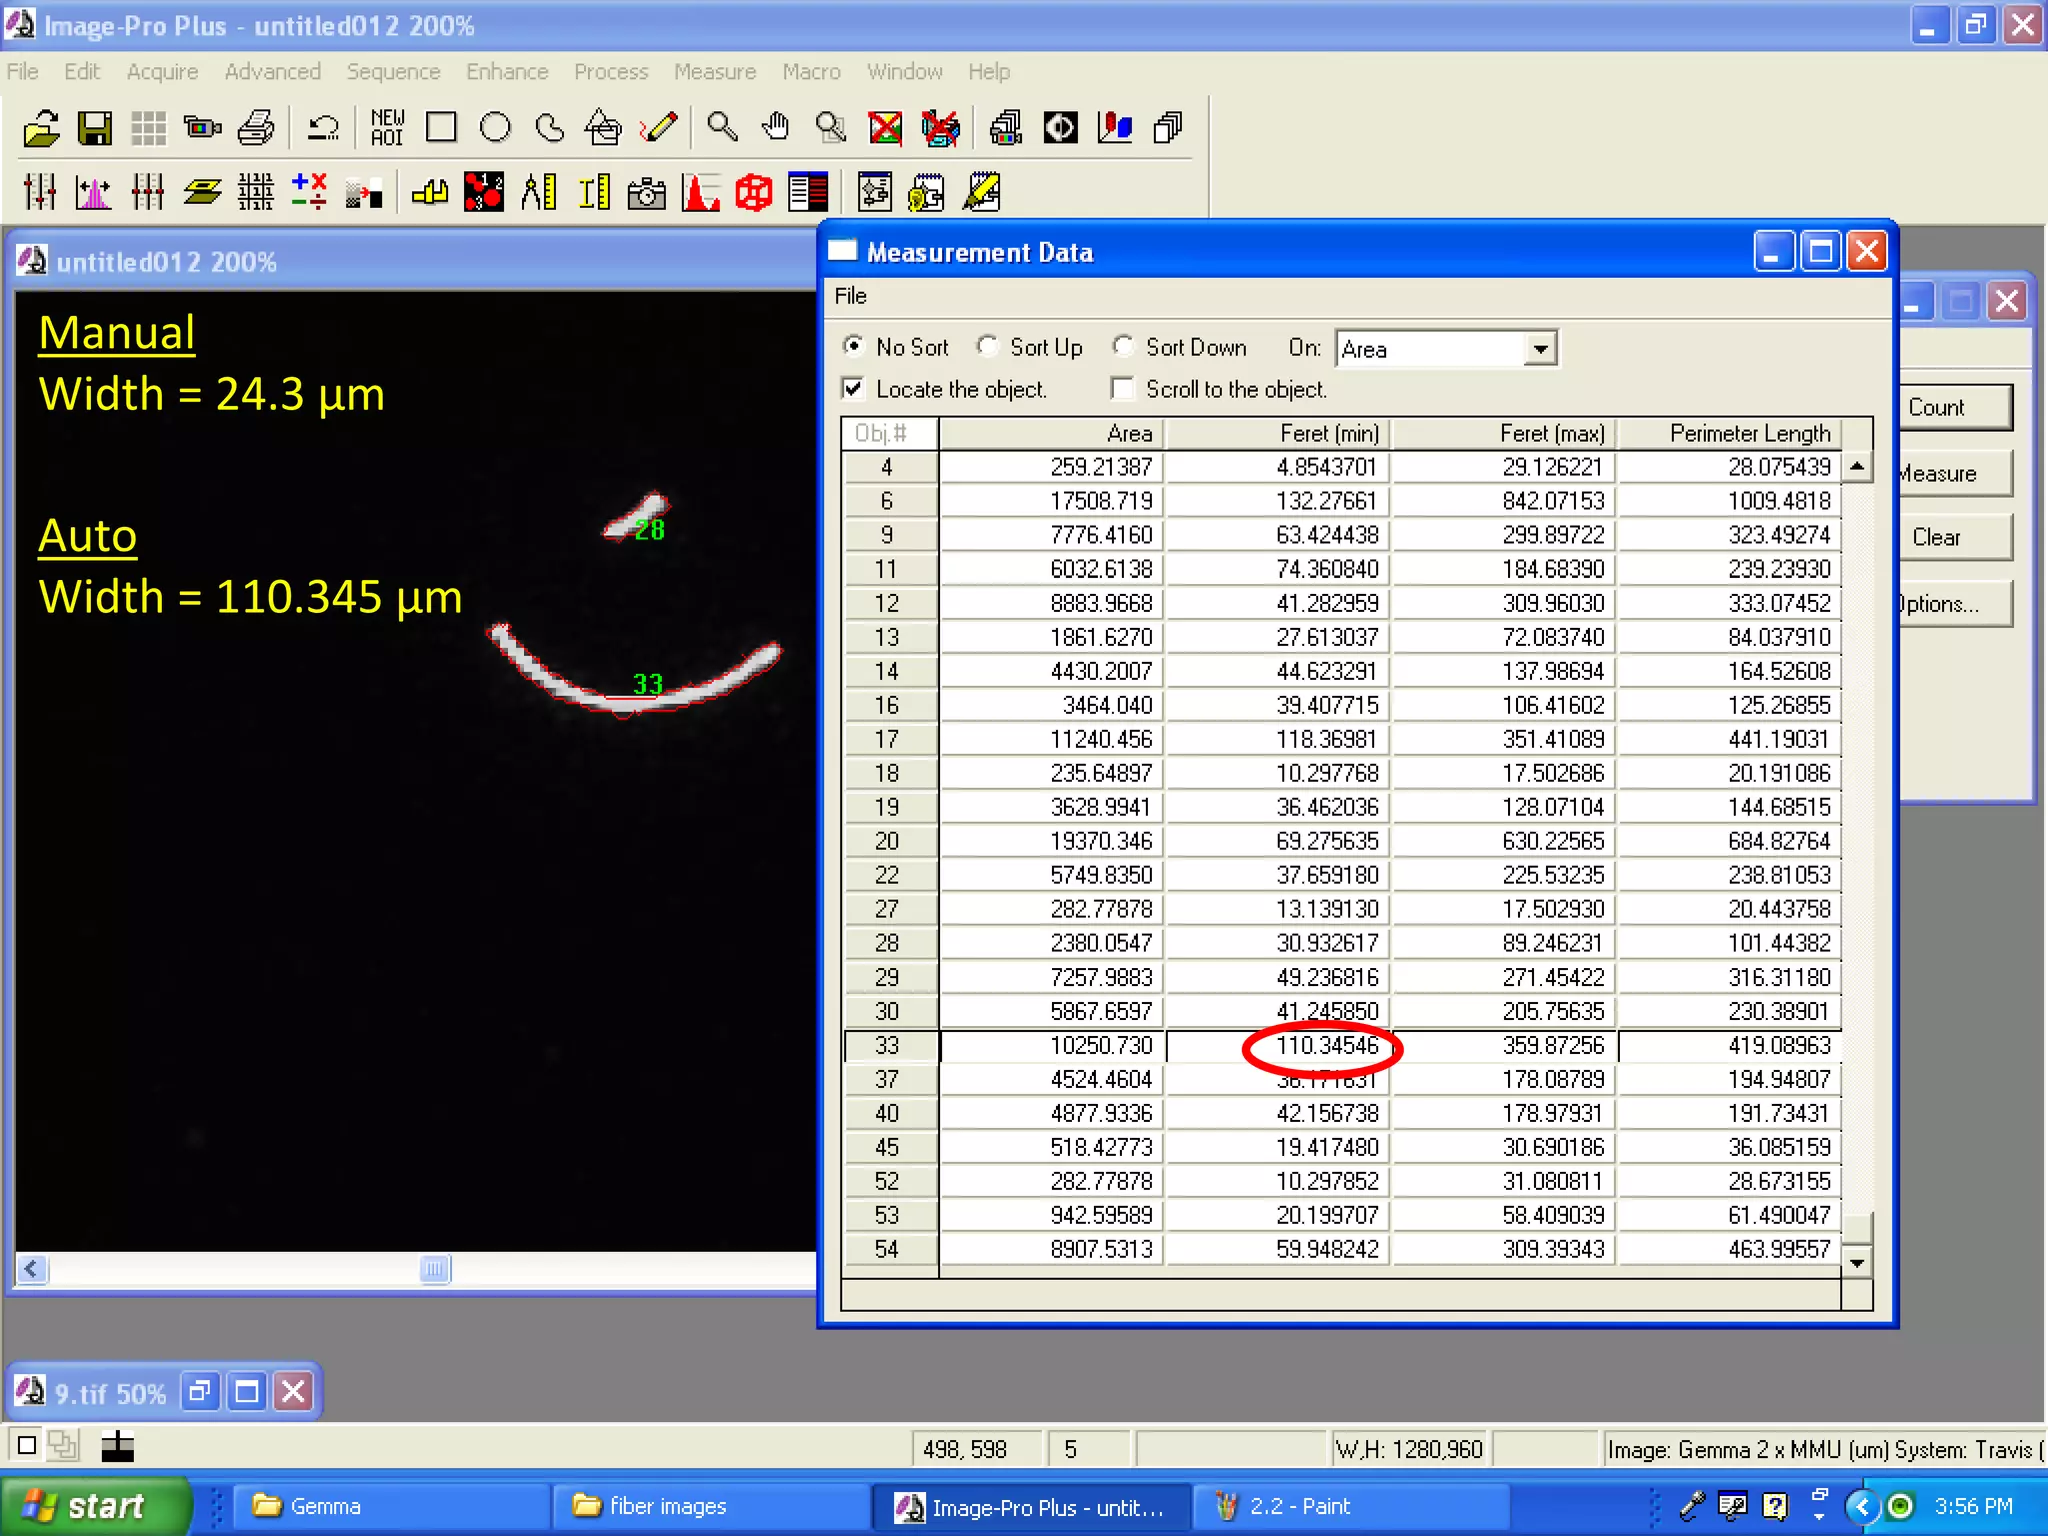
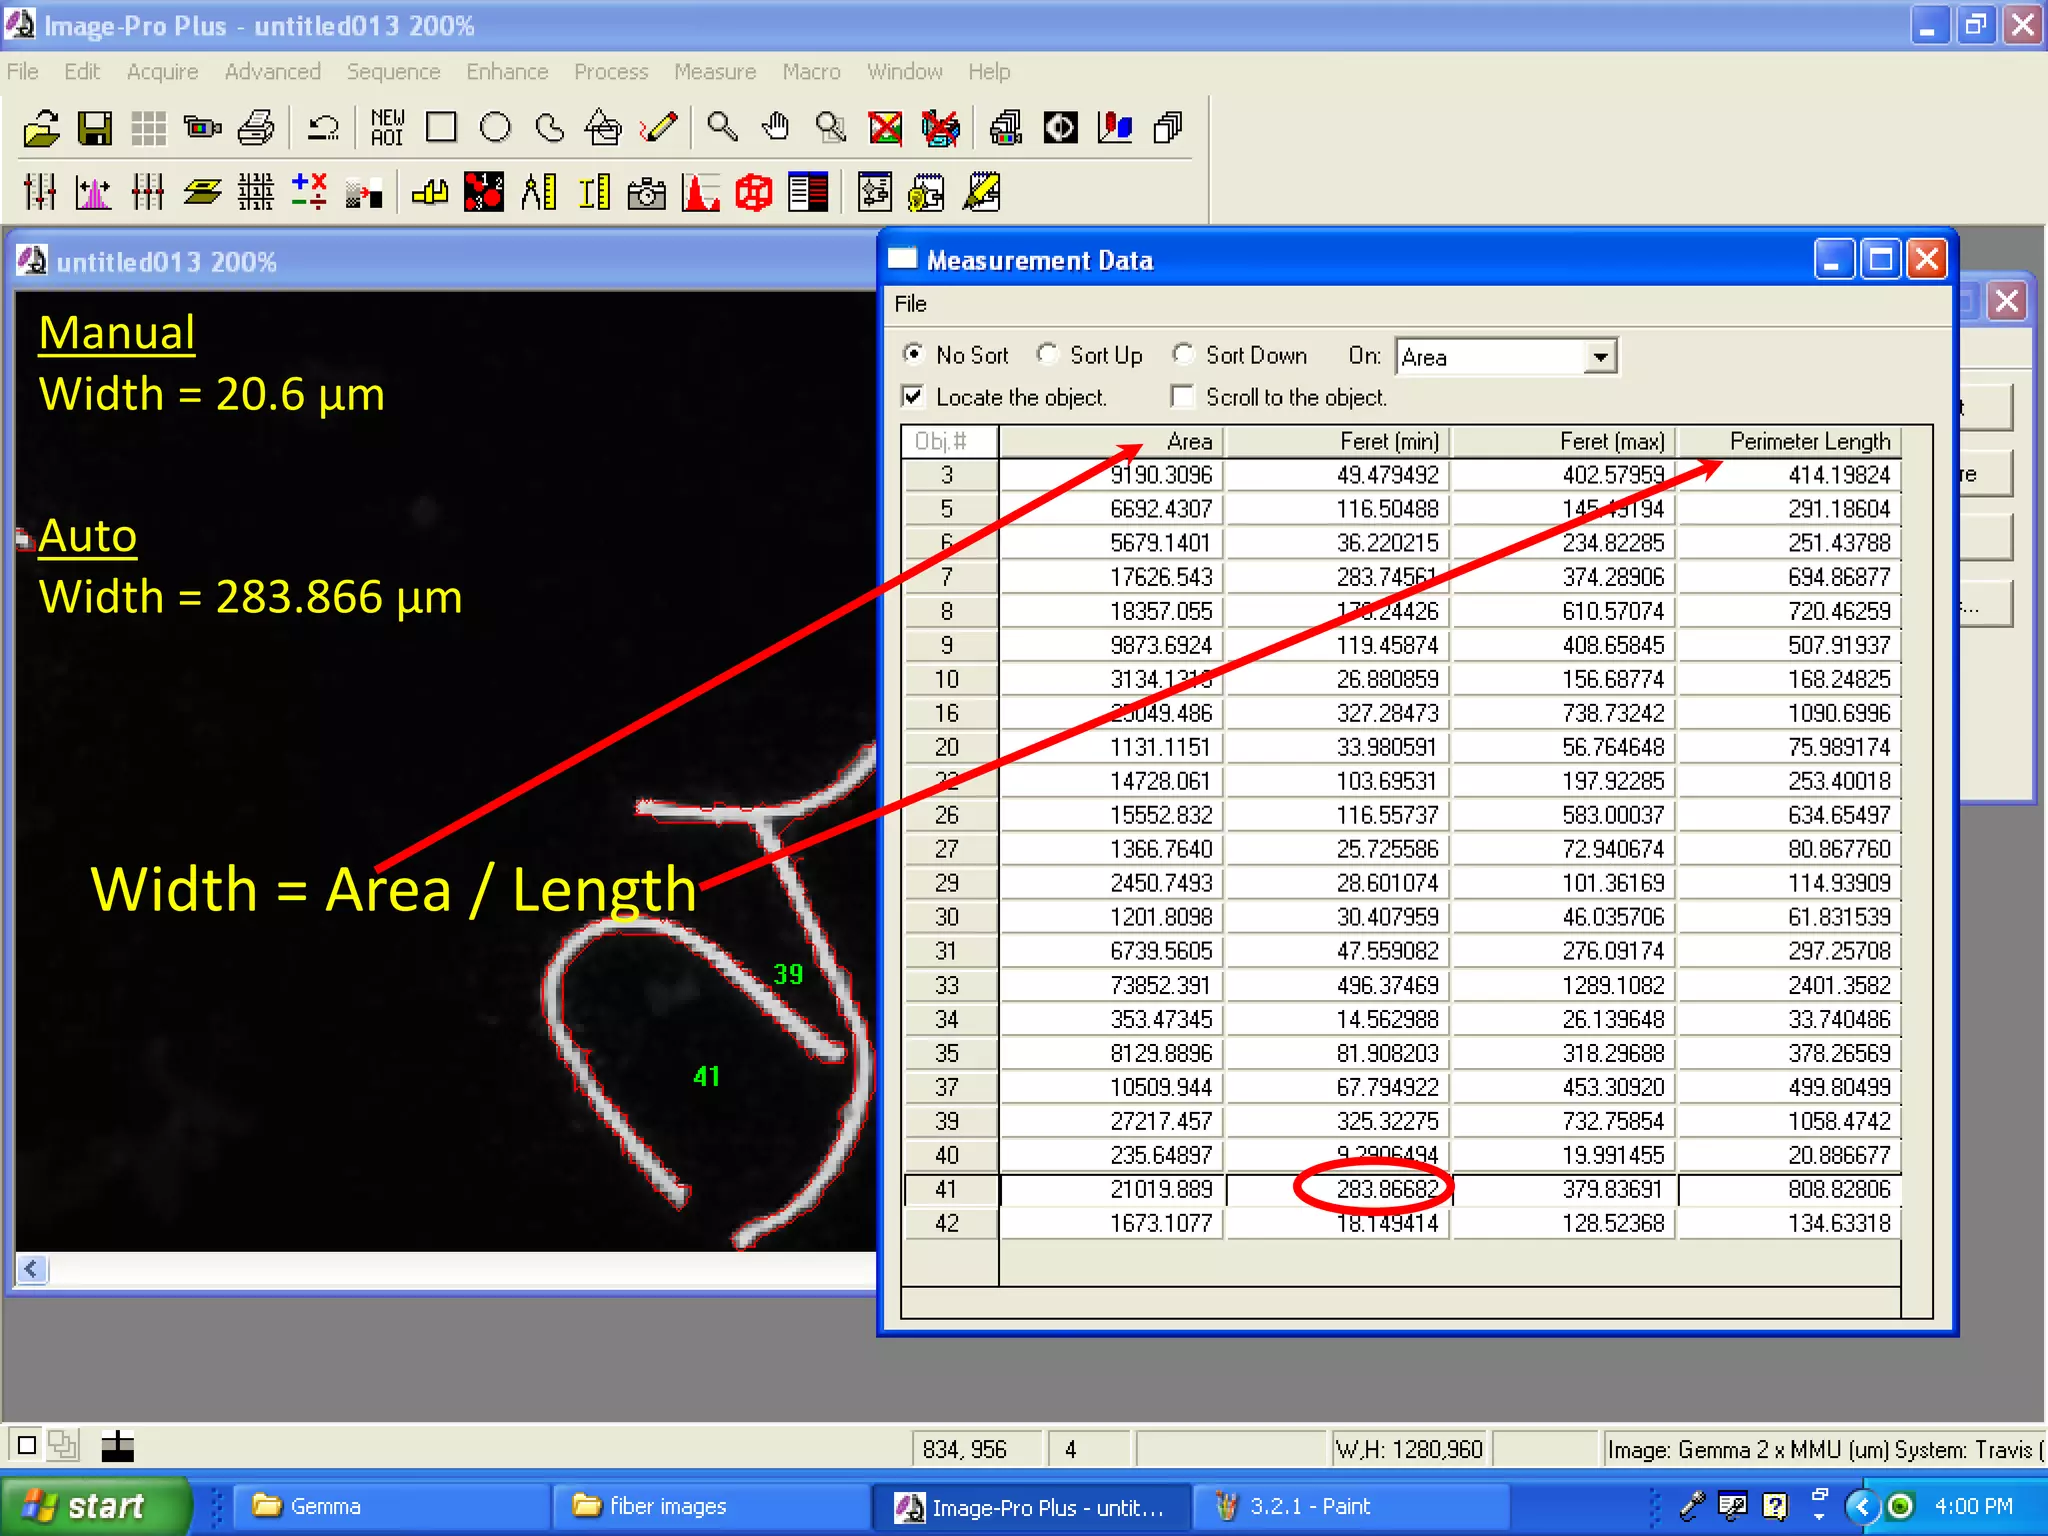
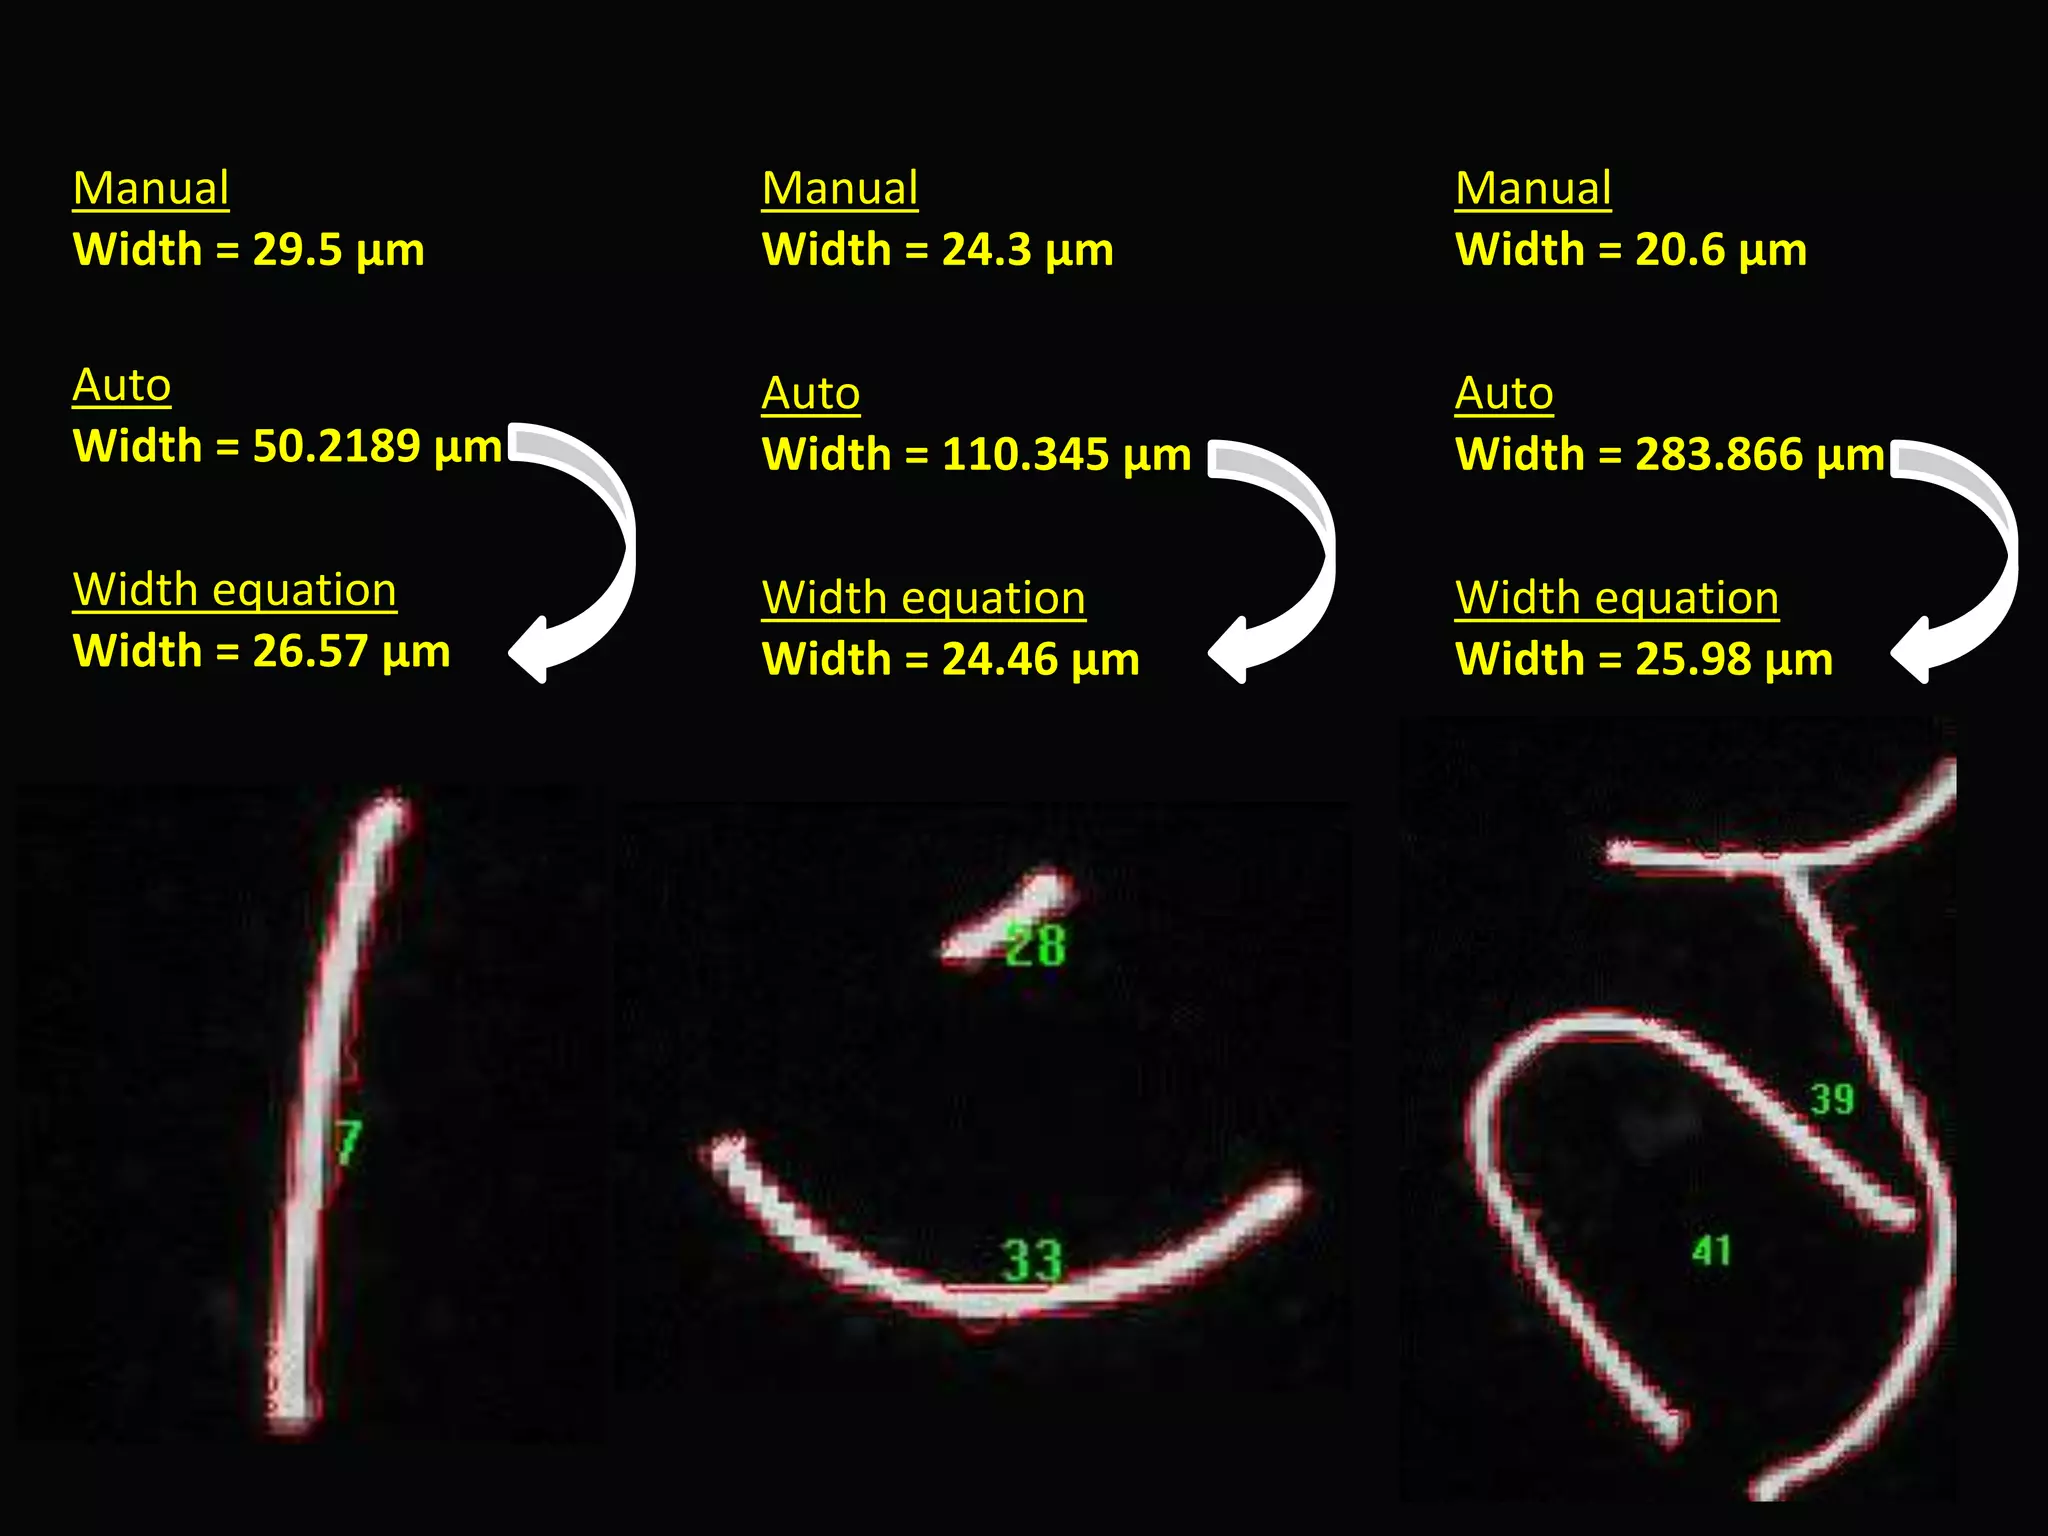
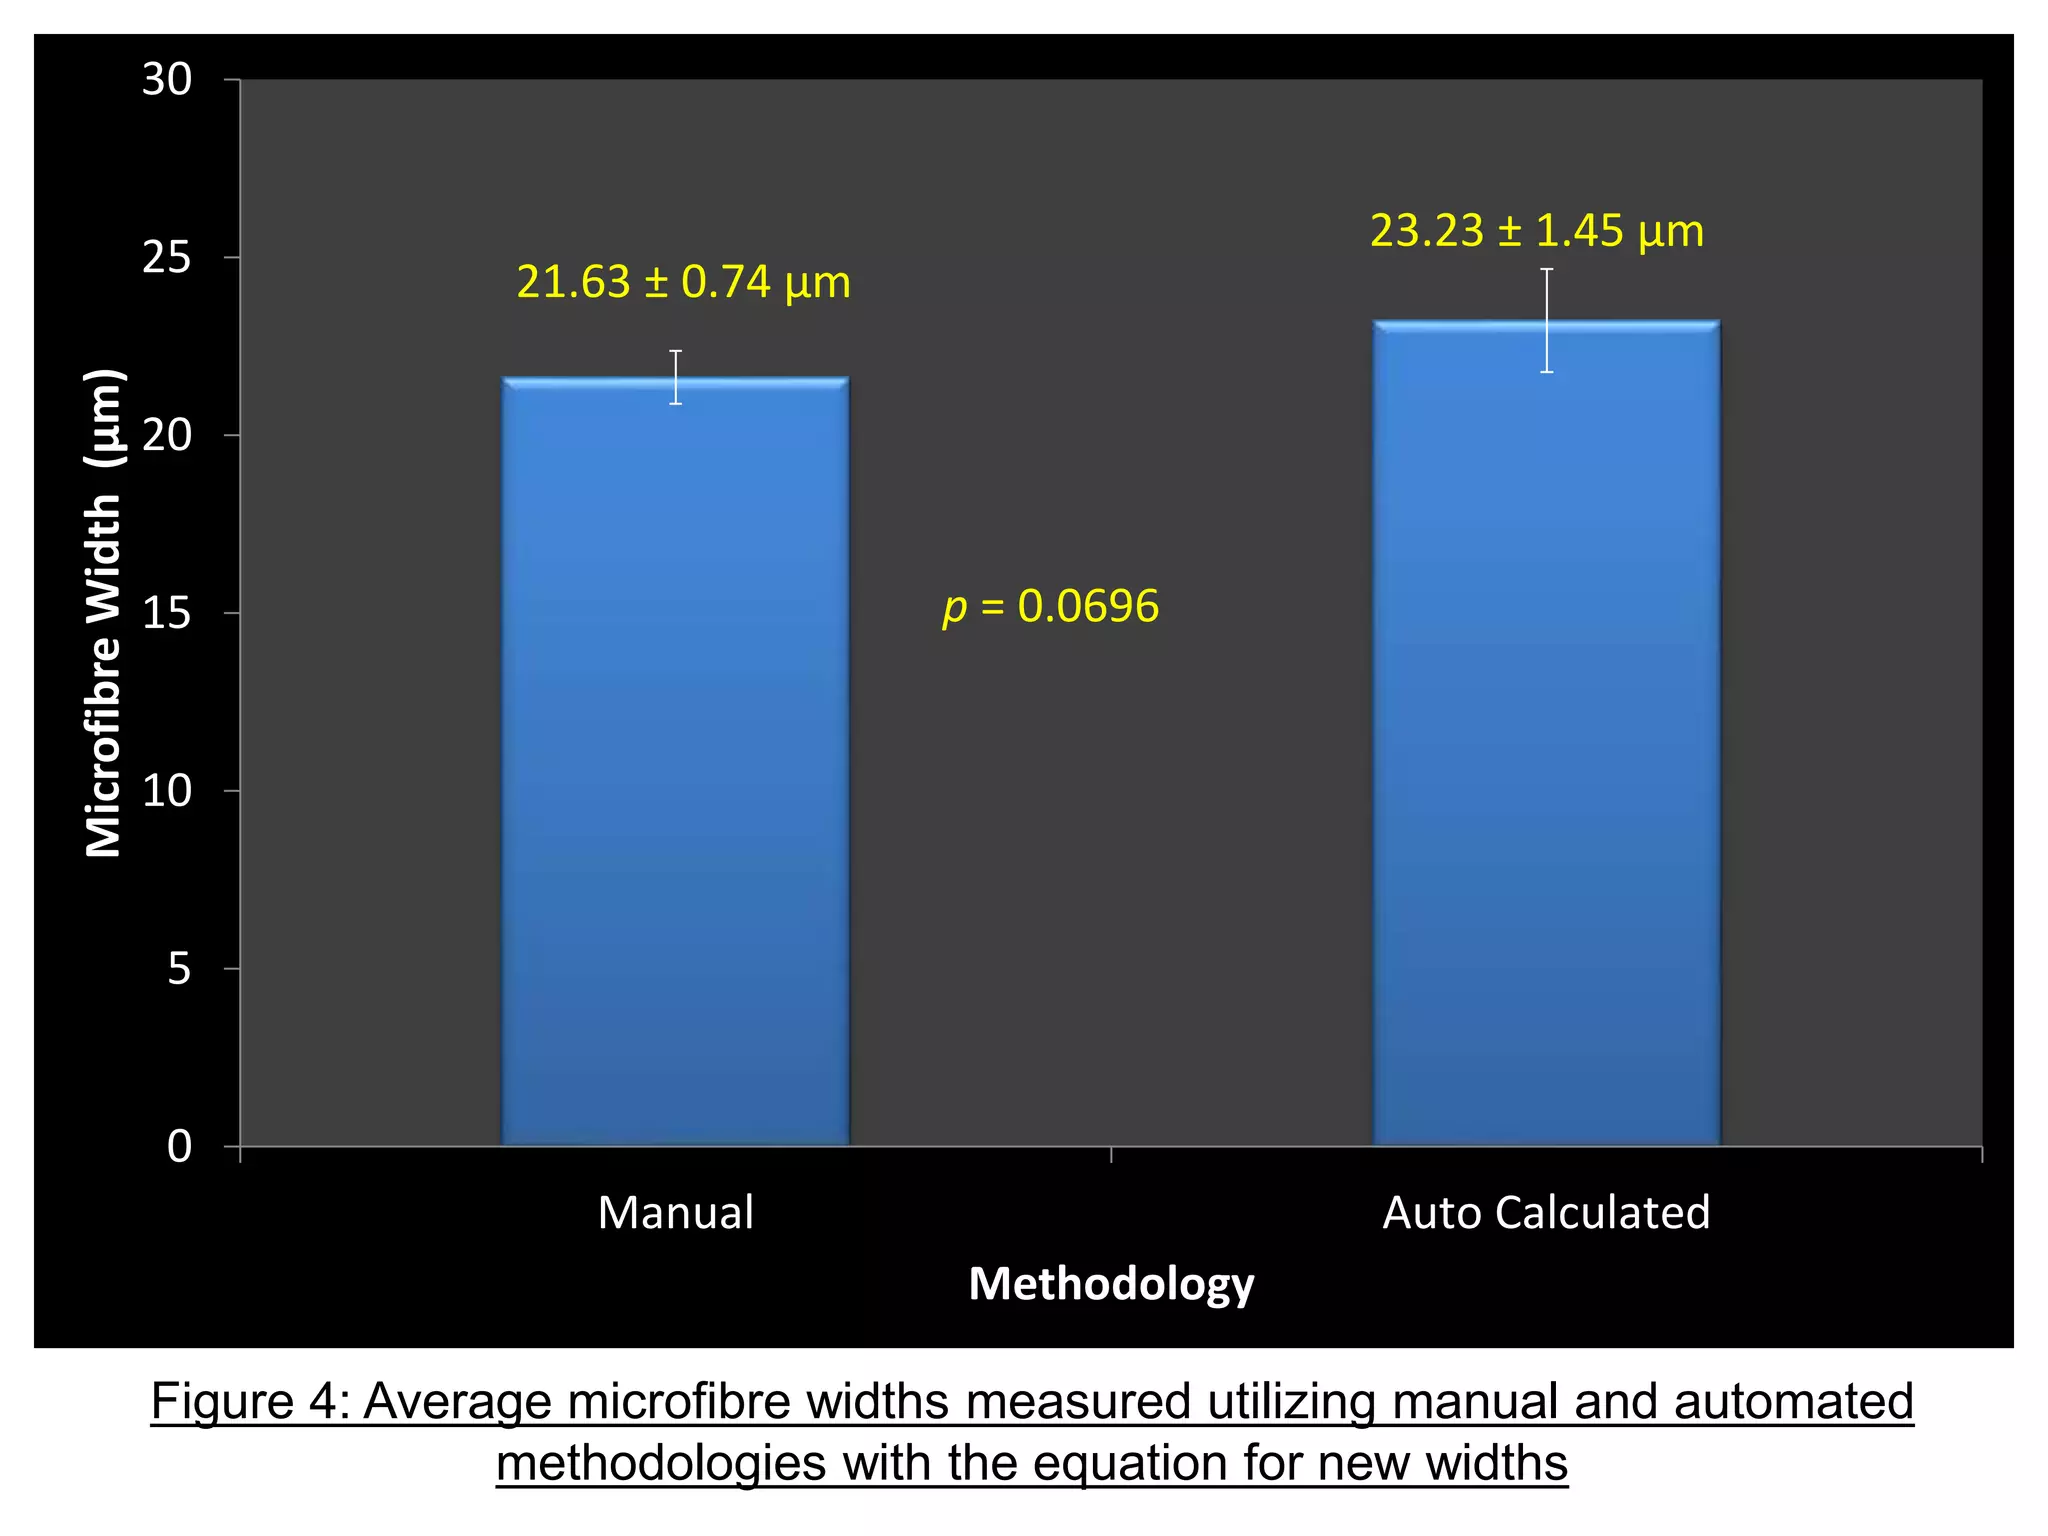
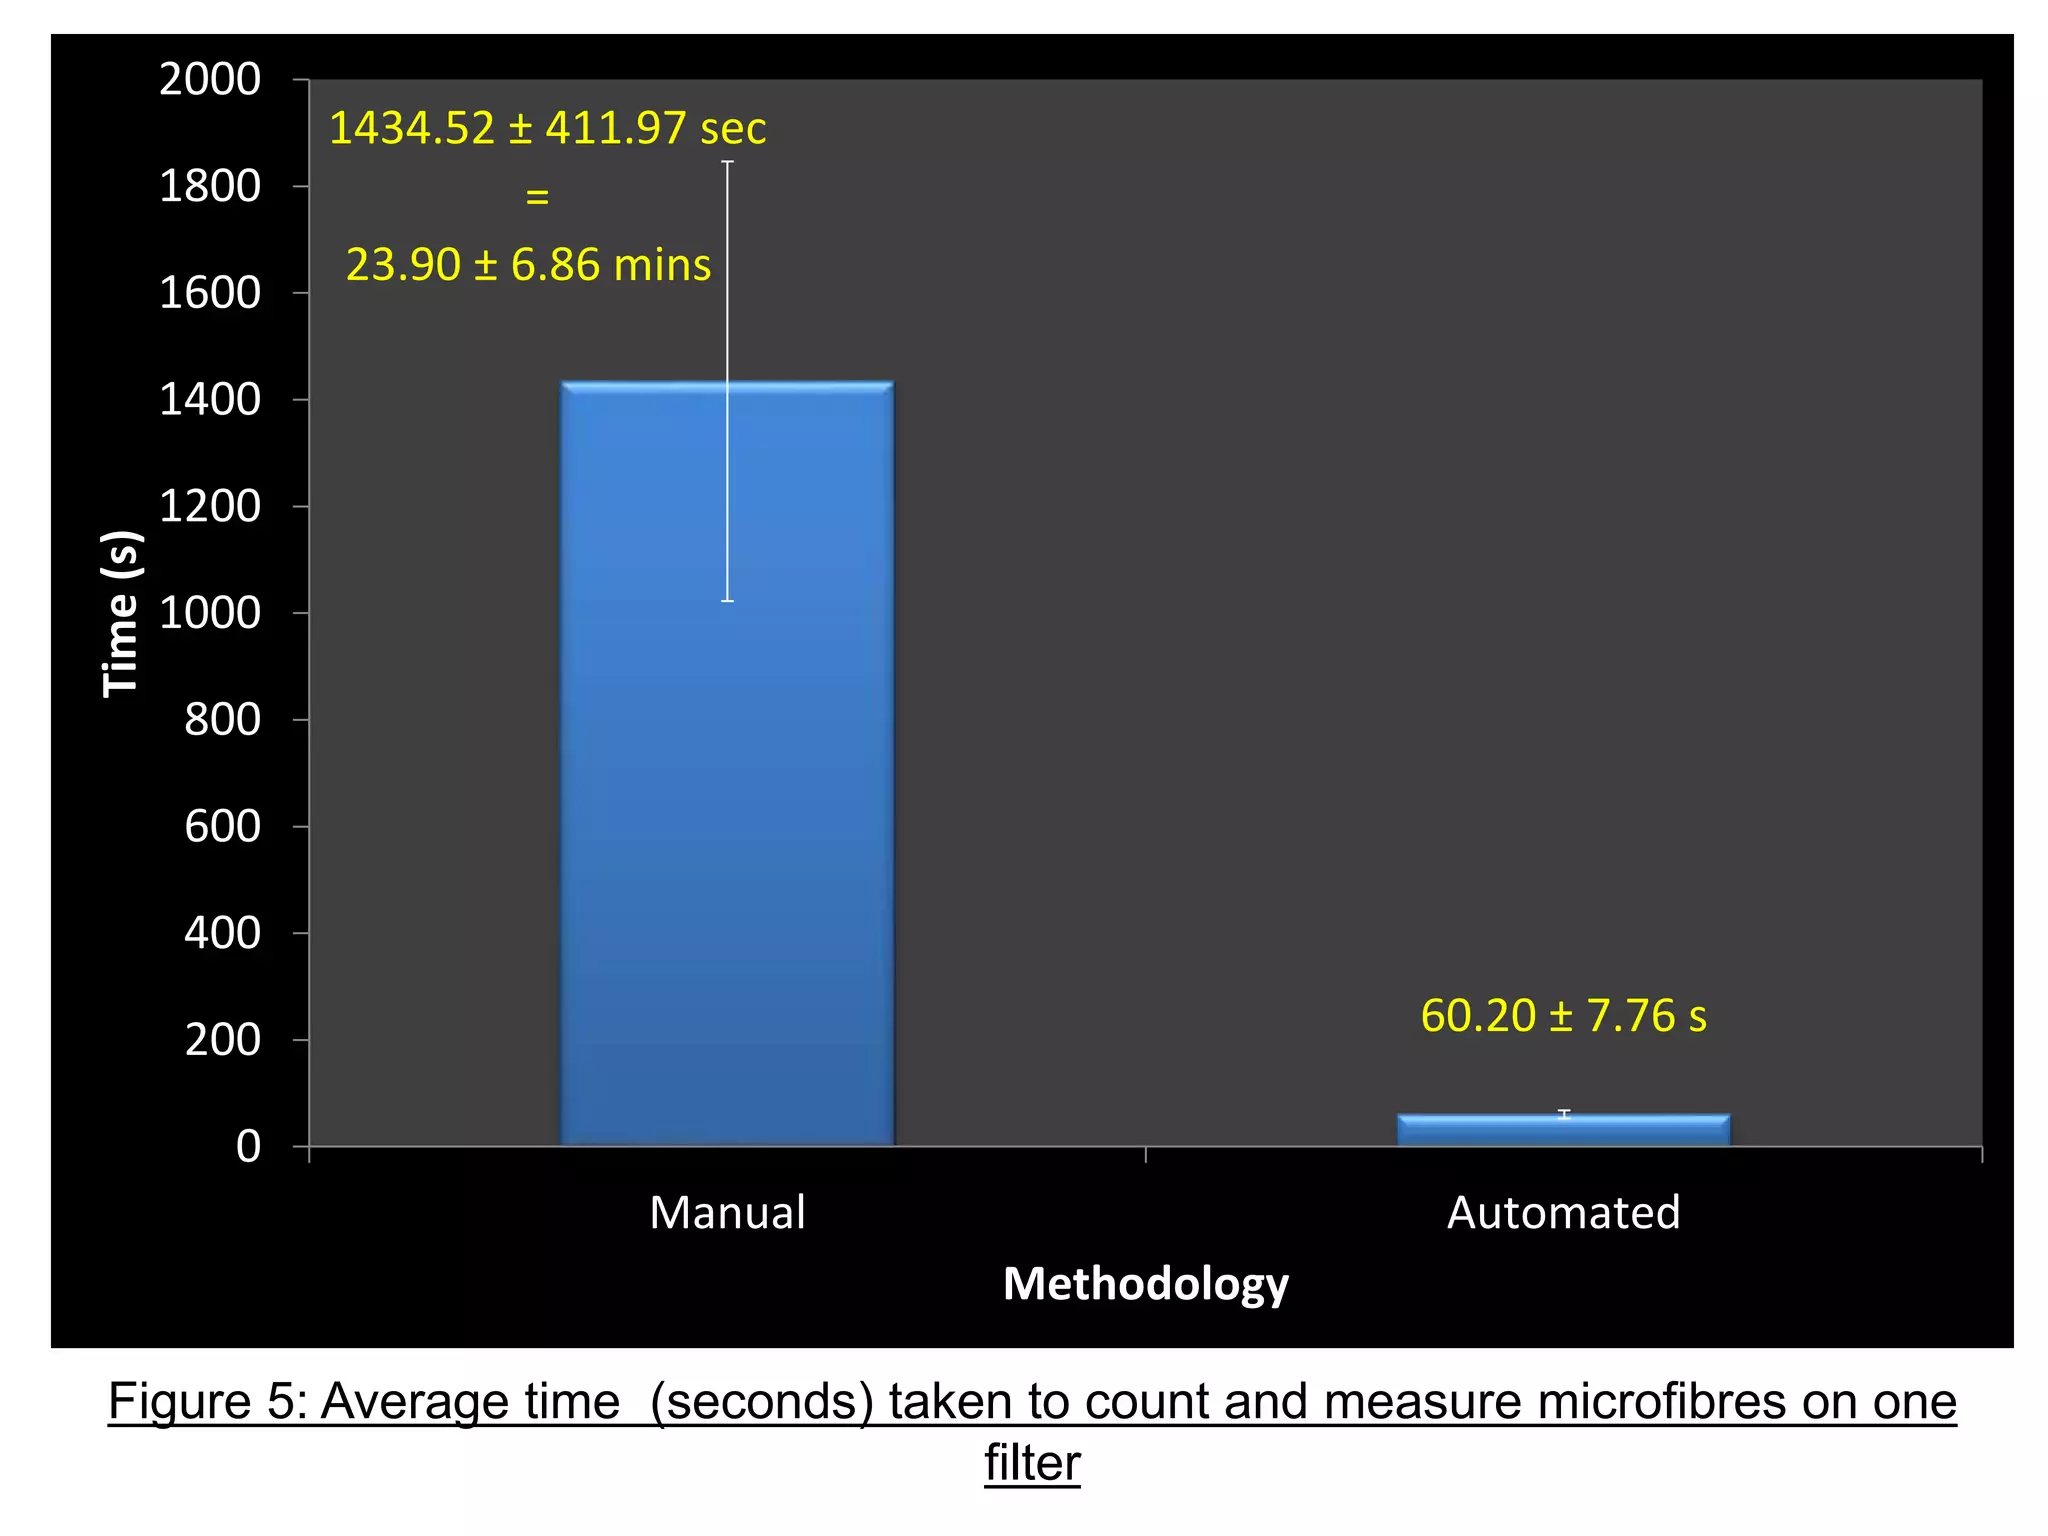

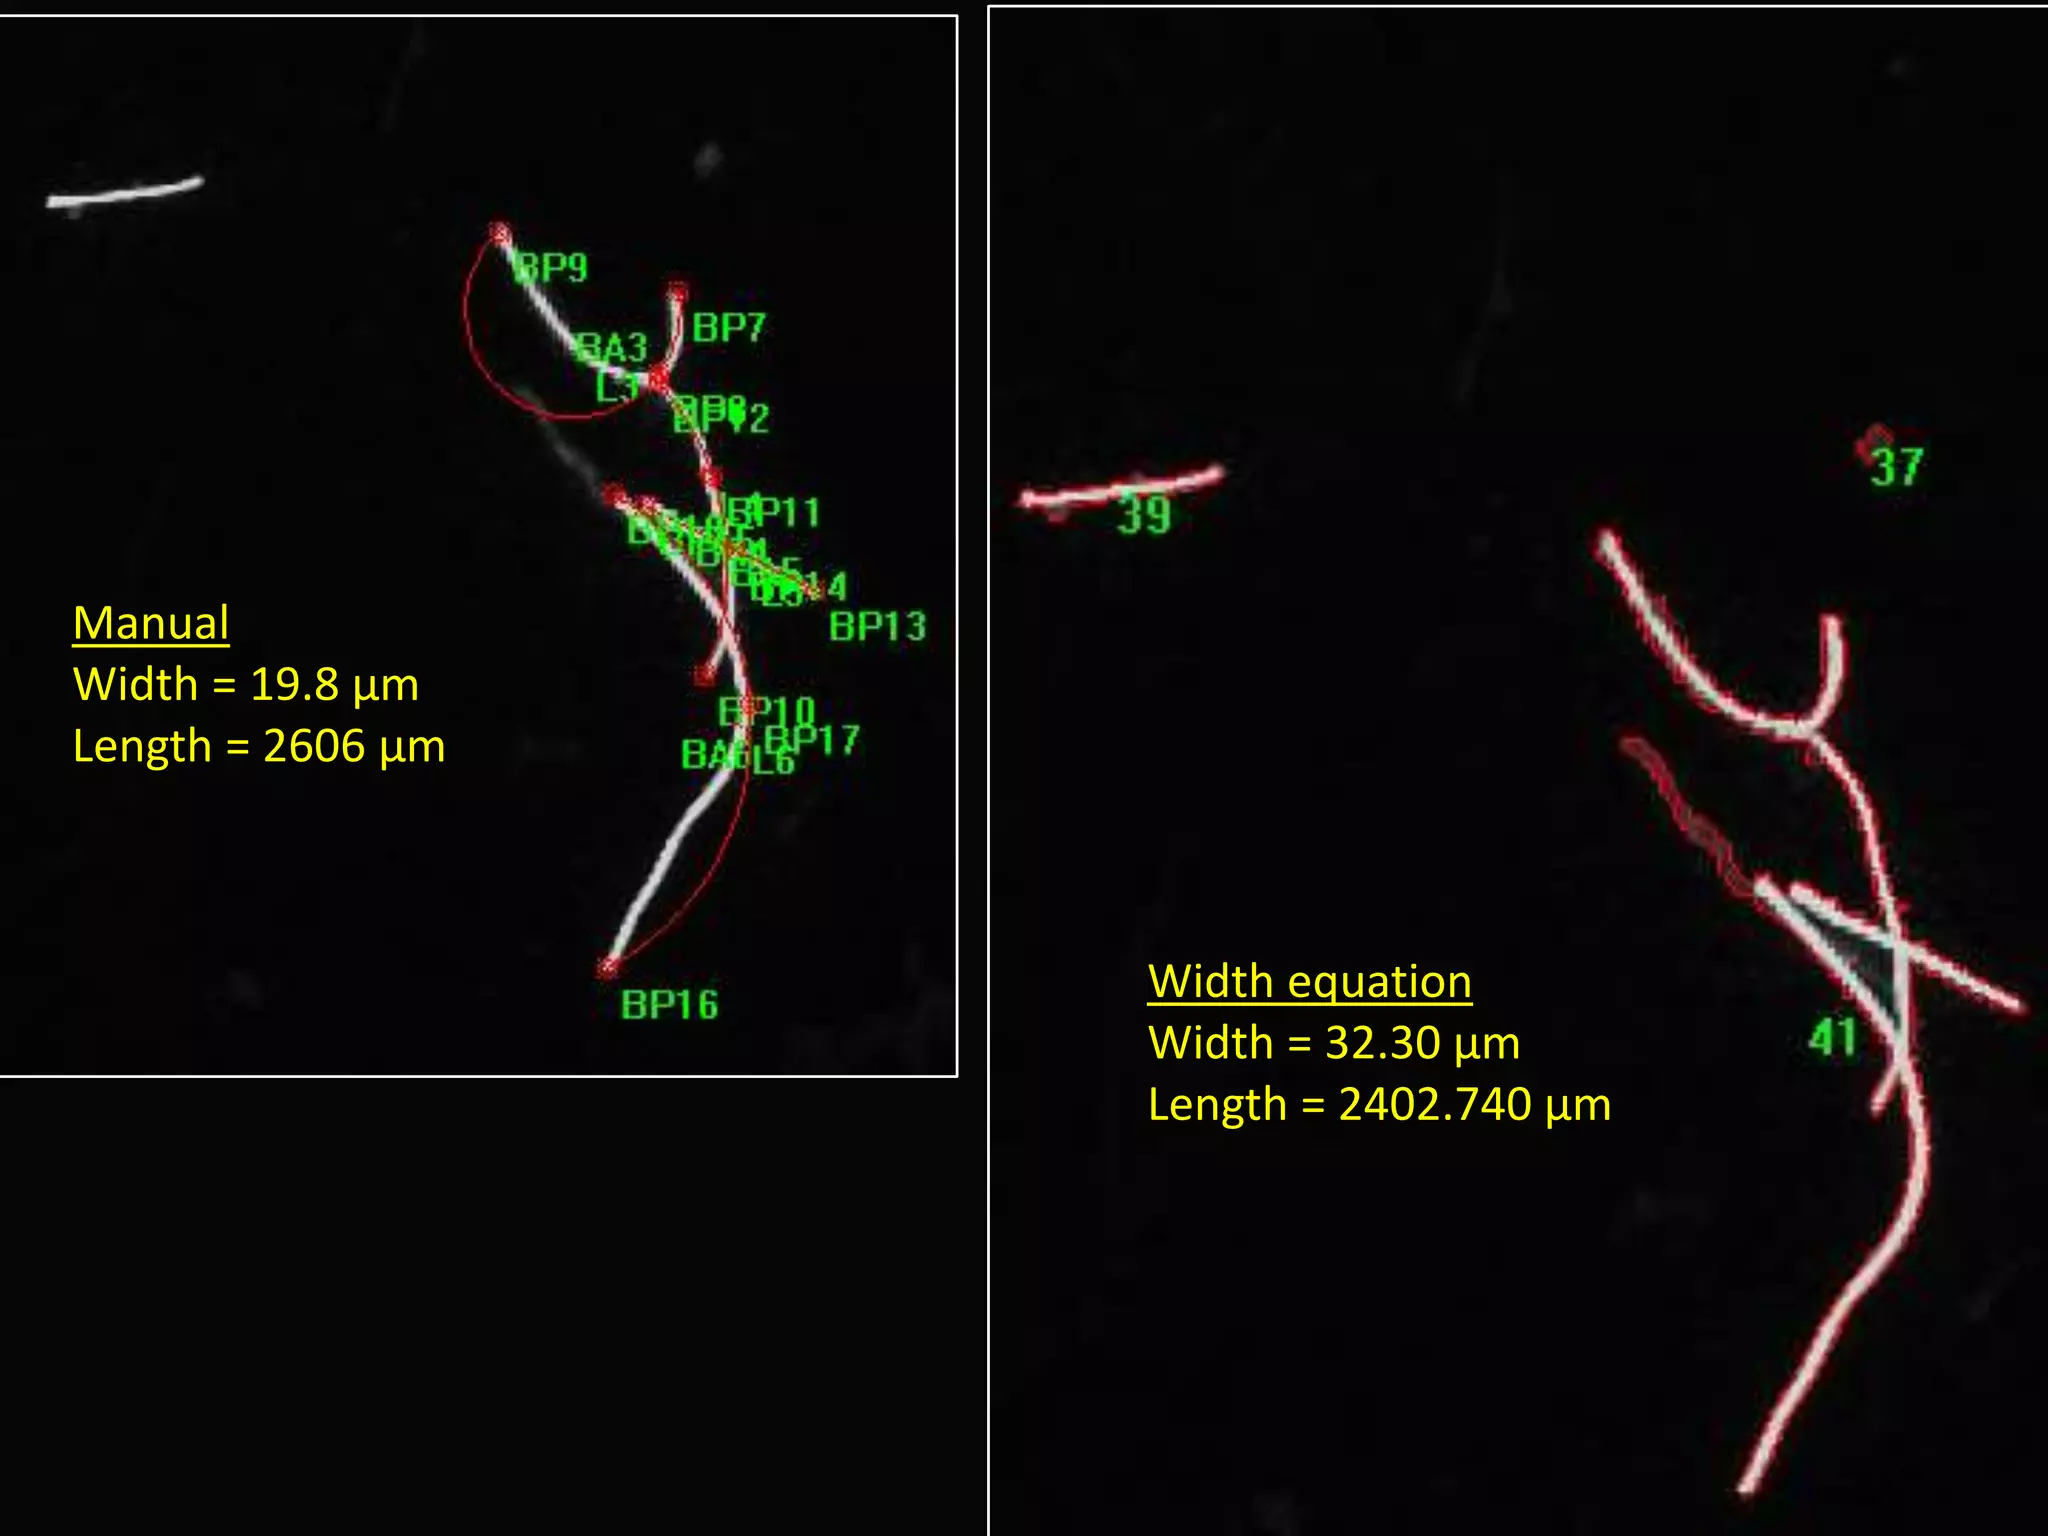
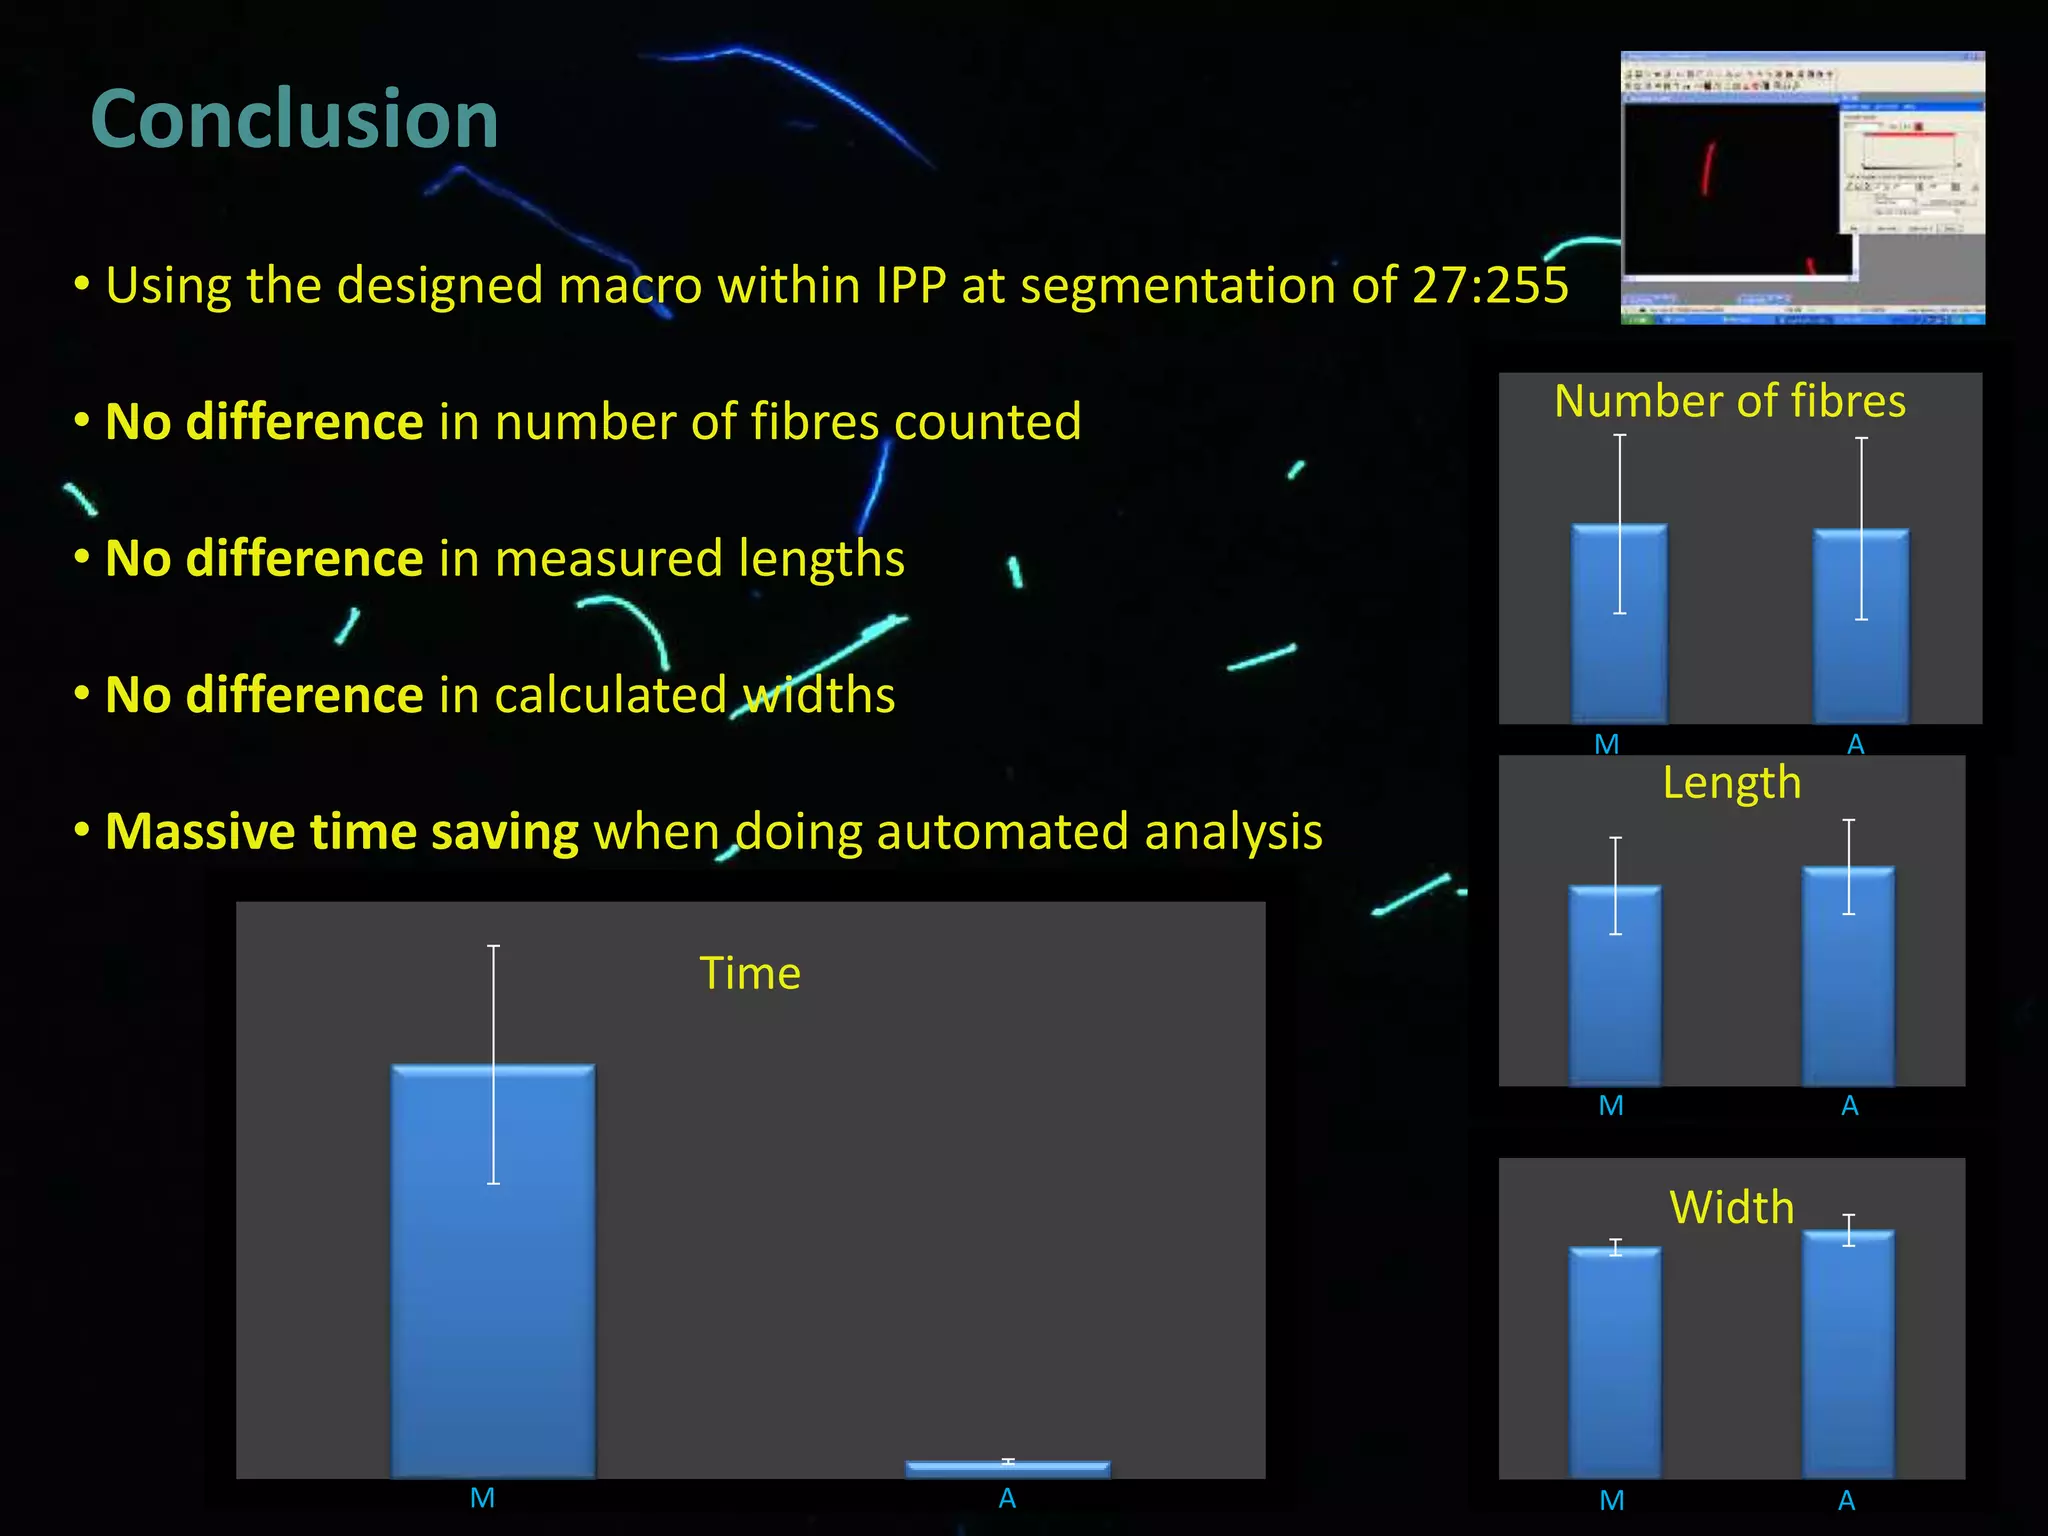

This document describes a method for counting and sizing microplastic fibers using image analysis software. The key points are: - Microplastics are defined as plastic particles less than 5mm in size from primary sources like cleansers or secondary sources like degradation of larger plastics. - A method was developed using fluorescent PET fibers and image analysis software to automatically count, measure length and width, and calculate fiber properties. - The automated method was found to produce similar counts and length measurements as manual counting, but was much faster taking on average 1 minute versus 24 minutes for manual counting. - The automated method provides an accurate and efficient way to analyze microplastic fibers that can be applied to research on micropl


